New: NextGenTemplates Academy - video courses on Excel formulas with AI and Pivot Tables & dashboards. Early-bird: 20% off with code EARLYBIRD20 - first 20 orders only.See the courses →
PKComments Off on Profitability Analysis Pack in Excel
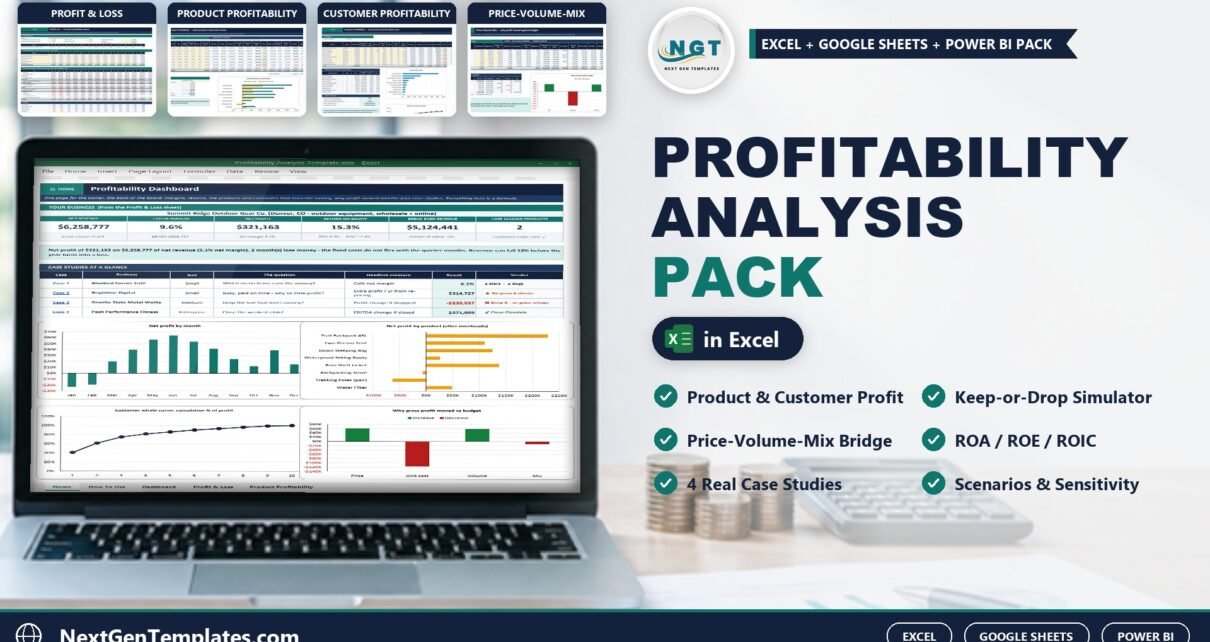
Sales are up, so why is there so little profit left at the end of the year? The Profitability Analysis Pack in Excel answers that by showing which products, customers
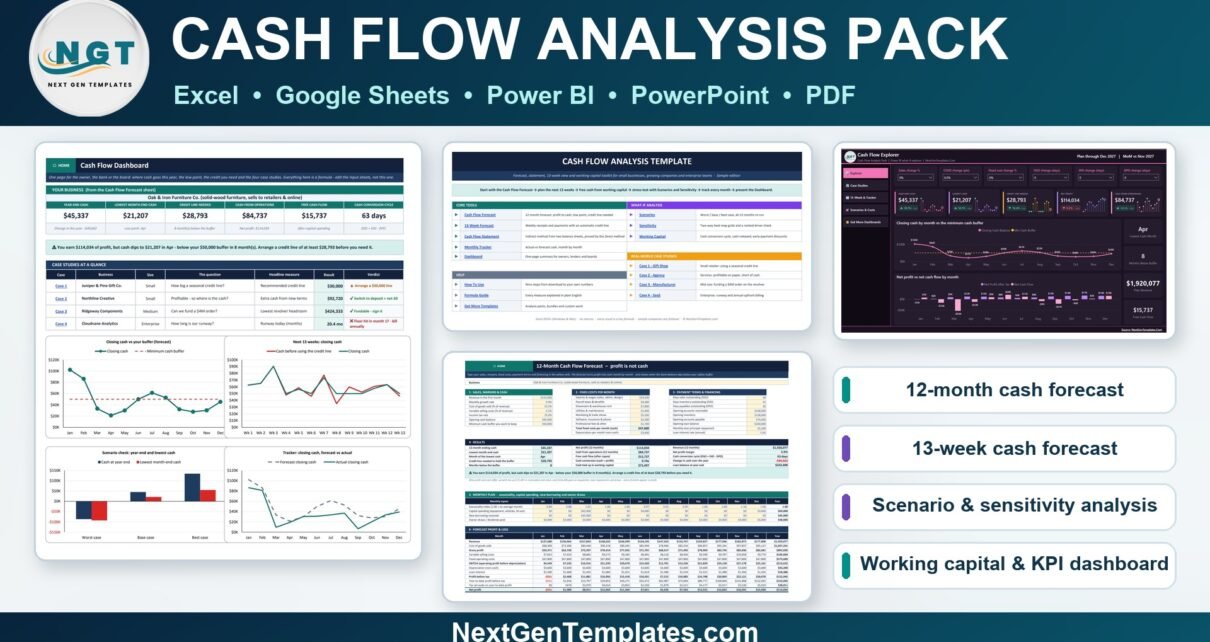
A business can show a healthy profit and still run out of cash. The Cash Flow Analysis Pack shows where the money goes and when the bank balance will dip,
PKComments Off on Break-Even Analysis Pack in Excel
Every business has a point where revenue exactly covers costs. Below it, every day of trading loses money. The Break-Even Analysis Pack in Excel finds that point for a single
PKComments Off on Bioinformatics Companies Dashboard in Excel
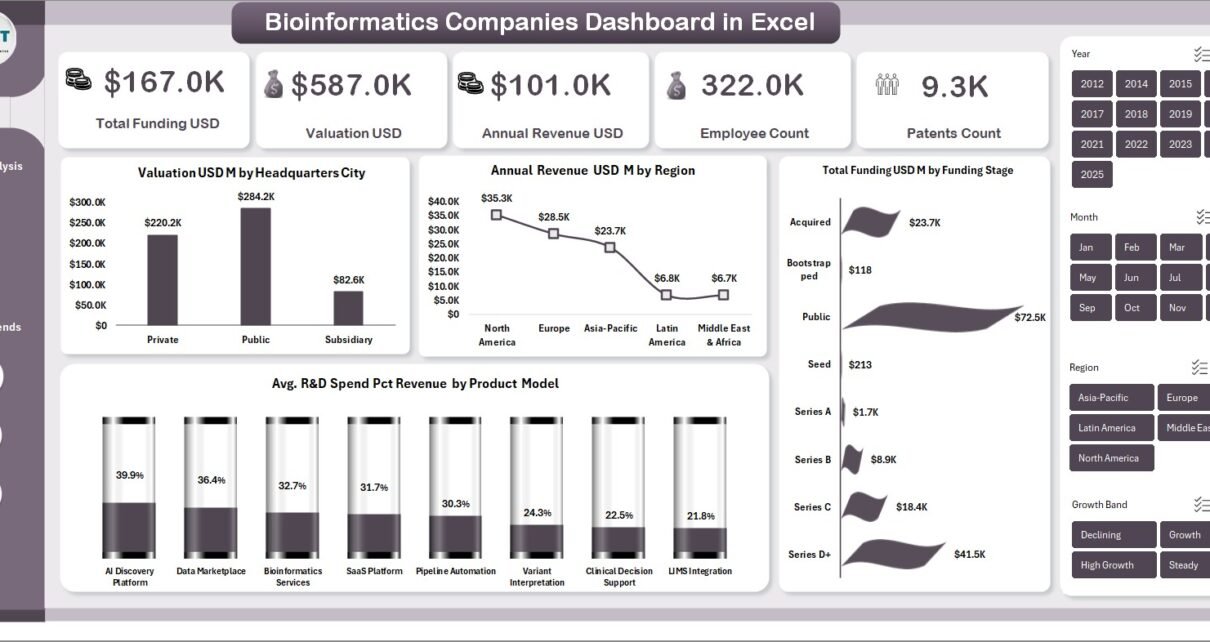
In today’s fast-growing biotech and life sciences industry, companies generate massive volumes of data every day. However, many professionals still struggle to convert that data into meaningful insights. As a
PKComments Off on Business Valuation Dashboard in Power BI
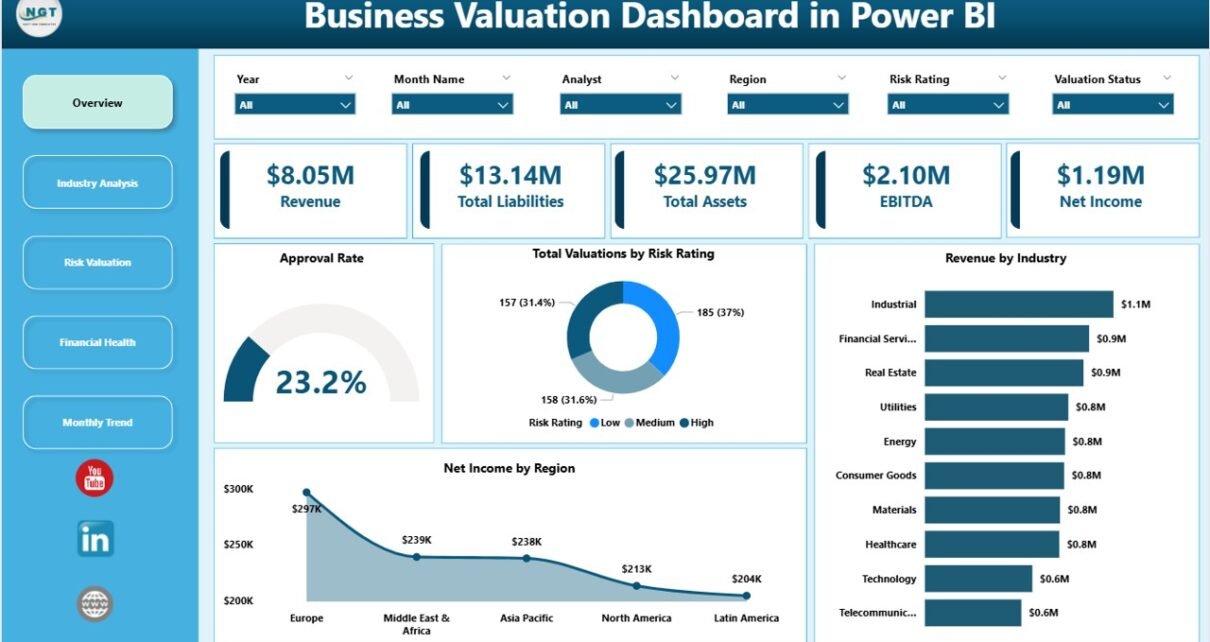
In today’s competitive business world, understanding the true value of a company plays a critical role in making smart decisions. Whether you plan mergers, acquisitions, investments, or business expansion, you
PKComments Off on Business Valuation Dashboard in Excel
In today’s competitive business environment, understanding the true value of a company plays a critical role in decision-making. Whether you plan mergers, acquisitions, investments, or strategic growth, you must rely
PKComments Off on Chamber of Commerce KPI Dashboard in Excel
Introduction The Chamber of Commerce KPI Dashboard is an essential tool designed to help outsourced accounting teams and chamber management track, analyze, and improve key performance indicators efficiently. This ready-to-use
PKComments Off on Business Valuation KPI Dashboard in Power BI
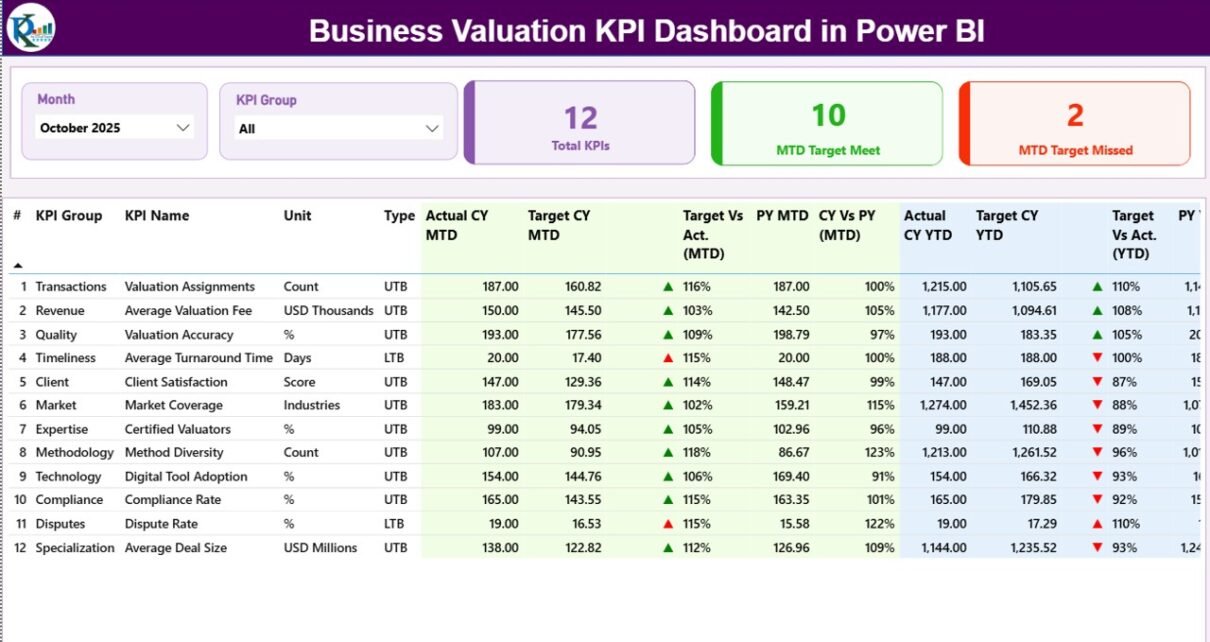
In today’s competitive business environment, organizations must monitor financial performance, valuation metrics, and strategic indicators regularly. Business valuation professionals, financial analysts, investors, and consulting firms depend on accurate performance tracking
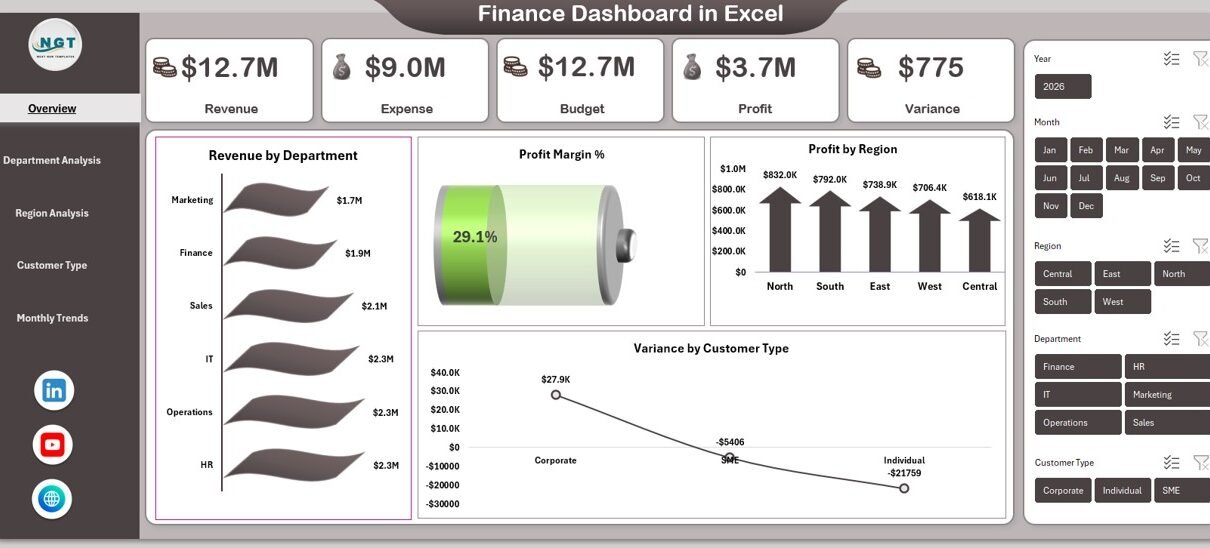
Financial management plays a critical role in every organization, regardless of size or industry. Companies constantly track revenue, expenses, budgets, and profits to ensure sustainable growth. However, many businesses still
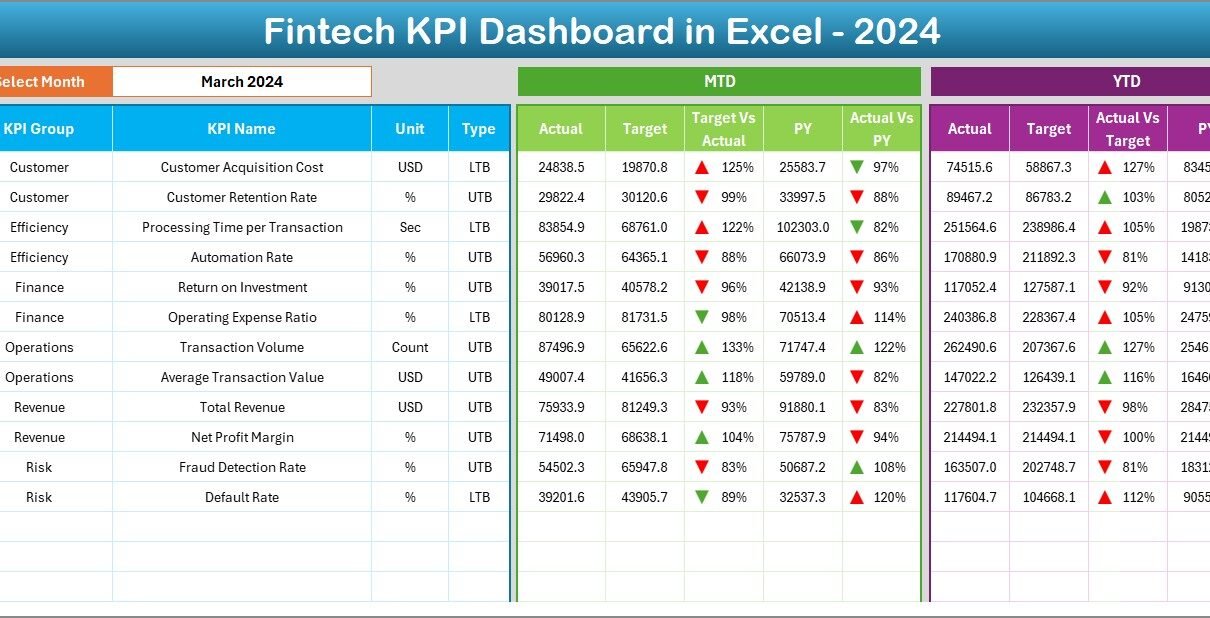
In today’s rapidly evolving financial technology (Fintech) landscape, data plays a critical role in driving business growth and operational excellence. Every transaction, customer interaction, and investment decision generates valuable information.