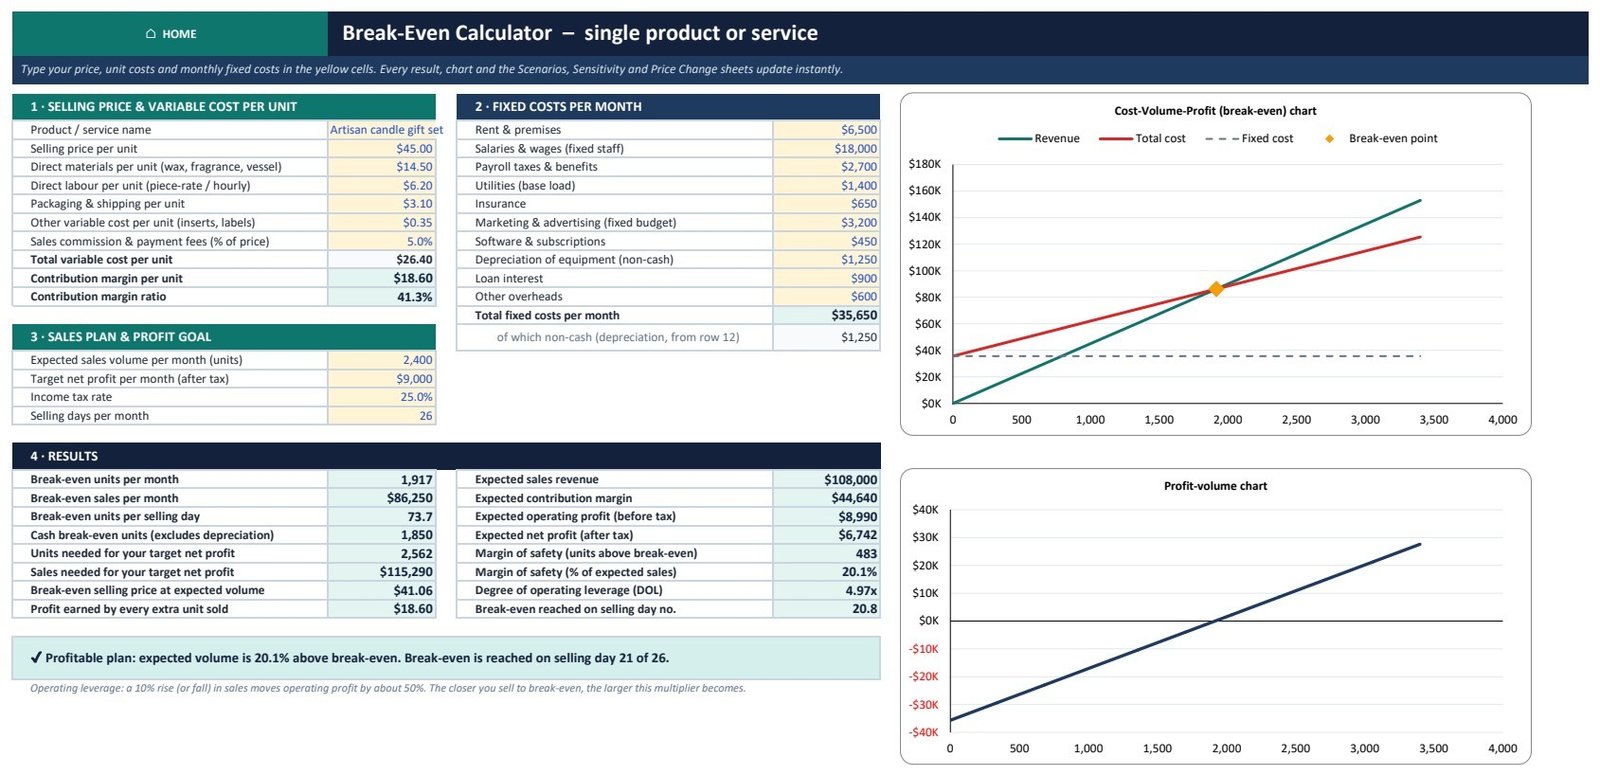
Every business has a point where revenue exactly covers costs. Below it, every day of trading loses money. The Break-Even Analysis Pack in Excel finds that point for a single product, a 12-product range or a whole business unit, then shows how it moves when price, cost or volume change. In the worked example, a $45 product with $26.40 of variable cost and $35,650 of monthly fixed costs breaks even at 1,917 units, or $86,250 of sales. The planned 2,400 units leave a 20.1% margin of safety and an operating leverage of 4.97x. This post walks through the pack sheet by sheet and explains what each number means for your decisions.

Key Features of the Break-Even Analysis Pack in Excel
- 17 linked sheets. Every result is a live formula, with no macros and no add-ins.
- Break-even calculator. Contribution margin, break-even units and sales, units per selling day, cash break-even, target-profit volume, break-even price, margin of safety and degree of operating leverage.
- Cost-volume-profit chart with the break-even point marked, plus a profit-volume chart.
- Cost classifier. Tag each cost as fixed, variable or semi-variable, and split mixed costs with the high-low method or regression.
- Multi-product break-even analysis for up to 12 products, with a what-if sales mix.
- Scenarios, sensitivity and price change sheets for stress-testing the plan.
- Investment payback for a new site or machine: cash versus accounting break-even, and simple versus discounted payback.
- Four case studies: a café, a digital agency, a manufacturer with step fixed costs and an enterprise SaaS product line.
- Sample and Blank editions, a 16-slide editable PowerPoint deck and a 9-page PDF guide.
Workbook Sheets Explained
Home and Dashboard
The Home sheet links to all 17 sheets, and every sheet has a HOME button. The Dashboard puts six KPI cards on one page: break-even units, break-even sales, expected operating profit, margin of safety, operating leverage and contribution margin. It adds a verdict sentence written by formula, a table comparing the four case studies, and four charts. It is set up to print landscape on one page.
BE Calculator
This is the break-even calculator for a single product or service. Yellow cells hold your price, five unit-cost lines (one of them a commission as a percentage of price), ten fixed-cost lines, expected volume, target net profit, tax rate and selling days. The results include the selling day of the month on which you break even, and the price at which your planned volume would exactly break even.
Cost Classifier
Most break-even mistakes start with a cost filed in the wrong bucket. List up to 20 costs, tag each one, and give each semi-variable cost its fixed share. Section 4 splits a mixed cost from 12 months of bills. In the sample, regression shows the electricity bill is $1,281 fixed plus $0.365 per unit, with an R² of 0.97.
Sales Mix
Break-even revenue depends on the weighted contribution margin ratio, not only on prices. In the outdoor-gear sample, break-even revenue is $142,283 a month. A promotion-driven shift toward lower-margin products raises it to $145,505, so the store needs $3,222 more revenue every month just to stand still.
Scenarios, Sensitivity and Price Change
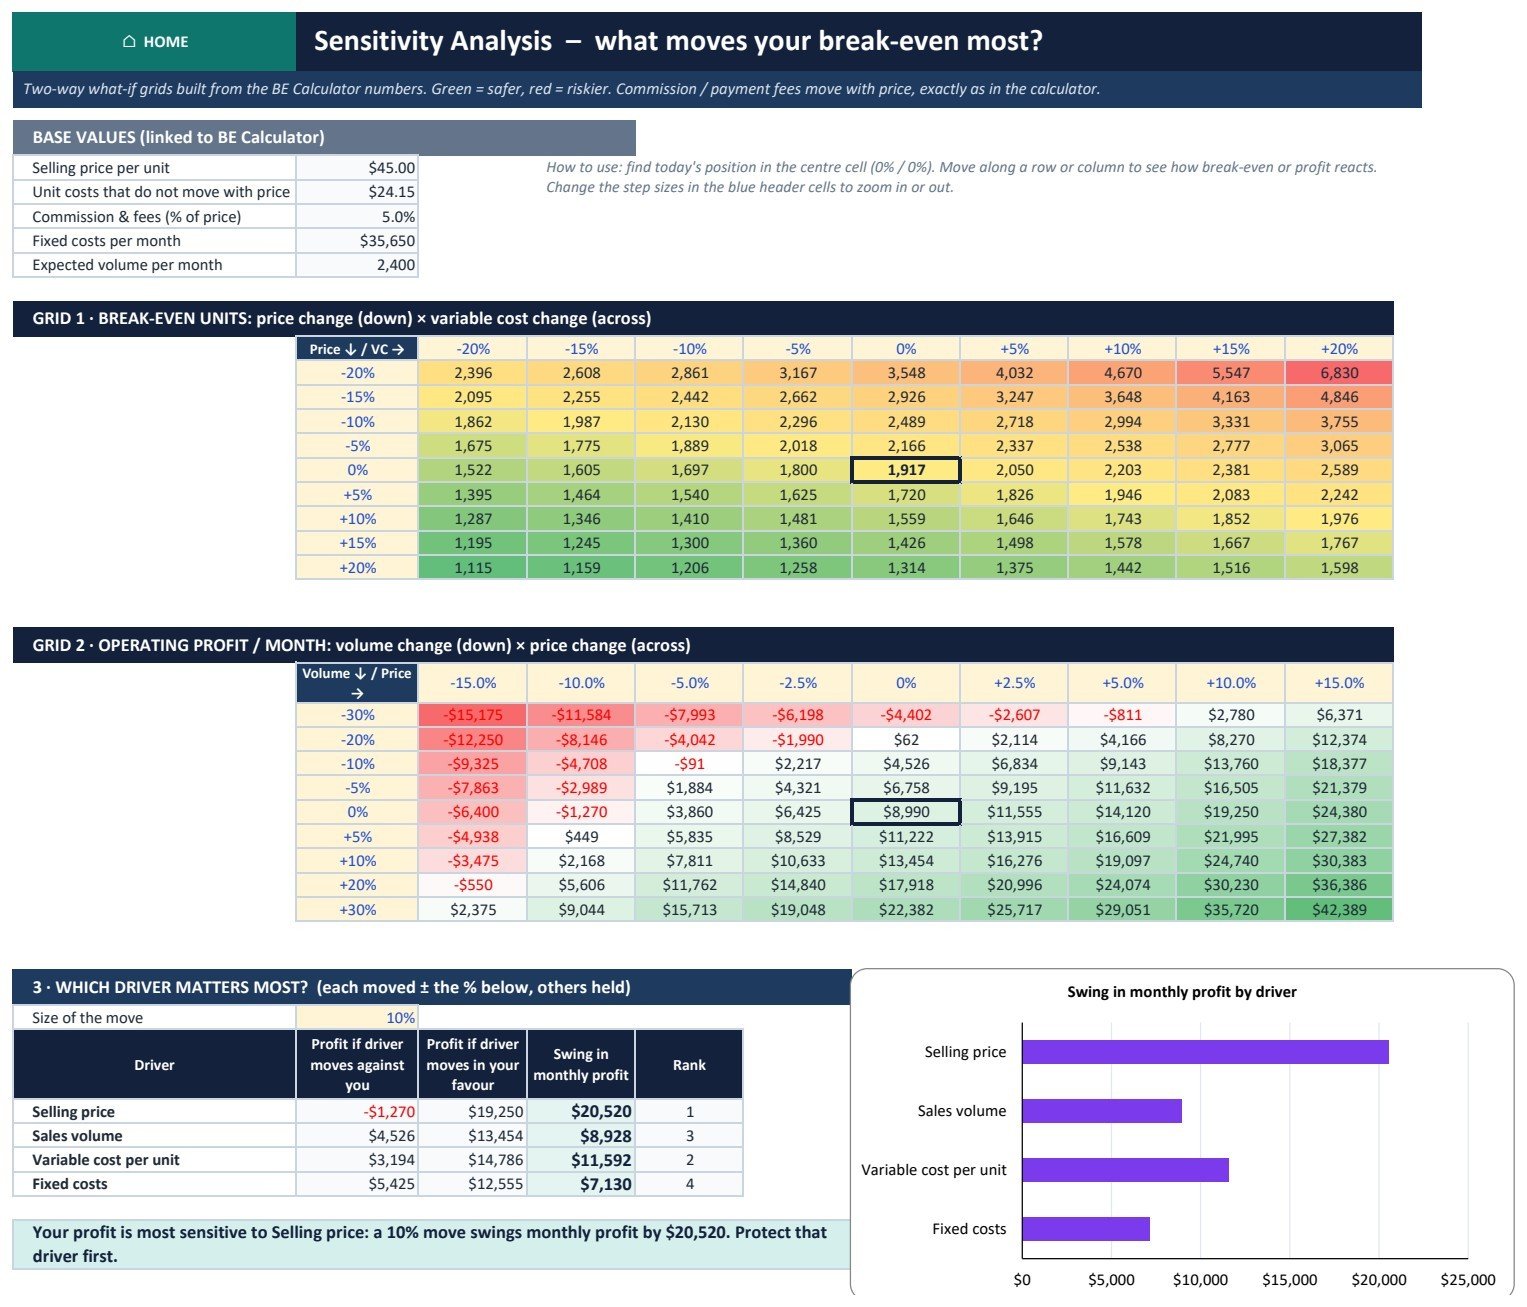
Scenarios compares worst, base and best cases side by side. In the sample, profit swings from a loss of $7,874 to a profit of $21,604 a month. Sensitivity holds two heat-map grids and ranks the four drivers; price is the most sensitive, since a 10% move swings profit by $20,520 a month. Price Change shows that a 10% discount needs about 30% more volume just to keep today’s profit.
Investment Payback and Monthly Tracker
The payback sheet models a second café costing $187,500. It needs $60,156 of revenue a month to cover its cash costs, or $63,207 once depreciation is counted. It pays back in month 23, or month 25 after the cost of capital. The Monthly Tracker recalculates break-even for each month, so seasonal loss months stand out.
Break-Even Analysis Pack in Excel vs. Google Sheets Template vs. Paid Planning Software – Feature Comparison
| Feature | This Excel pack | Free Google Sheets template | Paid business-planning SaaS |
|---|---|---|---|
| Cost | One-time purchase | Free | Monthly subscription |
| Setup time | About 5 minutes | About 5 minutes | Account setup |
| Multi-product sales mix | Yes, 12 products | Rarely | Varies |
| Semi-variable cost split | High-low and regression | No | Rarely |
| Cash vs accounting break-even | Yes | Rarely | Varies |
| Case studies and presentation deck | 4 cases plus a 16-slide deck | No | No |
| Fully editable formulas | Yes, nothing locked | Usually | No |
Who Should Use This Template
Small-business owners pricing a product or planning a new site. FP&A analysts preparing a cost-volume-profit analysis for a board or bank. Consultants and agencies checking utilisation. Manufacturers deciding whether to add a shift. Teachers and students of managerial accounting. It is not a three-statement financial model, and it does not connect to accounting software.
Real-World Use Cases
- Café: Brewline needs 254 customers a day, or 20 an hour, to break even. It serves 287, so the first 11.5 of its 13 opening hours pay the bills.
- Digital agency: Brightline breaks even at 637 billable hours a month, which is 52% utilisation. The blended rate could fall from $149 to $121 before the agency makes a loss.
- Manufacturer: Northfield should only add a second shift above 6,977 units a month. A robotic cell adds $18,300 a month above 3,625 units.
- Enterprise SaaS: Vantora needs 653 paying accounts to break even. It is profitable after acquisition cost from month 24, and needs $7.3M of funding first.
Advantages of the Break-Even Analysis Pack
- It covers the questions a single-sheet break-even calculator leaves out: sales mix, mixed costs, step fixed costs and payback.
- Formula-written insight sentences explain each result in plain English.
- A margin of safety calculator and an operating leverage figure show how fragile the plan is.
- The PowerPoint deck and the Dashboard are ready for a lender or a board.
Opportunities for Improvement
- Inputs are typed or pasted. There is no live link to QuickBooks, Xero or an ERP.
- Break-even models assume constant unit prices and costs within a capacity band. Case 3 shows how to handle step fixed costs; tiered pricing needs your own adjustment.
- It is tested in Microsoft Excel. The charts have not been tested in Google Sheets.
Best Practices
- Classify costs before trusting any break-even figure. Use regression when you have 12 months of bills.
- Review the margin of safety every month, not just once a year.
- Test price changes on the Price Change sheet before announcing a discount.
- For a new site or machine, look at cash break-even, not only accounting break-even.
- To learn the Excel functions behind the regression split, see Microsoft’s guide to the SLOPE function.
Explore Relevant Templates
- Break-Even Analysis Template in Excel: our simpler single-sheet version.
- Profit and Loss (P&L) Template in Excel
- Manufacturing Business Plan Templates Kit
- Data Analysts Chart Visualization Pack
- CFO’s Financial Command Toolkit and Cash Flow Template in Excel on NextGenTemplates
Frequently Asked Questions
How do you calculate break-even units in Excel?
Divide total fixed costs by the contribution margin per unit, which is price minus variable cost per unit, then round up. The BE Calculator does this with =ROUNDUP(F15/C13,0).
Can it handle several products?
Yes. The Sales Mix sheet runs a multi-product break-even analysis for up to 12 products using the weighted contribution margin.
What is margin of safety?
Margin of safety is how far sales can fall before you make a loss. It is calculated as (expected sales – break-even sales) / expected sales.
Does it need macros?
No. It uses worksheet formulas only and works in Excel 2010 and later on Windows and Mac.
Is there a blank version?
Yes. The Blank edition clears the core tools and keeps the four case studies as worked examples.
About the Author
Built by PK – Microsoft Certified Professional with 15+ years of Excel, Google Sheets, and Power BI experience. Founder of NextGenTemplates, reaching 300K+ subscribers across YouTube channels. Every template is hand-built and tested before release.
Conclusion
Knowing your break-even point turns pricing, hiring and investment decisions into arithmetic rather than guesswork. The Break-Even Analysis Pack in Excel gives you the calculator, the stress tests, four worked industries and a presentation deck in one download.
Get the Break-Even Analysis Pack in Excel. For video tutorials, visit youtube.com/@PKAnExcelExpert.