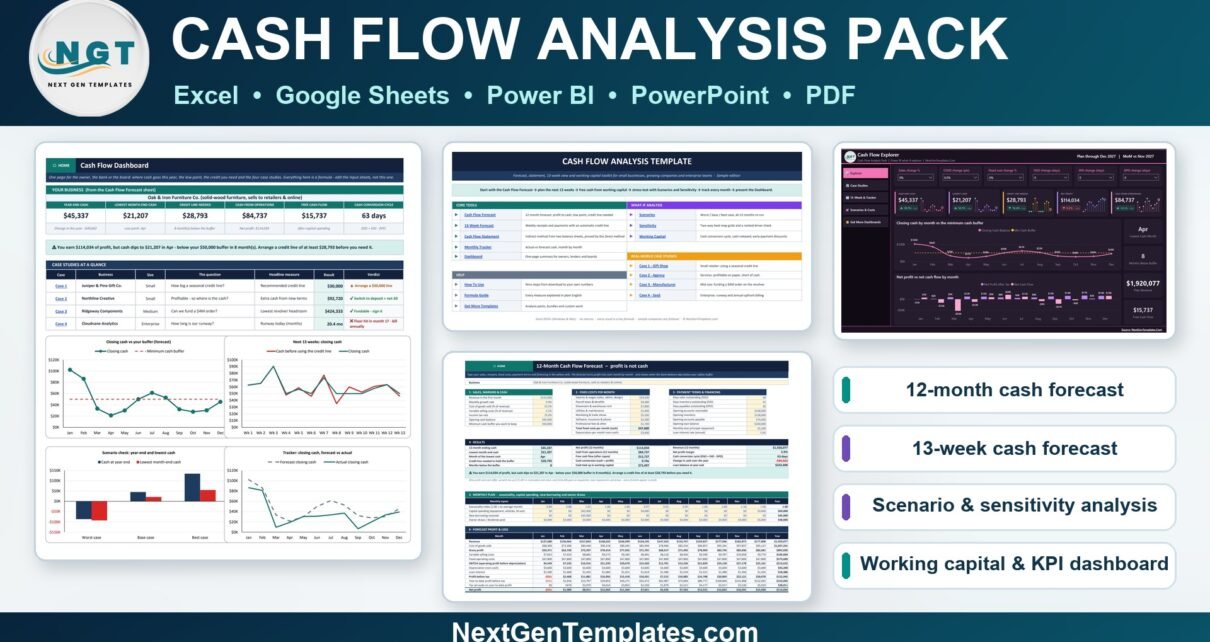
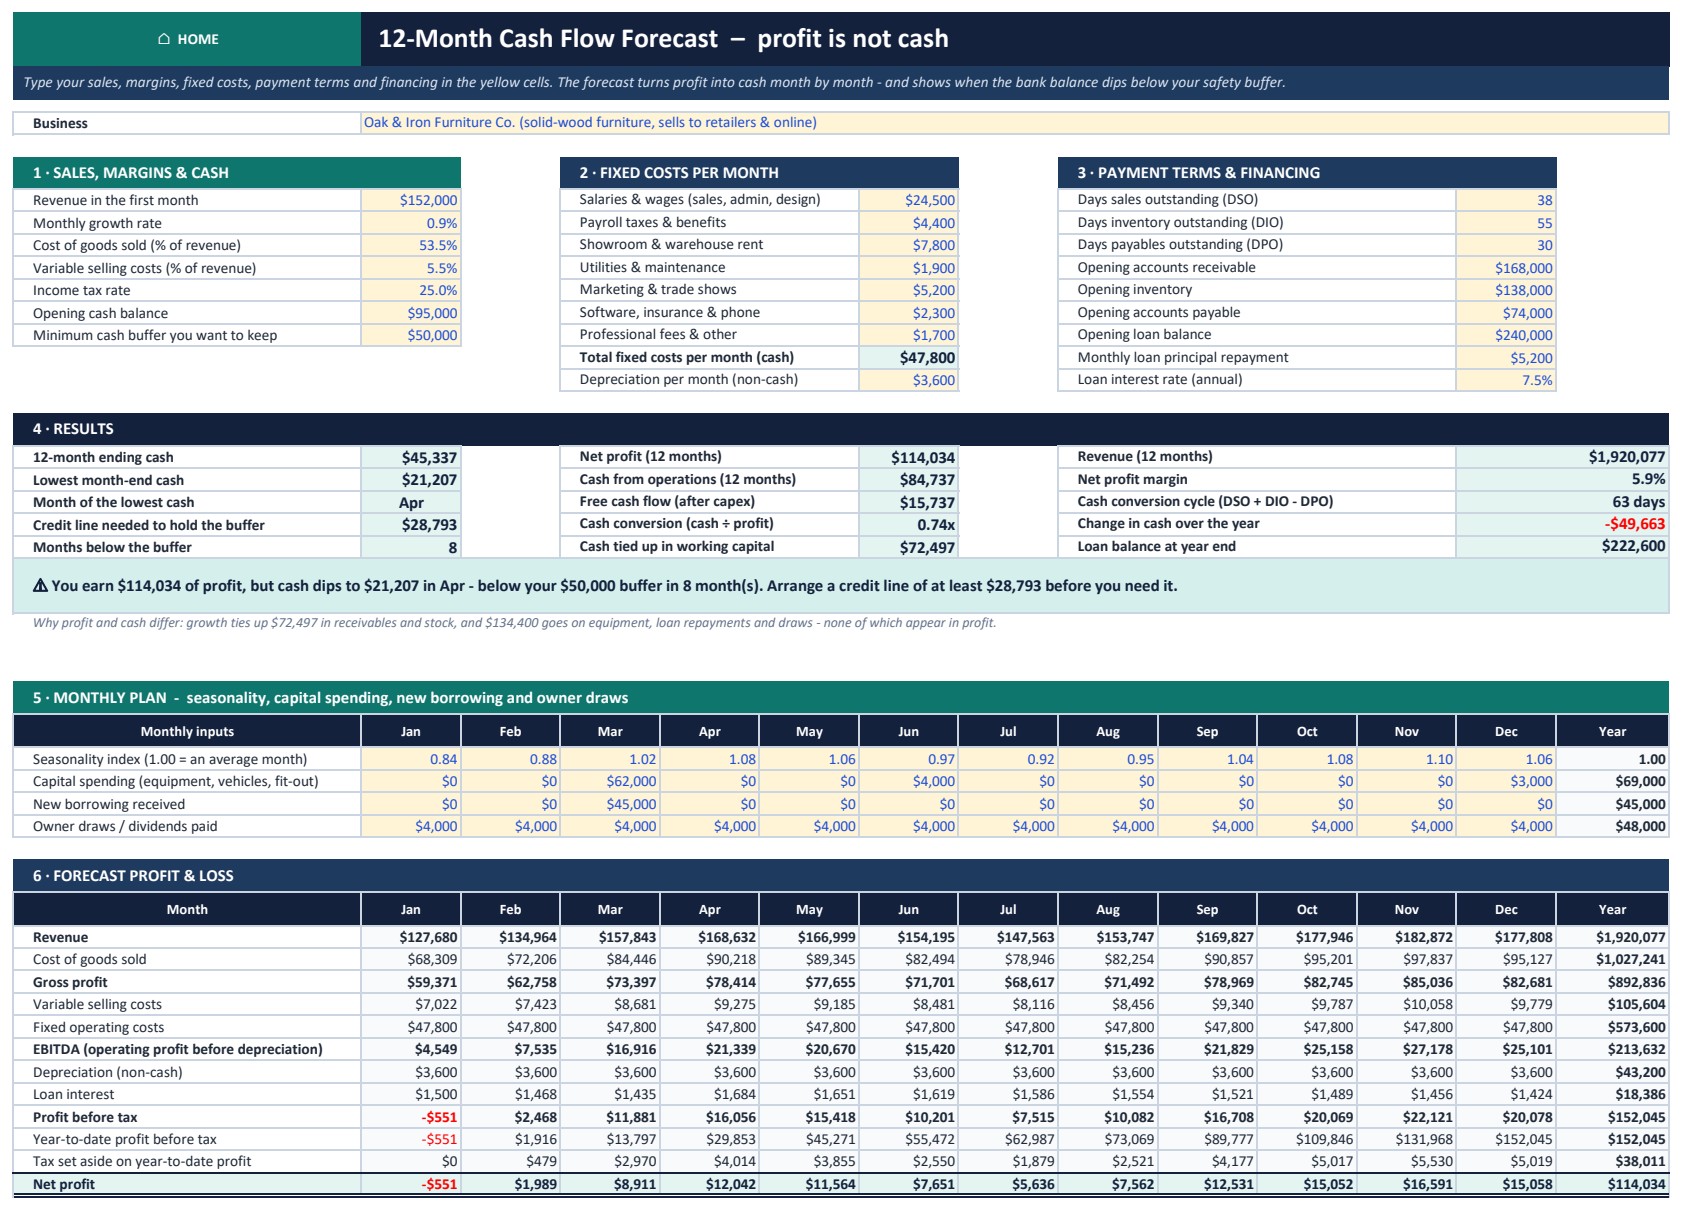
A business can show a healthy profit and still run out of cash. The Cash Flow Analysis Pack shows where the money goes and when the bank balance will dip, in Excel, Google Sheets and Power BI. In the worked example, Oak & Iron Furniture Co. earns $114,034 of net profit on $1,920,077 of revenue, but operations generate only $84,737 of cash (0.74x) because growth ties money up in receivables and stock. Cash ends the year at $45,337, dips to $21,207 in April and spends 8 months below the $50,000 buffer, so a $28,793 credit line is needed. This post walks through the pack sheet by sheet and explains what each number means for your decisions.
Watch the Cash Flow Analysis Pack walkthrough
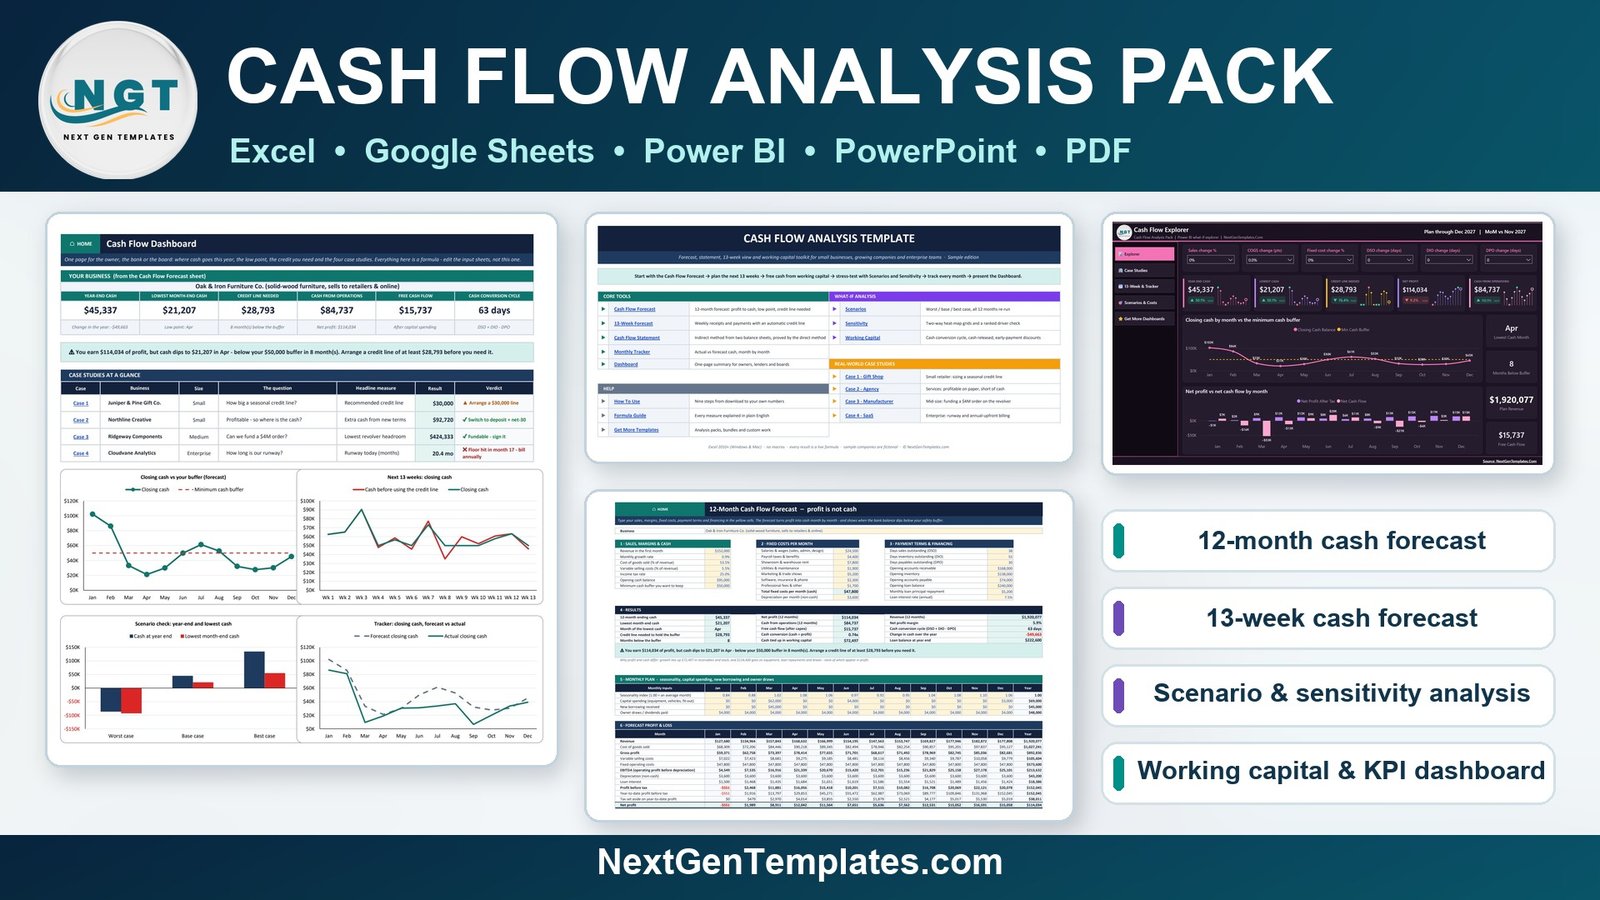
Key Features of the Cash Flow Analysis Pack
- 16 linked sheets. Every result is a live formula, with no macros and no add-ins.
- 12-month cash flow forecast that turns profit into cash month by month and reports the low point and the credit line you need.
- 13-week cash forecast with an automatic credit line, the view banks ask for.
- Cash flow statement built from two balance sheets by the indirect method, proved by the direct method, with 6 checks.
- Working capital analysis: cash conversion cycle and the cash each lever releases.
- Scenarios and sensitivity that re-run all 12 months.
- Four case studies: a gift shop, a creative agency, a manufacturer and an enterprise SaaS company.
- Google Sheets copy, Power BI explorer, a Sample and Blank Excel edition, a 16-slide PowerPoint deck and a 10-page PDF guide.
Workbook Sheets Explained
Home and Dashboard
The Home sheet links to every sheet, and each sheet has a HOME button. The Dashboard puts six KPI cards on one page: year-end cash, lowest month-end cash, credit line needed, cash from operations, free cash flow and cash conversion cycle. It adds a verdict sentence written by formula, the four case studies at a glance and four charts.
Cash Flow Forecast
This is the 12-month cash flow forecast. Yellow cells hold sales, growth, seasonality, margins, fixed costs, payment days, opening balances, loans, capital spending and owner draws. It builds the profit and loss, tracks receivables, stock, payables and the loan, and reports the low point, the credit line and the cash conversion. Tax is set aside on year-to-date profit, so a loss month releases part of it.
13-Week Forecast and Cash Flow Statement
The 13-week forecast lists receipts and payments week by week and draws on the credit line only when cash would fall below your minimum. The Cash Flow Statement sheet takes last year’s income statement and both balance sheets, builds the statement of cash flows by the indirect method, proves operating cash by the direct method, and calculates seven cash ratios with six checks.
Scenarios, Sensitivity and Working Capital
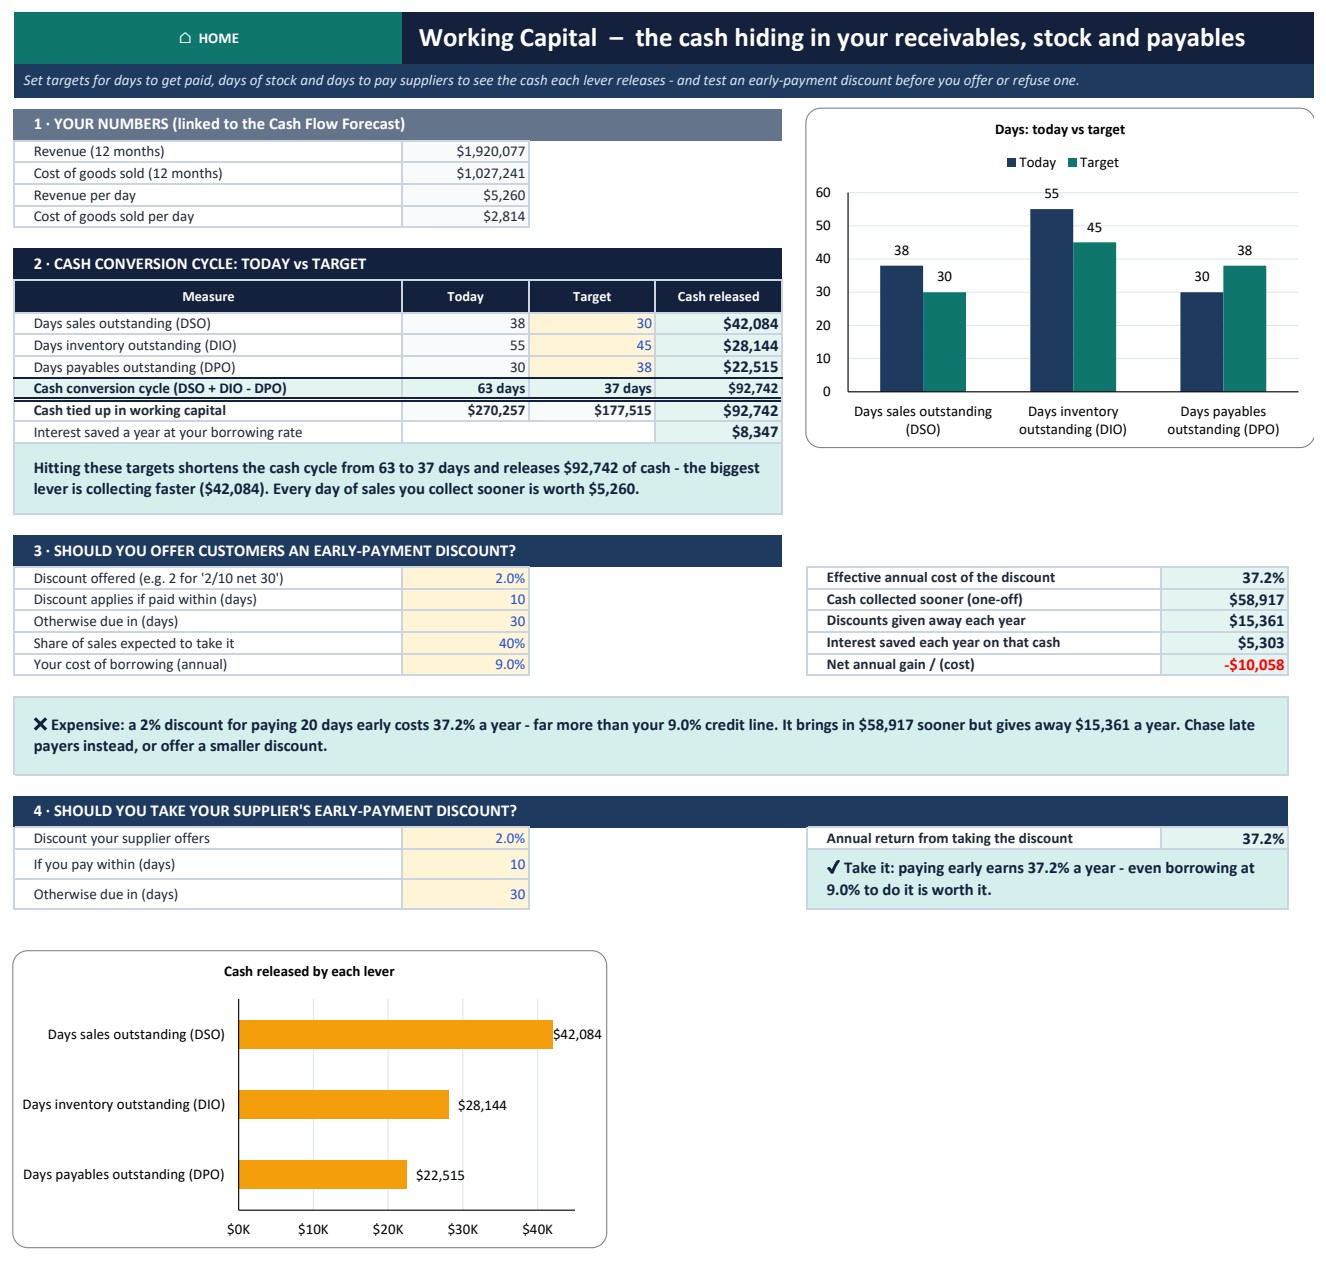
Scenarios compares worst, base and best cases, and each one re-runs all 12 months, so it reports the lowest month and the credit needed, not just the year end. Sensitivity holds two grids, year-end cash by sales change and days-to-get-paid change, and by sales change and gross-margin change, and ranks six drivers. Working Capital shows that cutting collection, stock and payment days from 63 to 37 releases $92,742, and that a 2/10 net 30 early-payment discount costs 37.2% a year.
Monthly Tracker
Type each month’s actual cash in and out. The tracker shows the variance, actual versus forecast closing cash, and how accurate the forecast has been, so a slipping plan shows up months before the bank balance does.
Cash Flow Analysis Pack vs. Free Cash Flow Template vs. Paid Forecasting Software – Feature Comparison
| Feature | This pack | Free cash flow template | Paid forecasting SaaS |
|---|---|---|---|
| Cost | One-time purchase | Free | Monthly subscription |
| Platforms | Excel, Google Sheets, Power BI | Usually one | Web app |
| 12-month and 13-week forecasts | Both | Usually one | Yes |
| Cash flow statement from two balance sheets | Yes, with 6 checks | Rarely | Varies |
| Working capital and discount test | Yes | Rarely | Varies |
| Case studies and presentation deck | 4 cases plus a 16-slide deck | No | No |
| Fully editable formulas | Yes, nothing locked | Usually | No |
Who Should Use This Template
Small-business owners who are profitable but short of cash. Finance managers and FP&A analysts preparing a cash forecast for a bank or board. Agencies and consultants working on collection time. Manufacturers funding a large order. Startup founders tracking runway. Students of finance. It is not a three-statement financial model, and it does not connect to accounting software.
Real-World Use Cases
- Gift shop: Juniper & Pine earns $40,438 a year, but without credit its cash would fall to -$9,302 in November. The line is drawn in 7 months and peaks at $24,621, so a $30,000 line is recommended.
- Creative agency: Northline Creative books $180,325 of profit, but clients take about 55 days to pay. A 30% deposit with net-30 terms brings in $92,720 more cash and cuts collection time to about 27 days.
- Manufacturer: Ridgeway Components can fund a $4M OEM order on 75-day terms. The peak revolver draw rises to $825,667 against a $1,250,000 limit, which leaves at least $424,333 of headroom.
- Enterprise SaaS: Cloudvane Analytics burns $459,893 a month in year 1 and breaks its $3.0M cash floor in month 17, a runway of 20.4 months. Annual upfront billing for 70% of new MRR avoids that.
Advantages of the Cash Flow Analysis Pack
- It shows the low-cash month and the credit line size before the gap arrives.
- Formula-written insight sentences explain each result in plain English.
- The 13-week view and the cash flow statement are the two views lenders usually ask for.
- The PowerPoint deck and the Dashboard are ready for a lender or a board.
Opportunities for Improvement
- Inputs are typed or pasted. There is no live link to QuickBooks, Xero or an ERP.
- The monthly model treats a month as 30 days and sets tax aside as profit is earned, so use the 13-week forecast with your real receipts and payments when you know them.
- The Power BI file is an explorer for what-if analysis, not a data-entry calculator.
Best Practices
- Set a realistic minimum cash buffer first. Every month below it is flagged.
- Arrange a credit line before the low point, since banks lend more readily when the forecast shows the gap months ahead.
- Compare cash conversion with 1.0x. Well below it means profit is getting stuck in receivables and stock.
- Update the Monthly Tracker every month and review forecast accuracy.
Explore Relevant Templates
- Break-Even Analysis Pack in Excel: the sister analysis pack.
- Cash Flow Template in Excel: our simpler single-purpose version.
- Profit and Loss (P&L) Template in Excel
- CFO’s Financial Command Toolkit
Frequently Asked Questions
Why is cash lower than profit?
Growth ties cash up in receivables and stock, and loan repayments, equipment and owner draws leave the bank without touching profit.
What is the credit line needed?
It is the larger of zero and your minimum cash buffer minus the lowest closing cash in the forecast.
What is the cash conversion cycle?
It is days sales outstanding plus days inventory outstanding minus days payables outstanding. Every day you cut releases a day of sales or cost of sales in cash.
Does it need macros?
No. It uses worksheet formulas only and works in Excel 2010 and later on Windows and Mac.
Is there a blank version?
Yes. The Blank edition clears the core tools and keeps the four case studies as worked examples.
About the Author
Built by PK – Microsoft Certified Professional with 15+ years of Excel, Google Sheets, and Power BI experience. Founder of NextGenTemplates, reaching 300K+ subscribers across YouTube channels. Every template is hand-built and tested before release.
Conclusion
Knowing your lowest cash month turns borrowing, pricing and payment-terms decisions into arithmetic rather than guesswork. The Cash Flow Analysis Pack gives you the forecasts, the cash flow statement, the stress tests, four worked industries and a presentation deck in one download.
Get the Cash Flow Analysis Pack. For video tutorials, visit youtube.com/@PKAnExcelExpert.