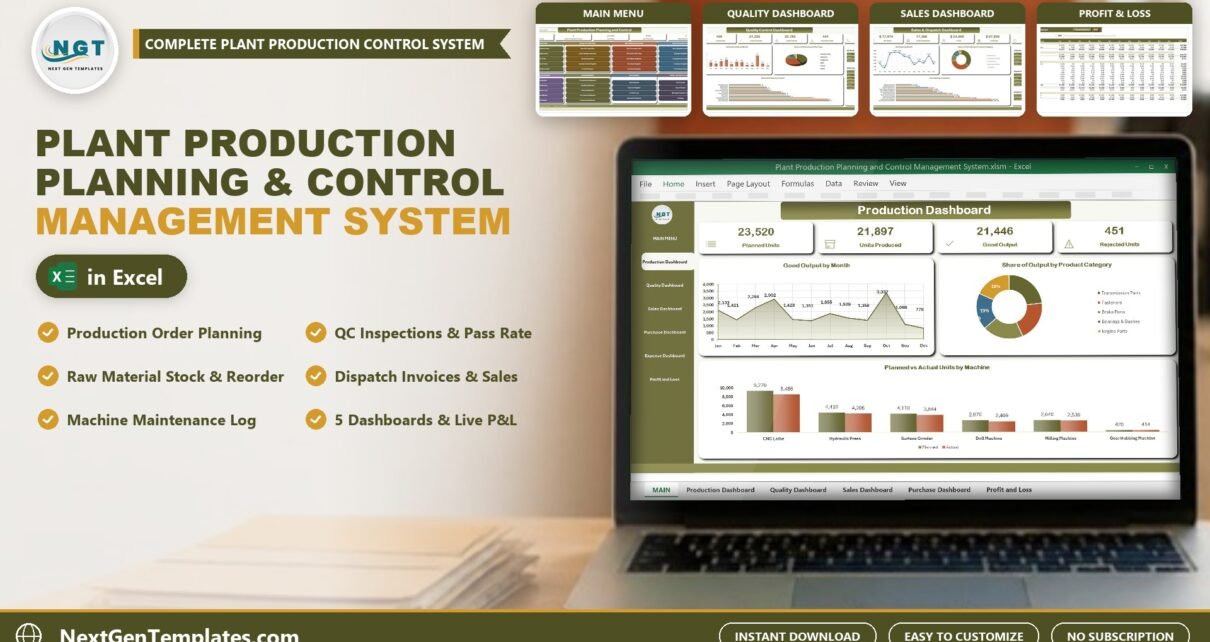
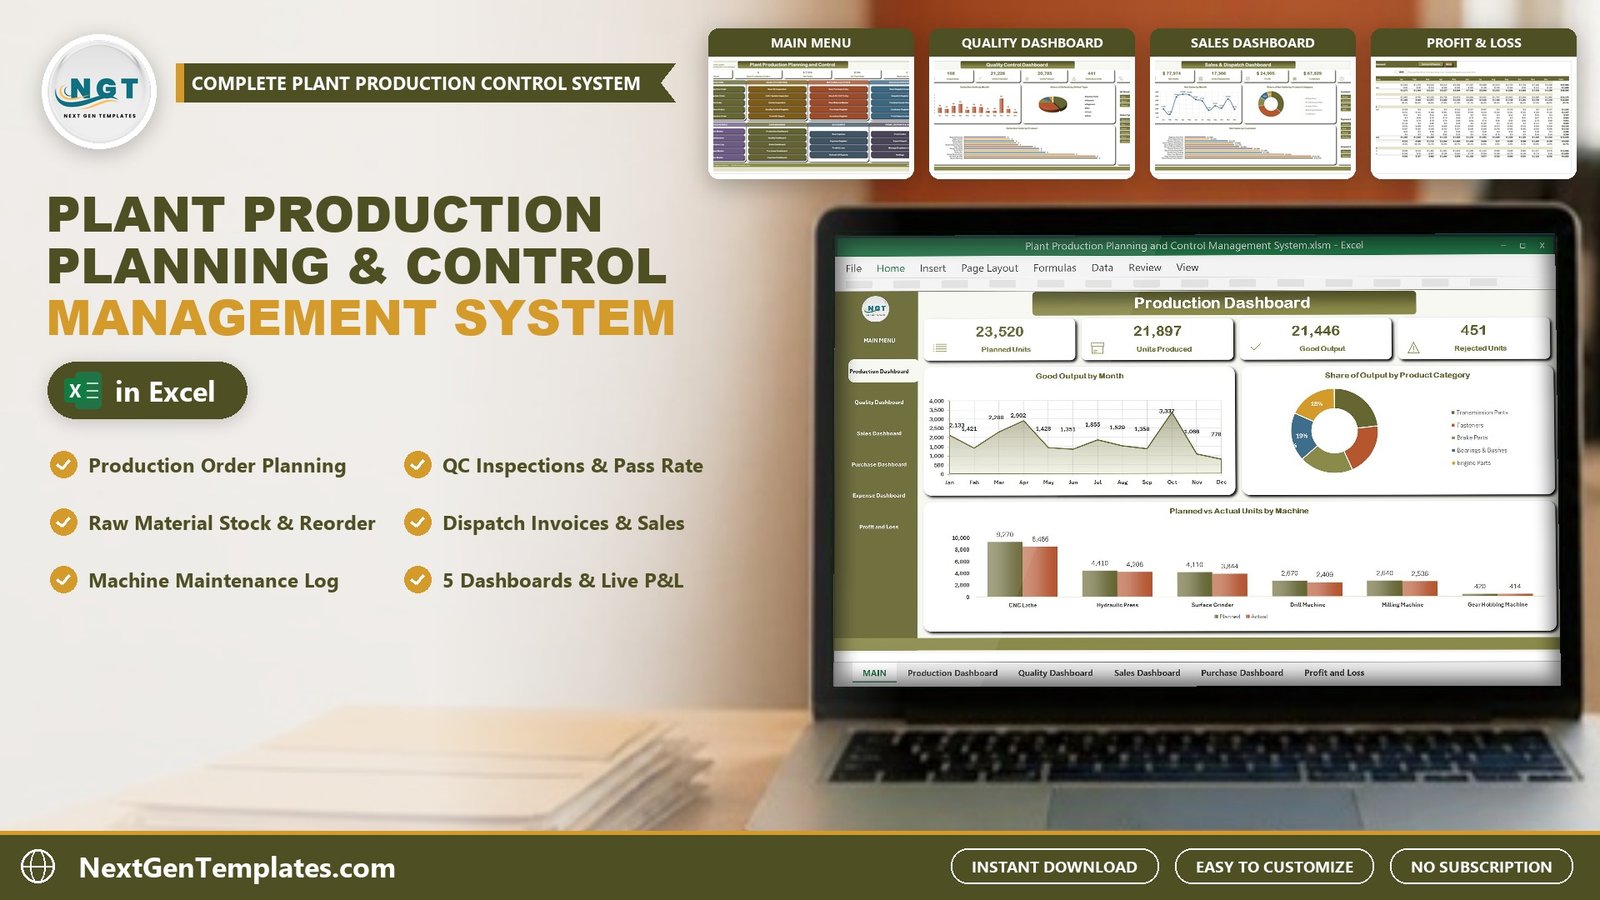
The Plant Production Planning and Control Management System is a macro-enabled Excel workbook that runs a manufacturing plant from one file: 22 worksheets, 13 VBA entry forms, 5 pivot dashboards, a live Profit & Loss statement and 5 printable documents that come out at A4, 4 inch and 3 inch. It ships with 120 sample production orders, 108 quality inspections, 110 dispatch invoice lines and 90 stock movements, so every chart is populated the first time you open it.
Most small plants do not need an ERP subscription – they need the production orders, the quality checks, the stock and the invoices in one place they already understand. A plain production planning Excel sheet gets you the first of those and then stops: rejects are not measured, stock does not move when material is issued, nothing prints for the shop floor and the machine that is overdue for service is on a sticky note. This workbook closes that gap while keeping every record on your own PC.
🎥 Watch the Demo Video
Video Overview
In this 10-minute demo PK walks through the whole system with one production order from start to finish: planning the order on the Machine and Schedule and Quantities tabs, opening the Production Orders register where achievement, scrap and capacity utilisation are already worked out, inspecting the batch with a QC entry, and checking the raw material stock, Stock IN / OUT slips and purchases. The goods are then dispatched on a tax invoice and the finished goods stock follows. You also see the Machine Master, the five dashboards, the twelve-month Profit & Loss, the Print Centre (A4, 4 inch and 3 inch), Export Report, Manage Dropdown Lists and Settings.
🎁 Try it free for 7 days before you buy – every form, dashboard and report works in the free trial, so you can test it on your own PC first.
Key Features of the Plant Production Planning and Control Management System
- Self-measuring production orders. Planned, actual and rejected quantities turn into good quantity, achievement %, scrap %, production days, capacity utilisation %, production cost and output value by formula.
- Quality control by batch. Each inspection is tied to a production order; the product and batch are looked up, and passed quantity, pass % and the result (Pass, Rework or Reject) follow from what you enter.
- Automatic stock. Purchases and Stock IN / OUT slips move raw material stock; production and dispatch move finished goods. Every item shows stock in hand, stock value and In Stock, Low Stock or Out of Stock.
- Dispatch invoices with profit. Discount, tax, net amount, cost, gross profit, amount paid and balance due on every line, with customer outstanding rolled up automatically.
- Machine service tracking. Last service comes from the maintenance log, and each machine is flagged OK, Due Soon or Overdue with downtime hours alongside.
- Five dashboards and a live P&L. Production, quality, sales and dispatch, purchases and expenses, each with its own slicers, plus a twelve-month Profit & Loss with a tax memo.
- Printing in three sizes. Production Order, QC Inspection Report, Purchase Order, Tax Invoice and Material Issue / Receipt Slip at A4, 4 inch and 3 inch.
- Checked entry forms. Required fields, number checks, type-to-search lists and locked date boxes with a calendar picker.
Dashboard Pages and Sheets Explained
MAIN menu
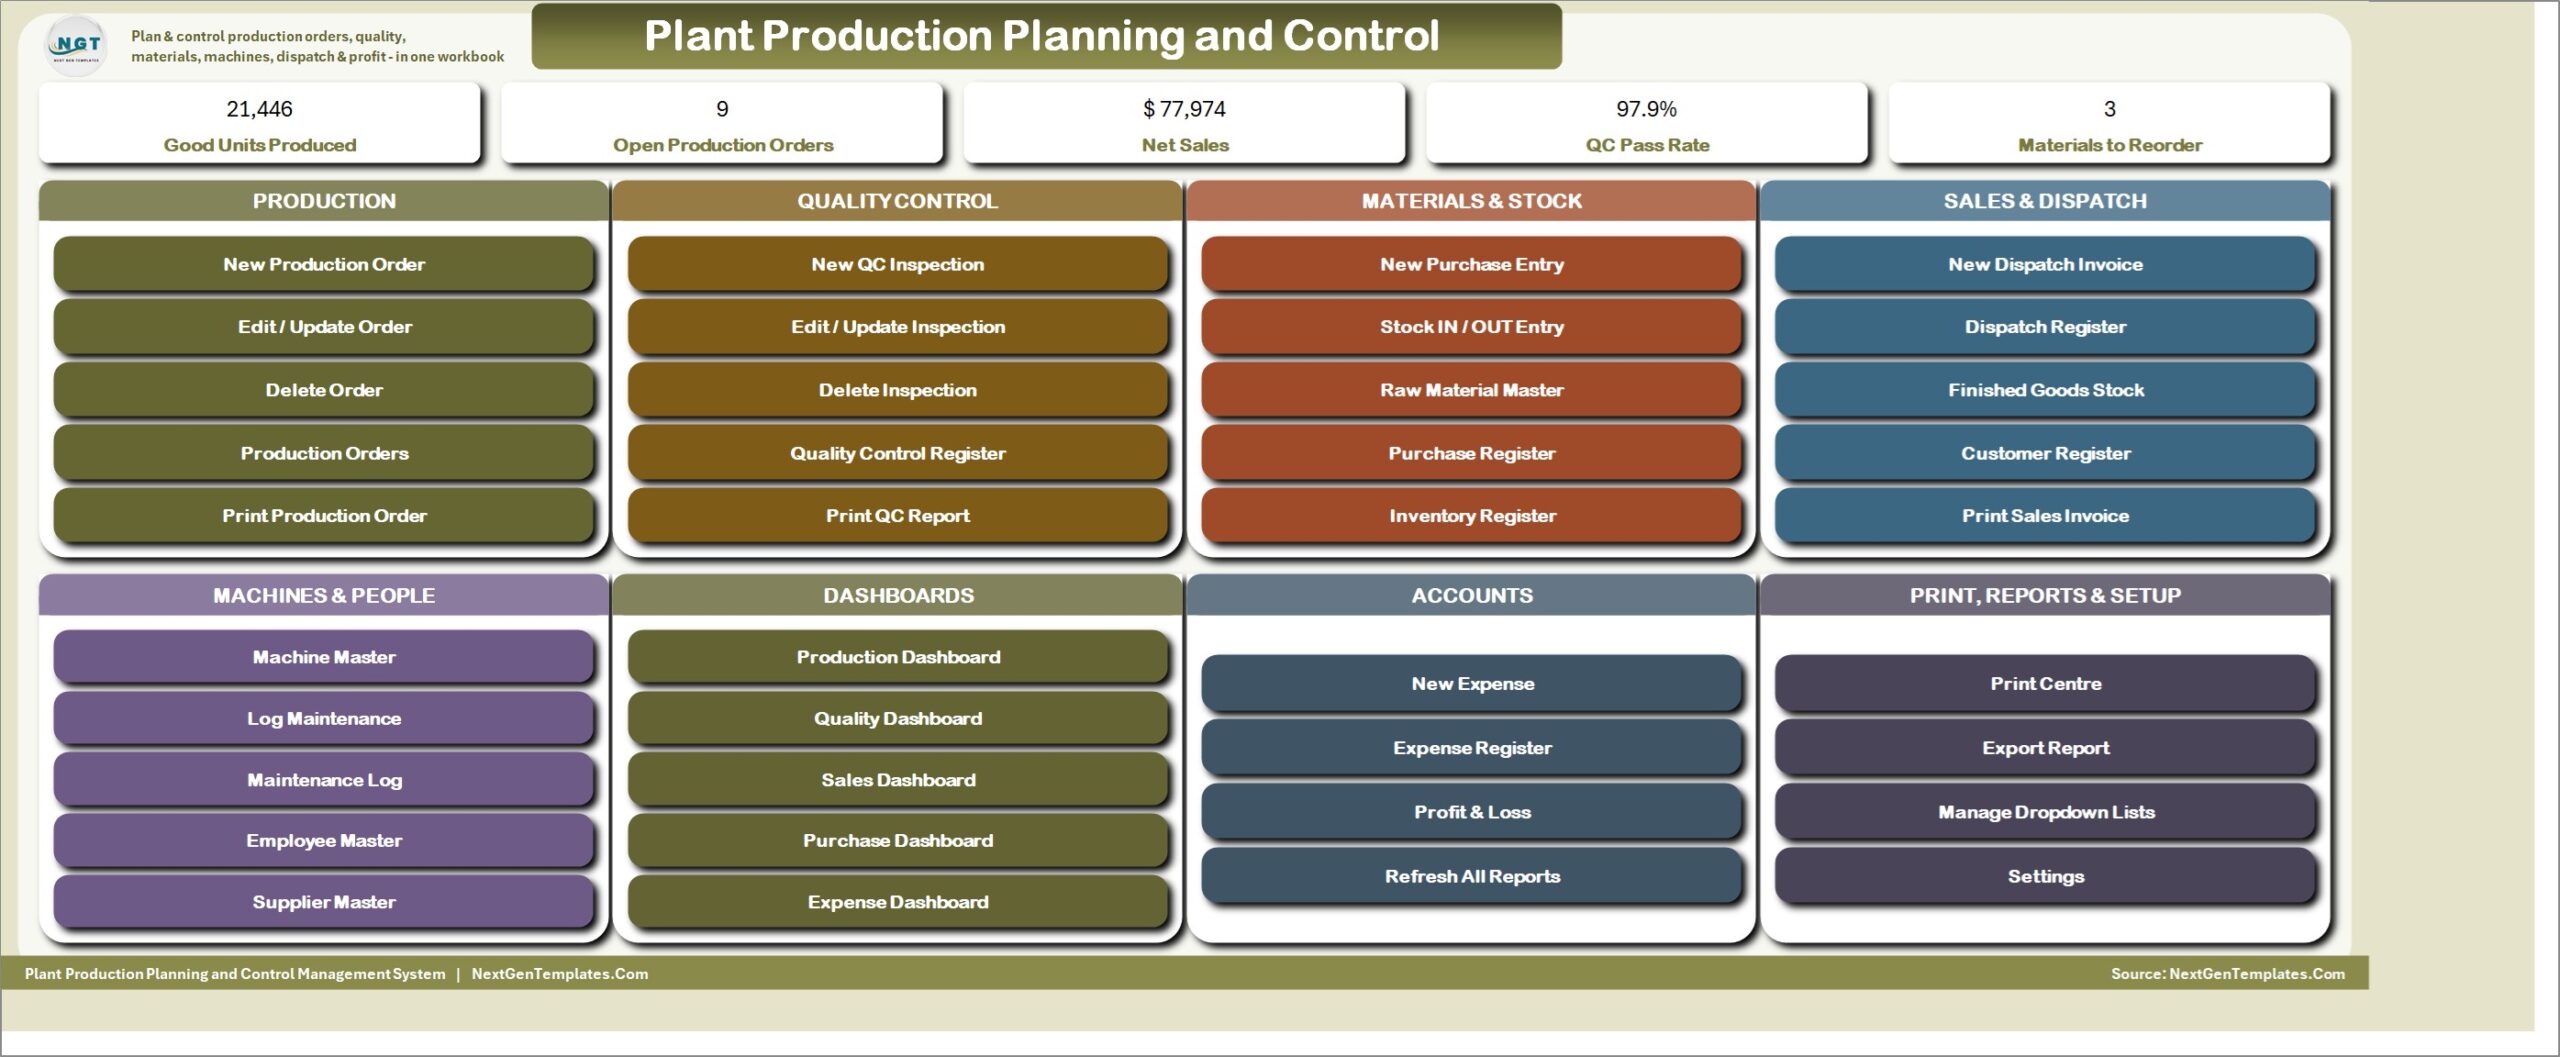
The workbook opens on MAIN. Five live KPI chips – Good Units Produced, Open Production Orders, Net Sales, QC Pass Rate and Materials to Reorder – sit above eight colour-coded cards: Production, Quality Control, Materials & Stock, Sales & Dispatch, Machines & People, Dashboards, Accounts and Print, Reports & Setup. Every job in the system starts from one of its 38 buttons, and every other sheet has a MAIN button that brings you back.
Production Dashboard
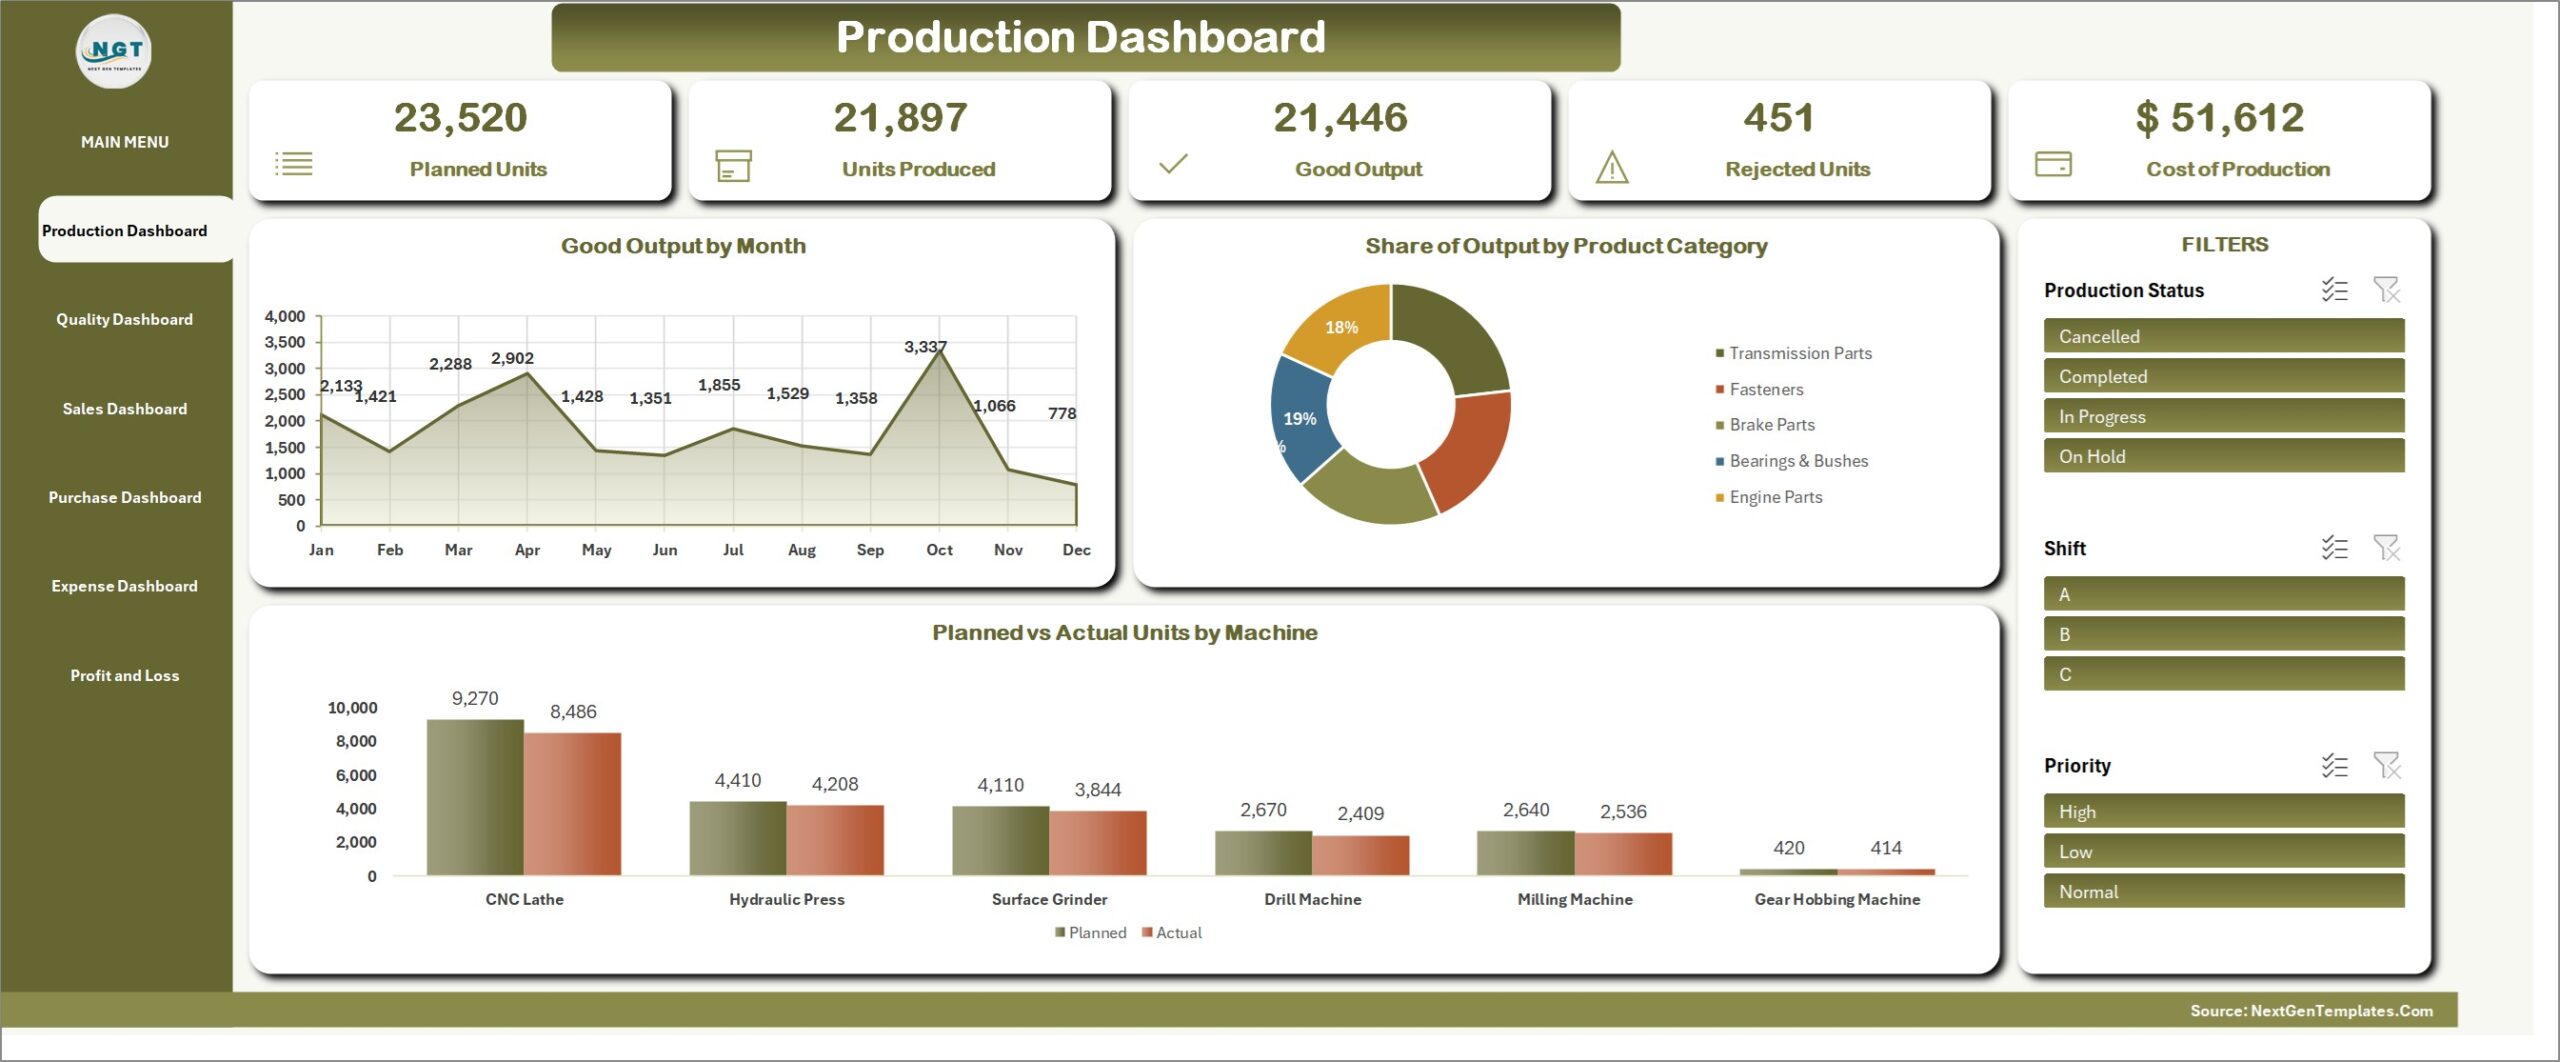
Planned Units, Units Produced, Good Output, Rejected Units and Cost of Production across the top, then Good Output by Month, Share of Output by Product Category and Planned vs Actual Units by Machine. The machine chart is the one to watch: the gap between the two bars is lost output. Slicers for Production Status, Shift and Priority filter everything on the page.
Quality Control Dashboard
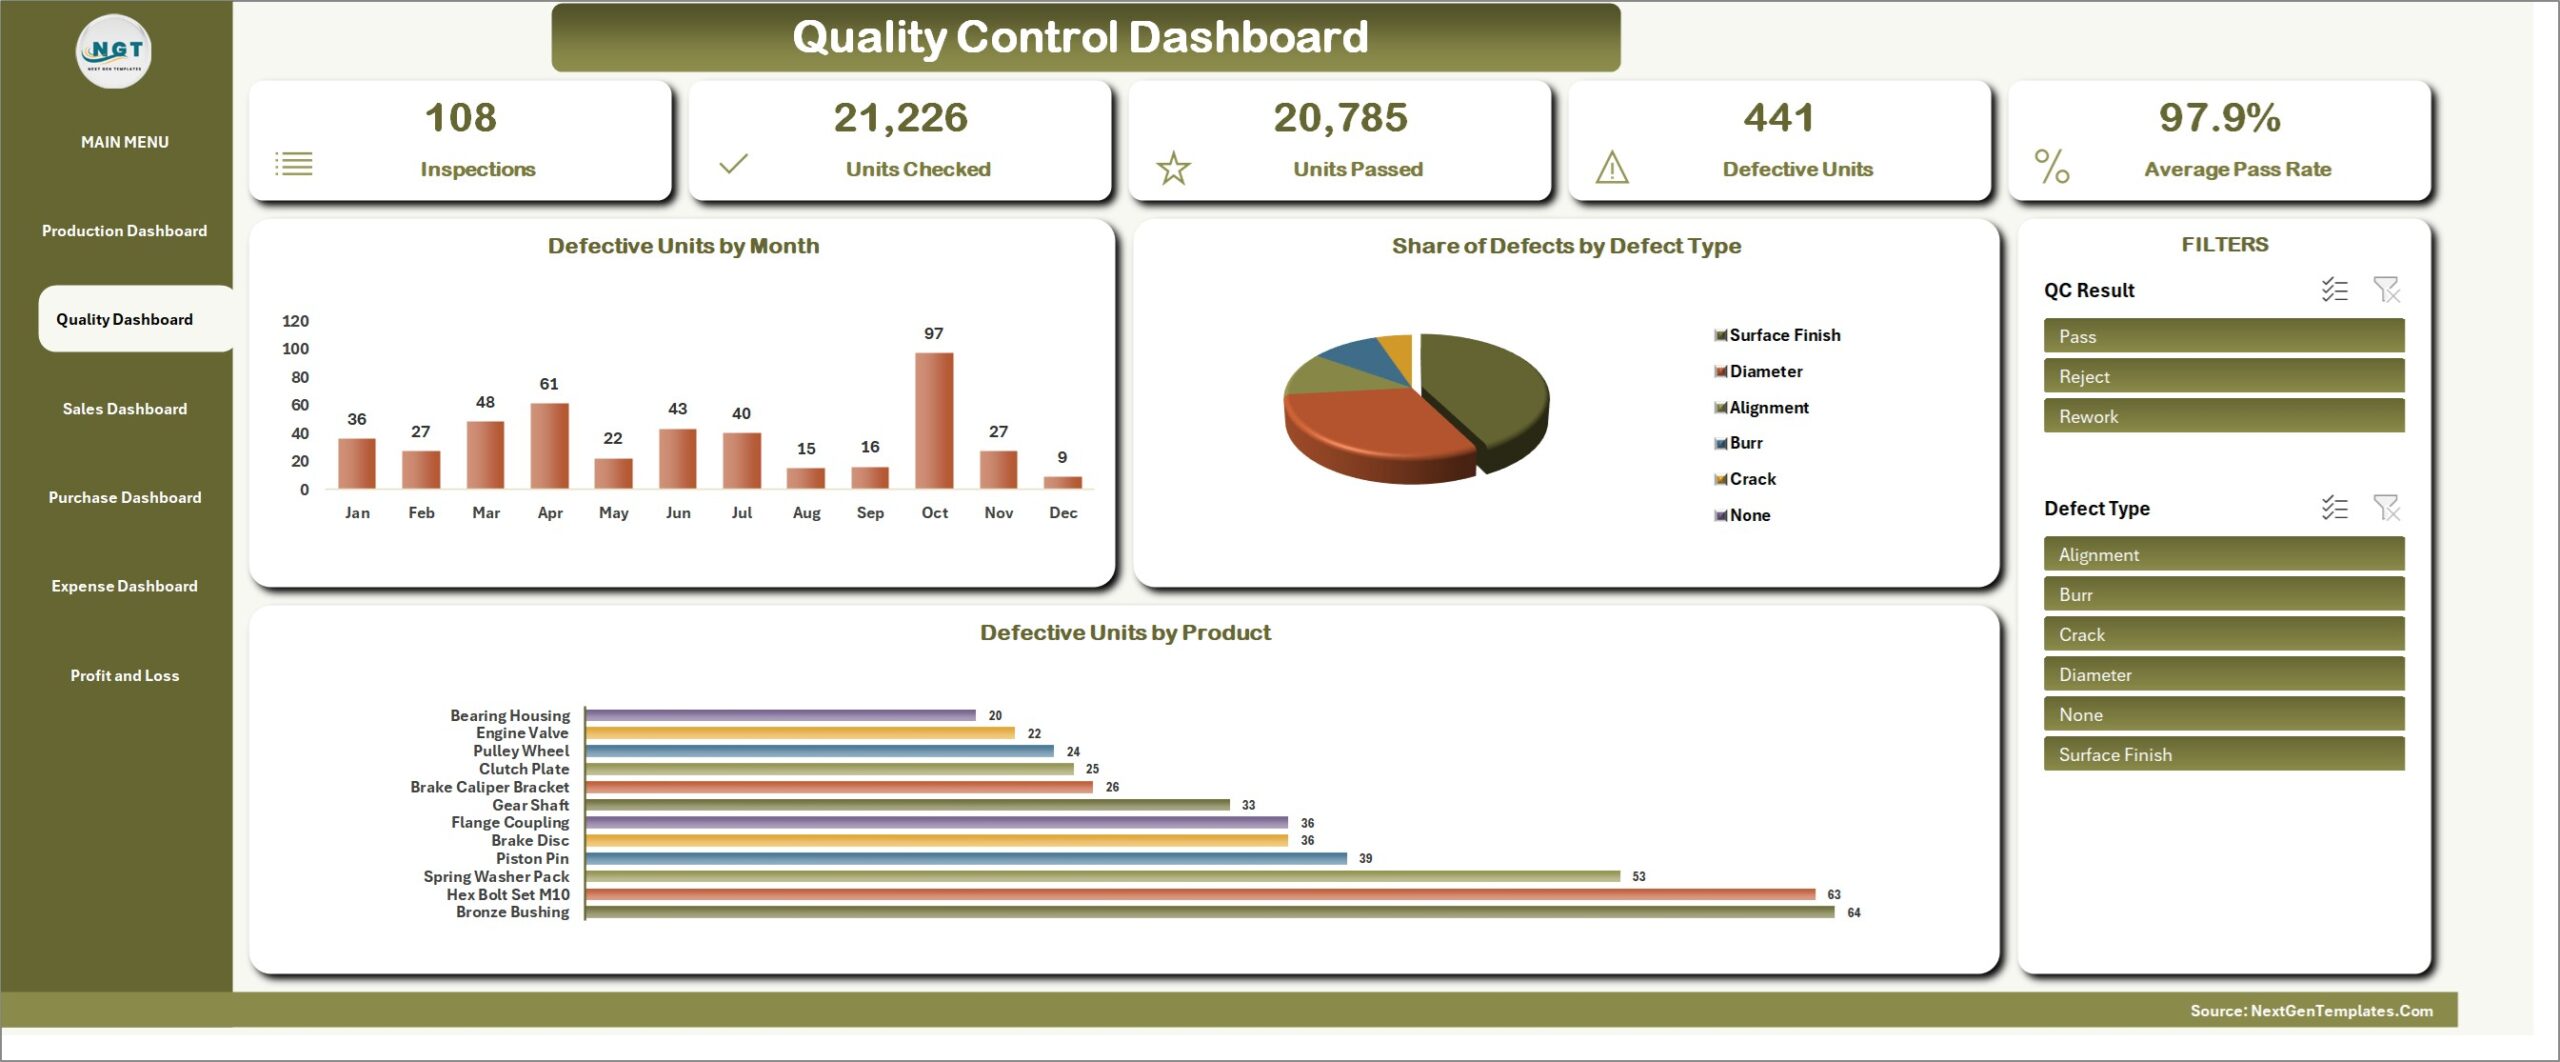
Inspections, Units Checked, Units Passed, Defective Units and Average Pass Rate, with Defective Units by Month, Share of Defects by Defect Type and Defective Units by Product. Filtering to Rework or one defect type shows at a glance which product and which fault are costing you.
Sales & Dispatch Dashboard
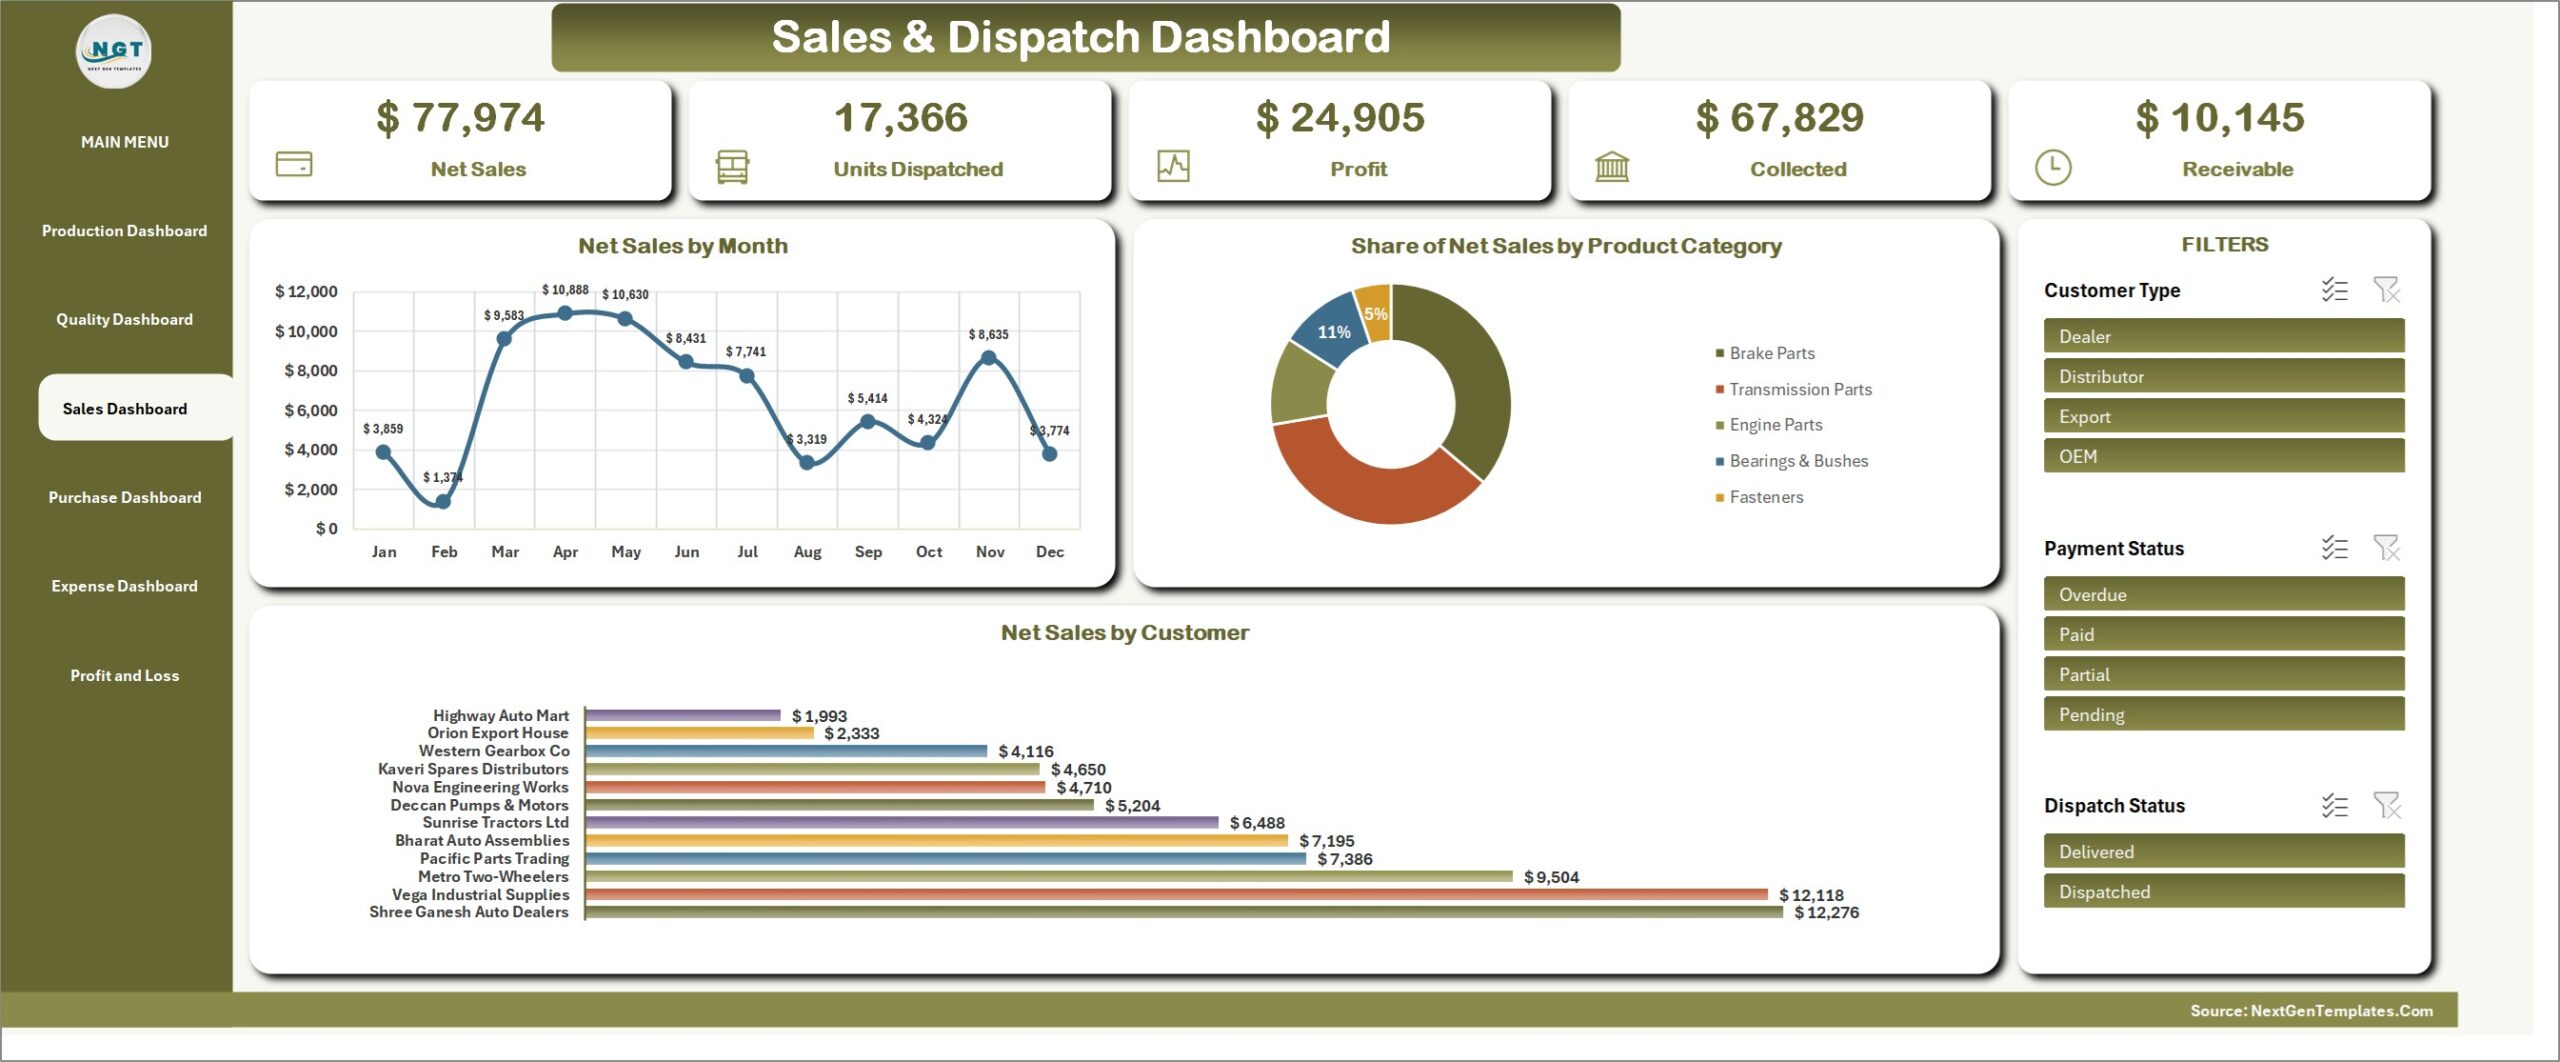
Net Sales, Units Dispatched, Profit, Collected and Receivable, with Net Sales by Month, Share of Net Sales by Product Category and Net Sales by Customer. Slicers for Customer Type, Payment Status and Dispatch Status make it a quick receivables review too.
Purchase & Materials Dashboard
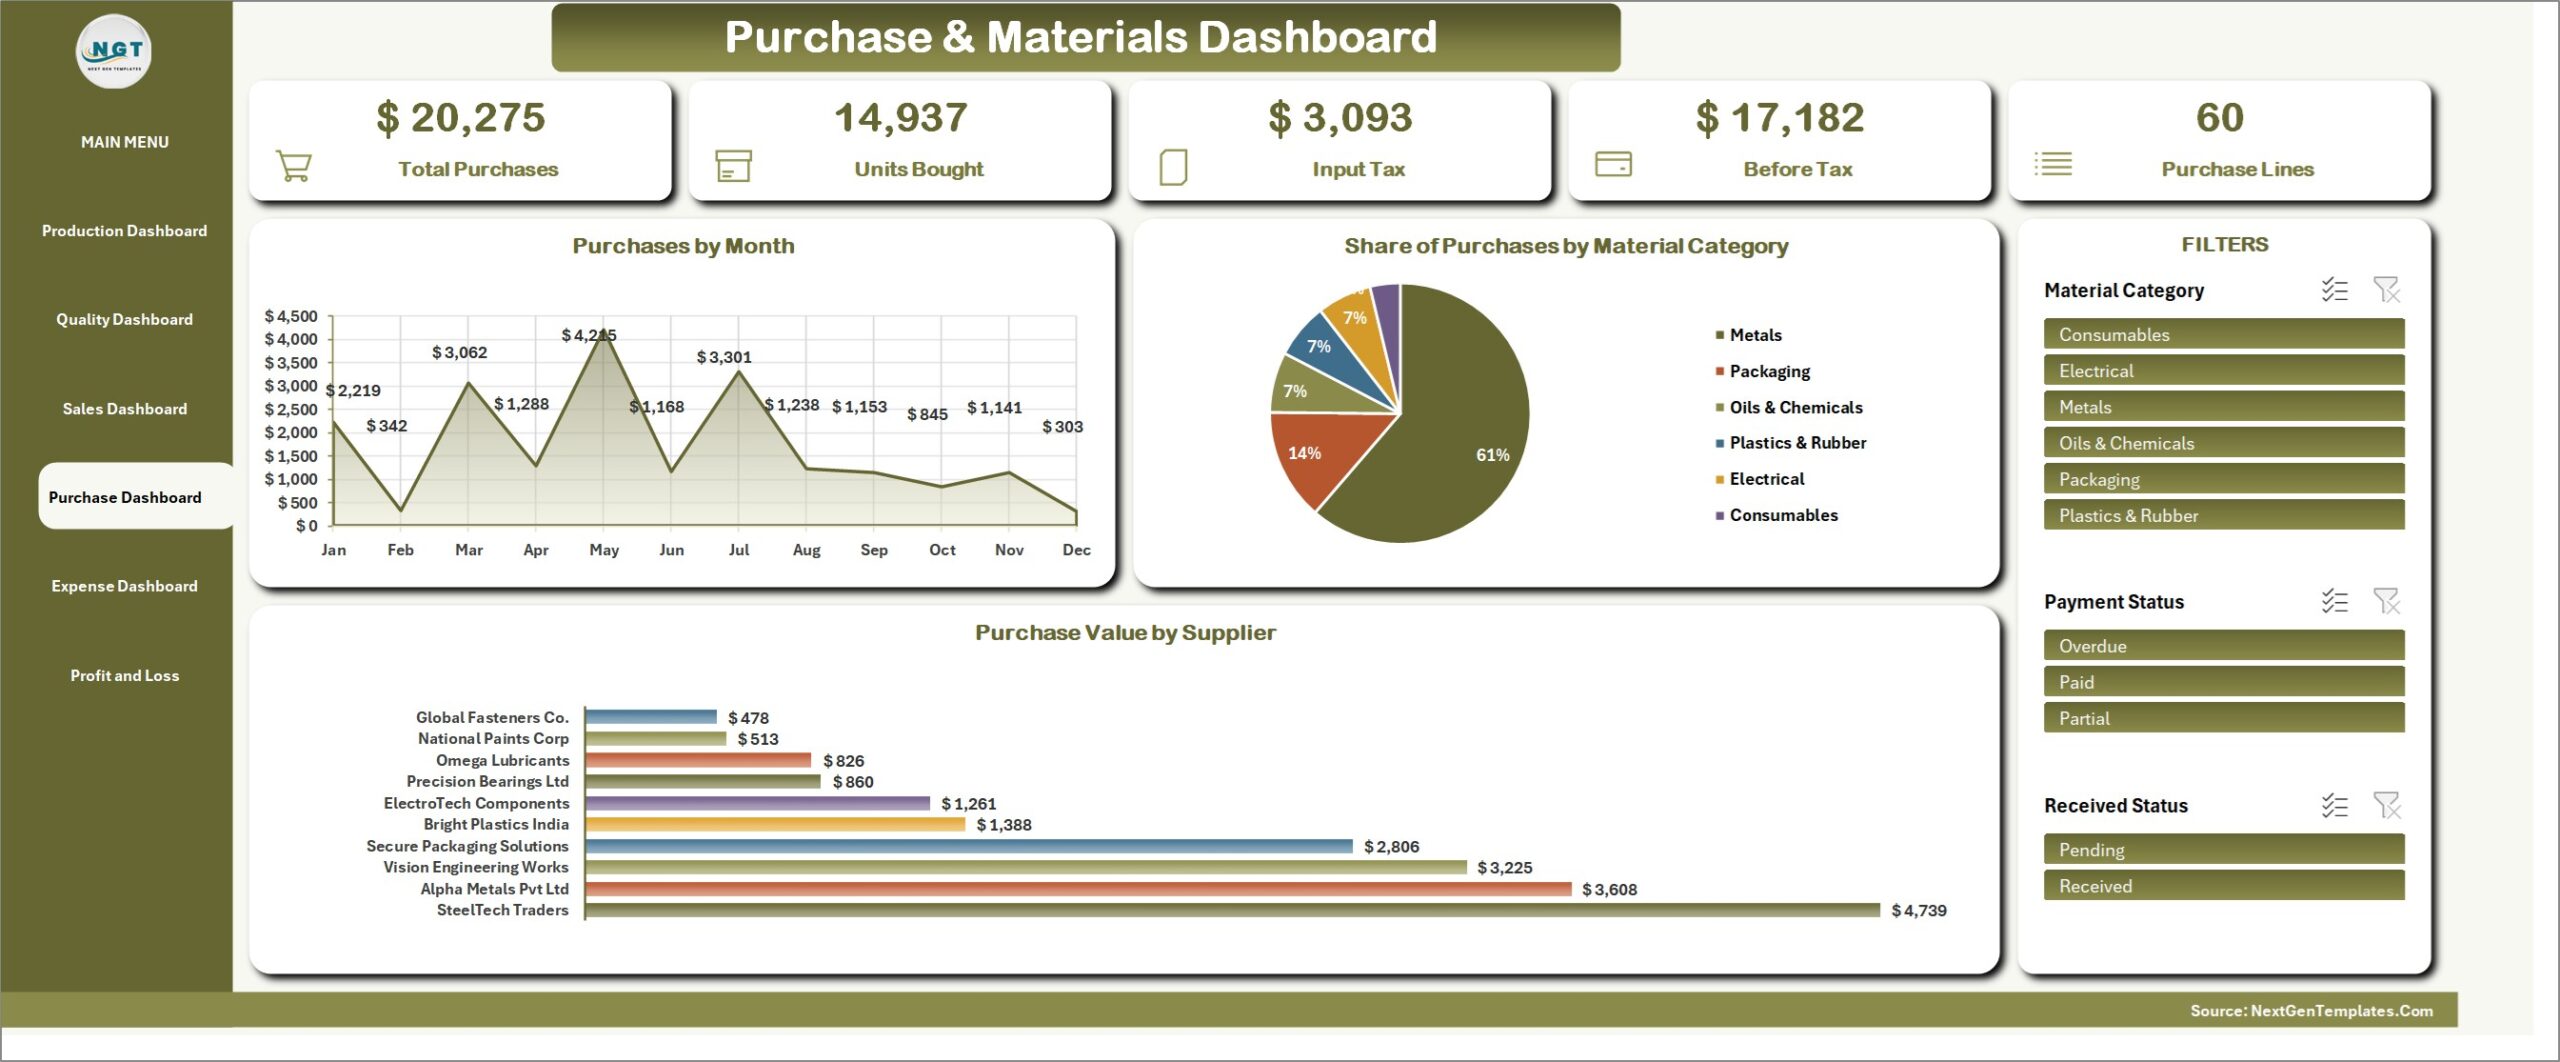
Total Purchases, Units Bought, Input Tax, Before Tax and Purchase Lines, with Purchases by Month, Share of Purchases by Material Category and Purchase Value by Supplier – useful when you negotiate with the two or three suppliers who carry most of the spend.
Expense Dashboard
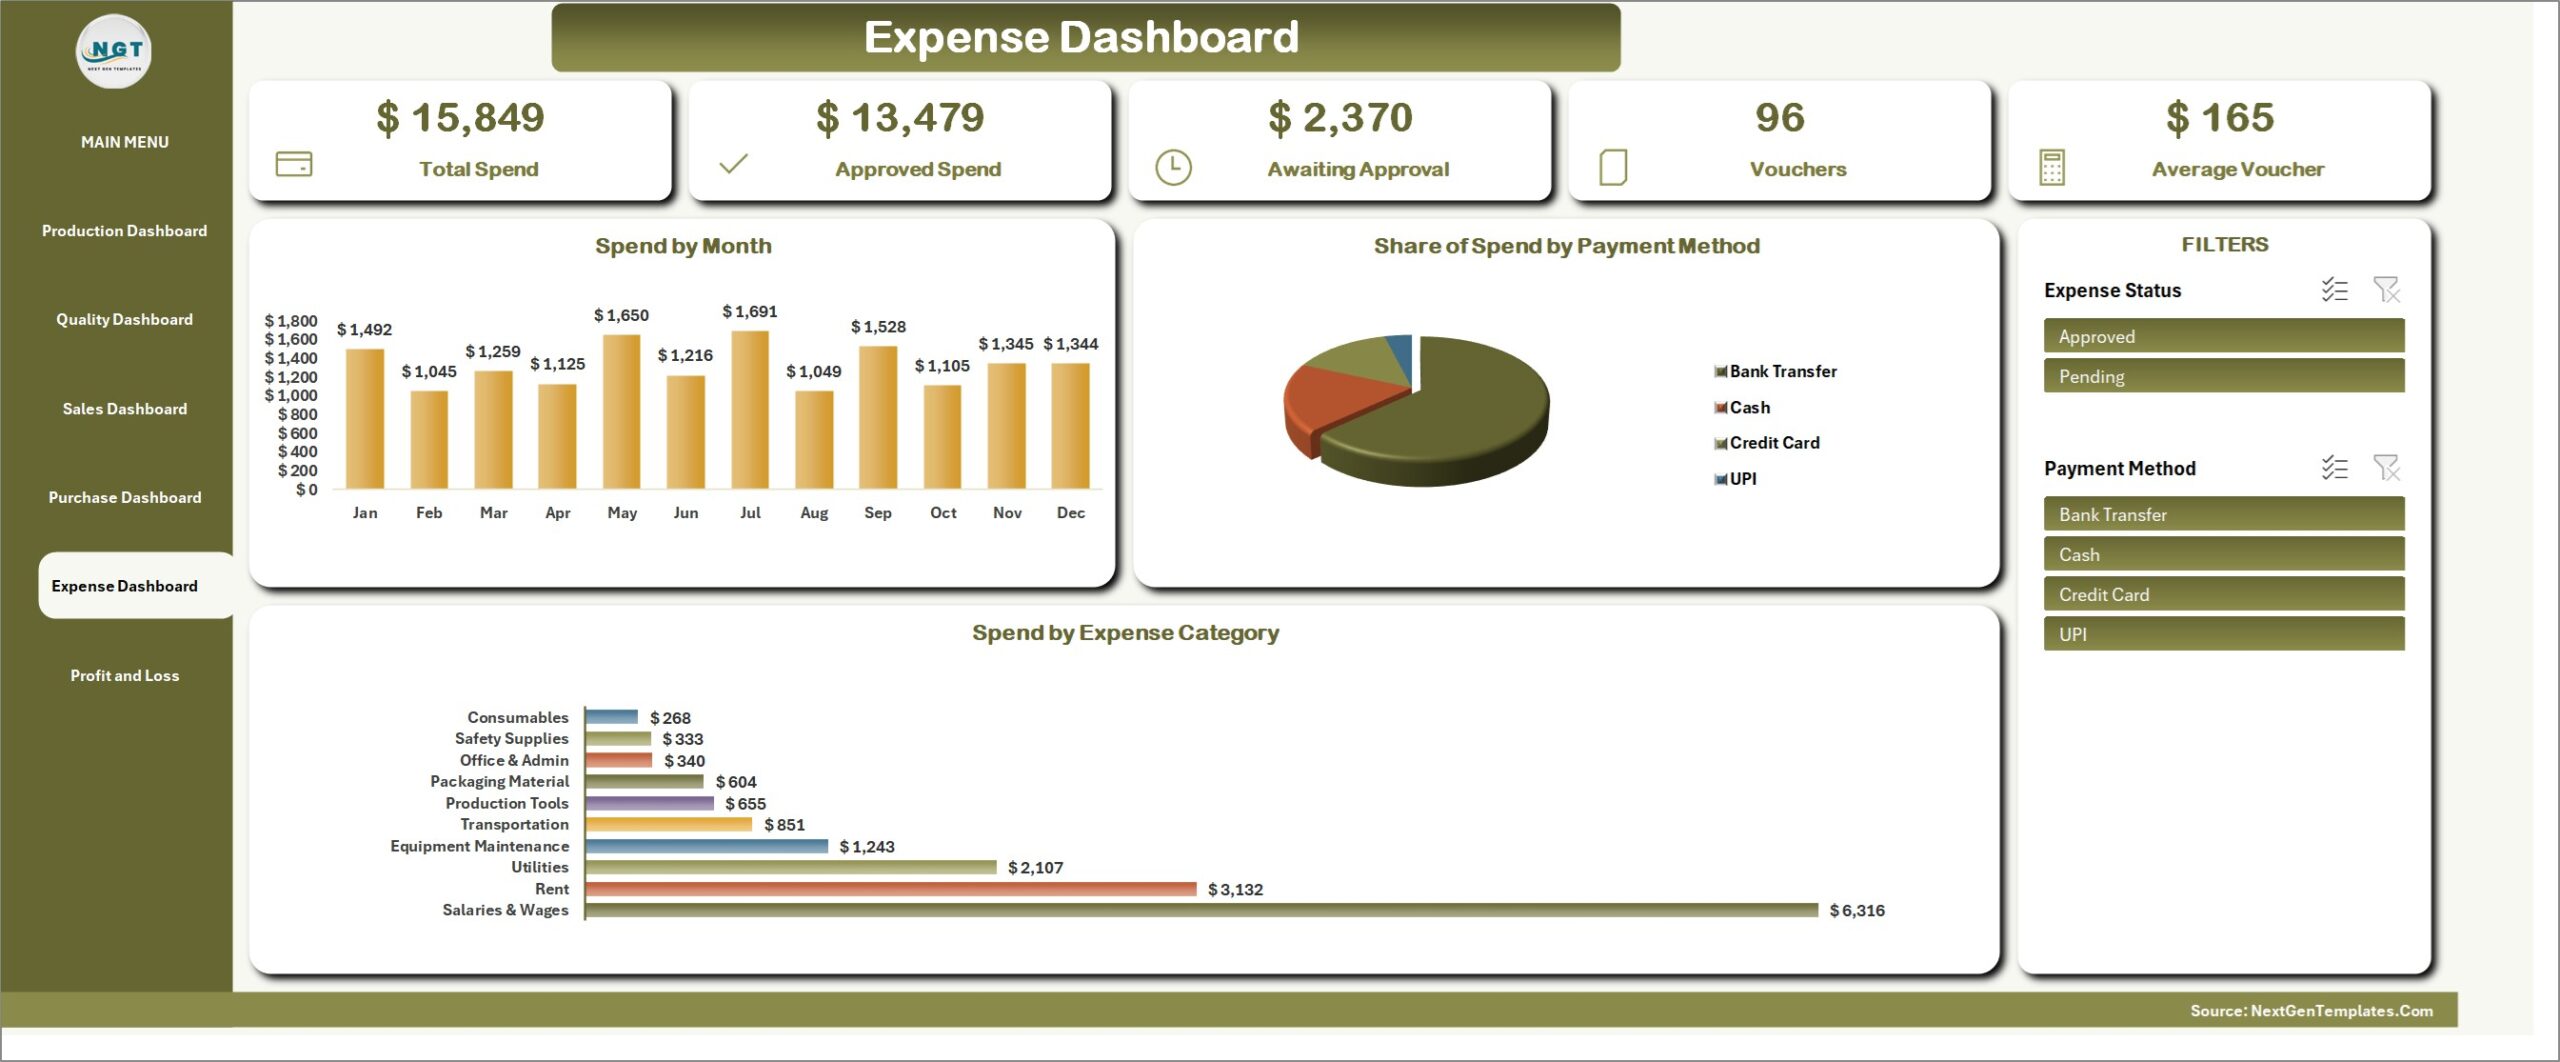
Total Spend, Approved Spend, Awaiting Approval, Vouchers and Average Voucher, with Spend by Month, Share of Spend by Payment Method and Spend by Expense Category.
Profit & Loss statement
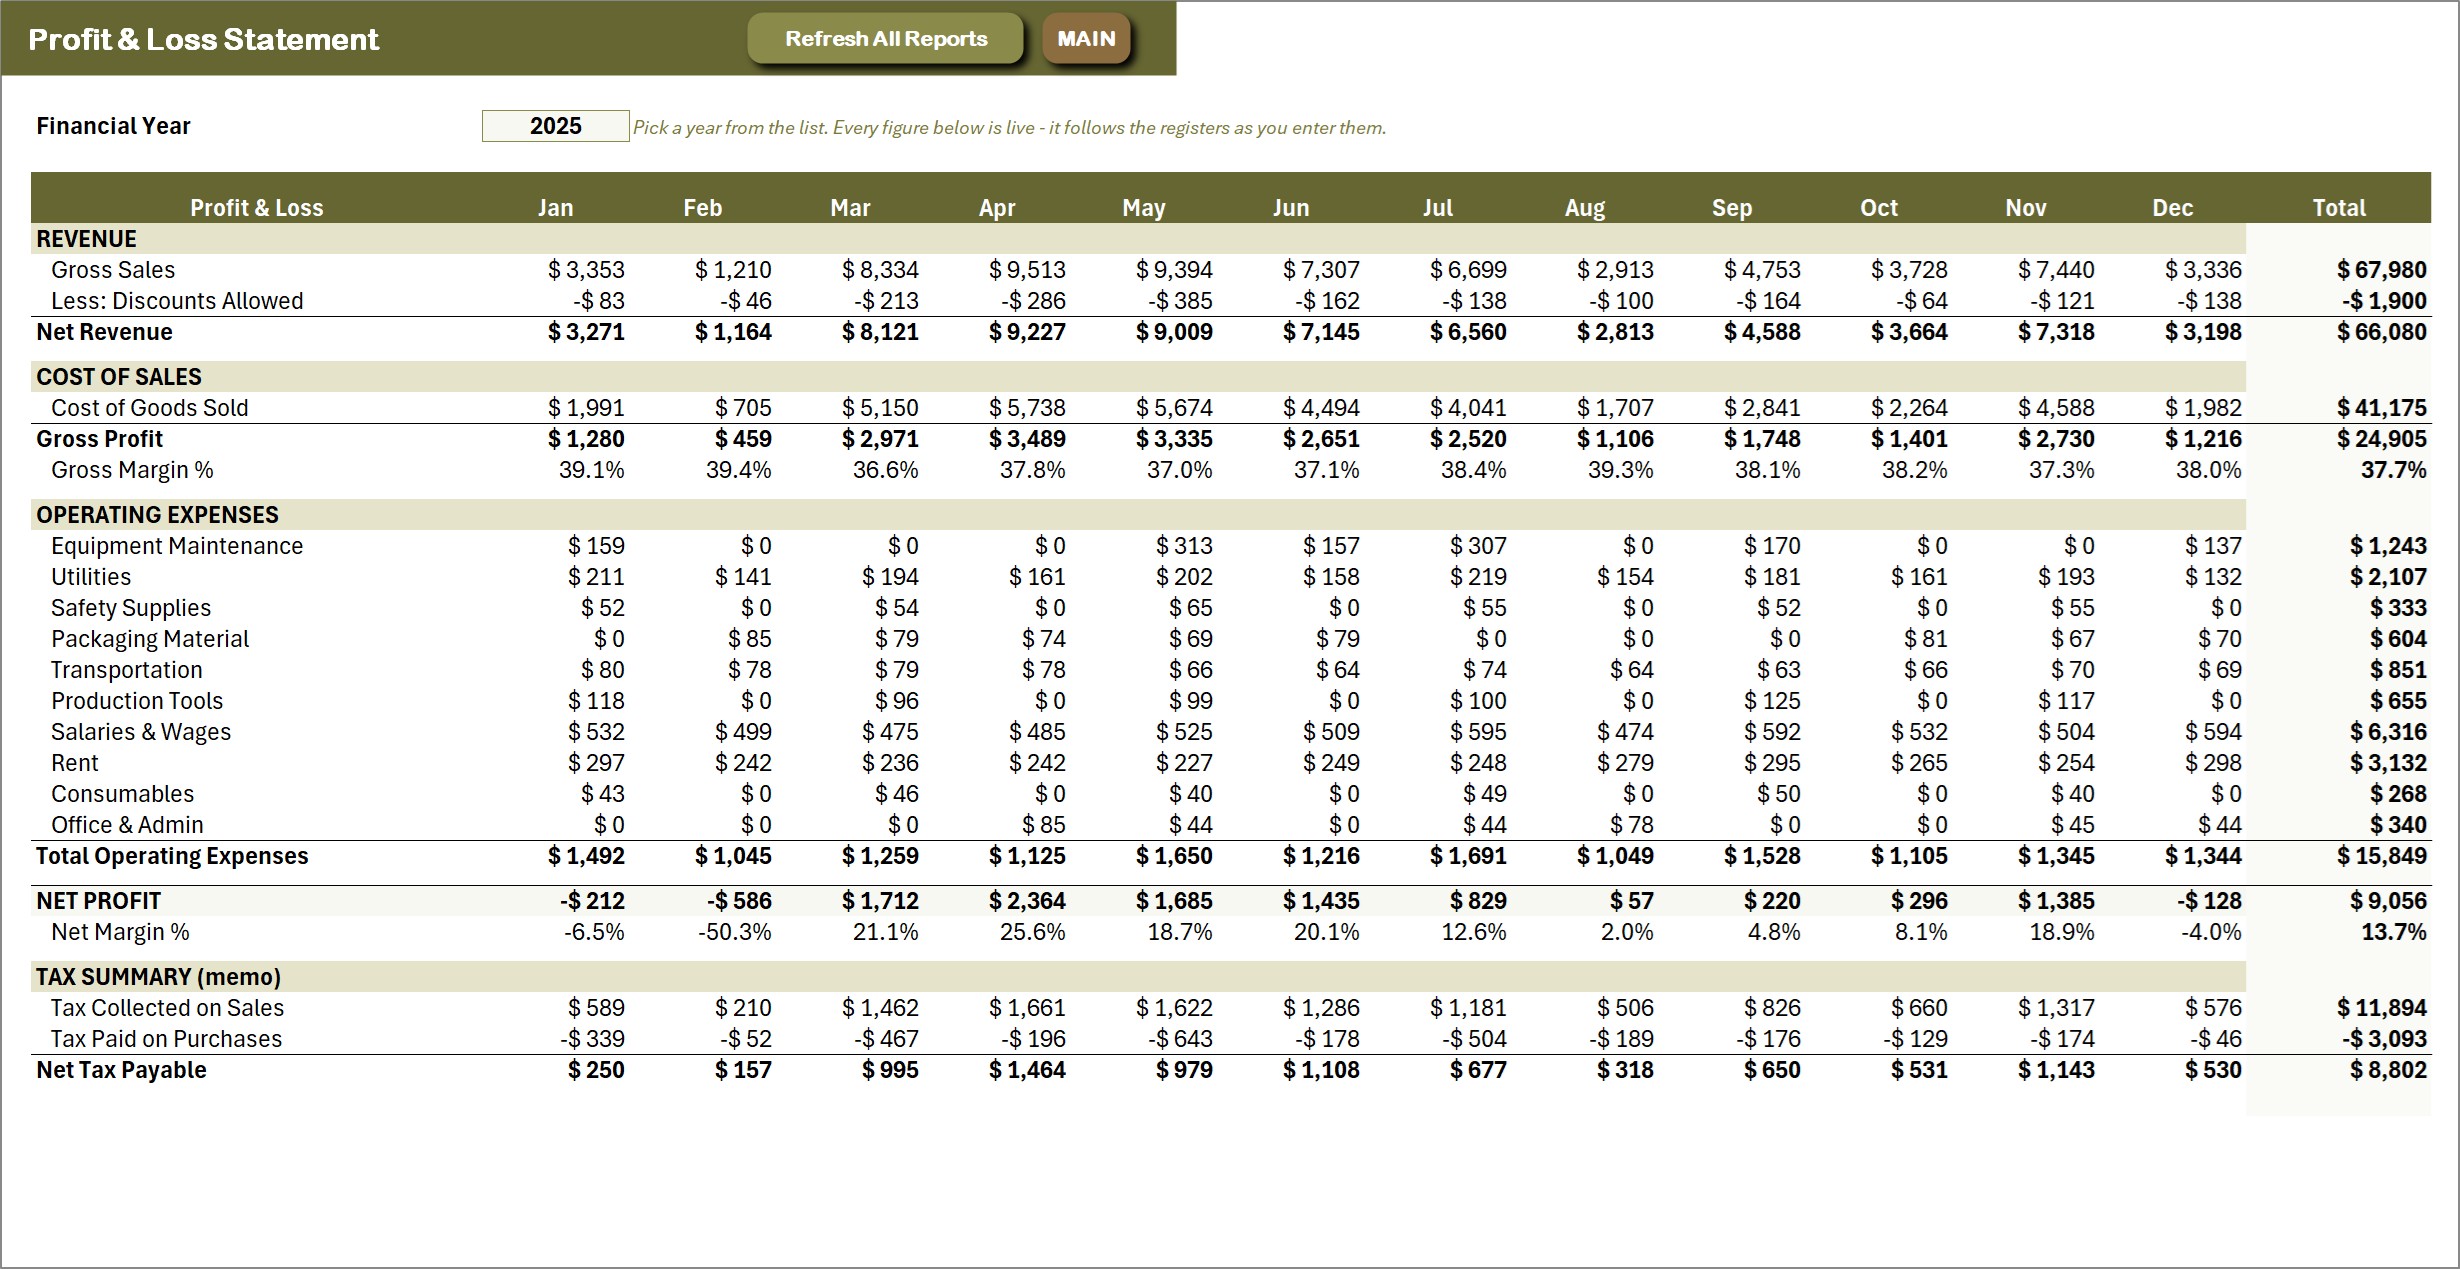
Twelve months and a year total: gross sales less discounts, cost of goods sold, gross profit and margin, each operating expense category, then net profit and net margin. A tax memo underneath shows tax collected on sales, tax paid on purchases and the net tax payable. Pick the year from the Financial Year dropdown and every figure follows the registers.
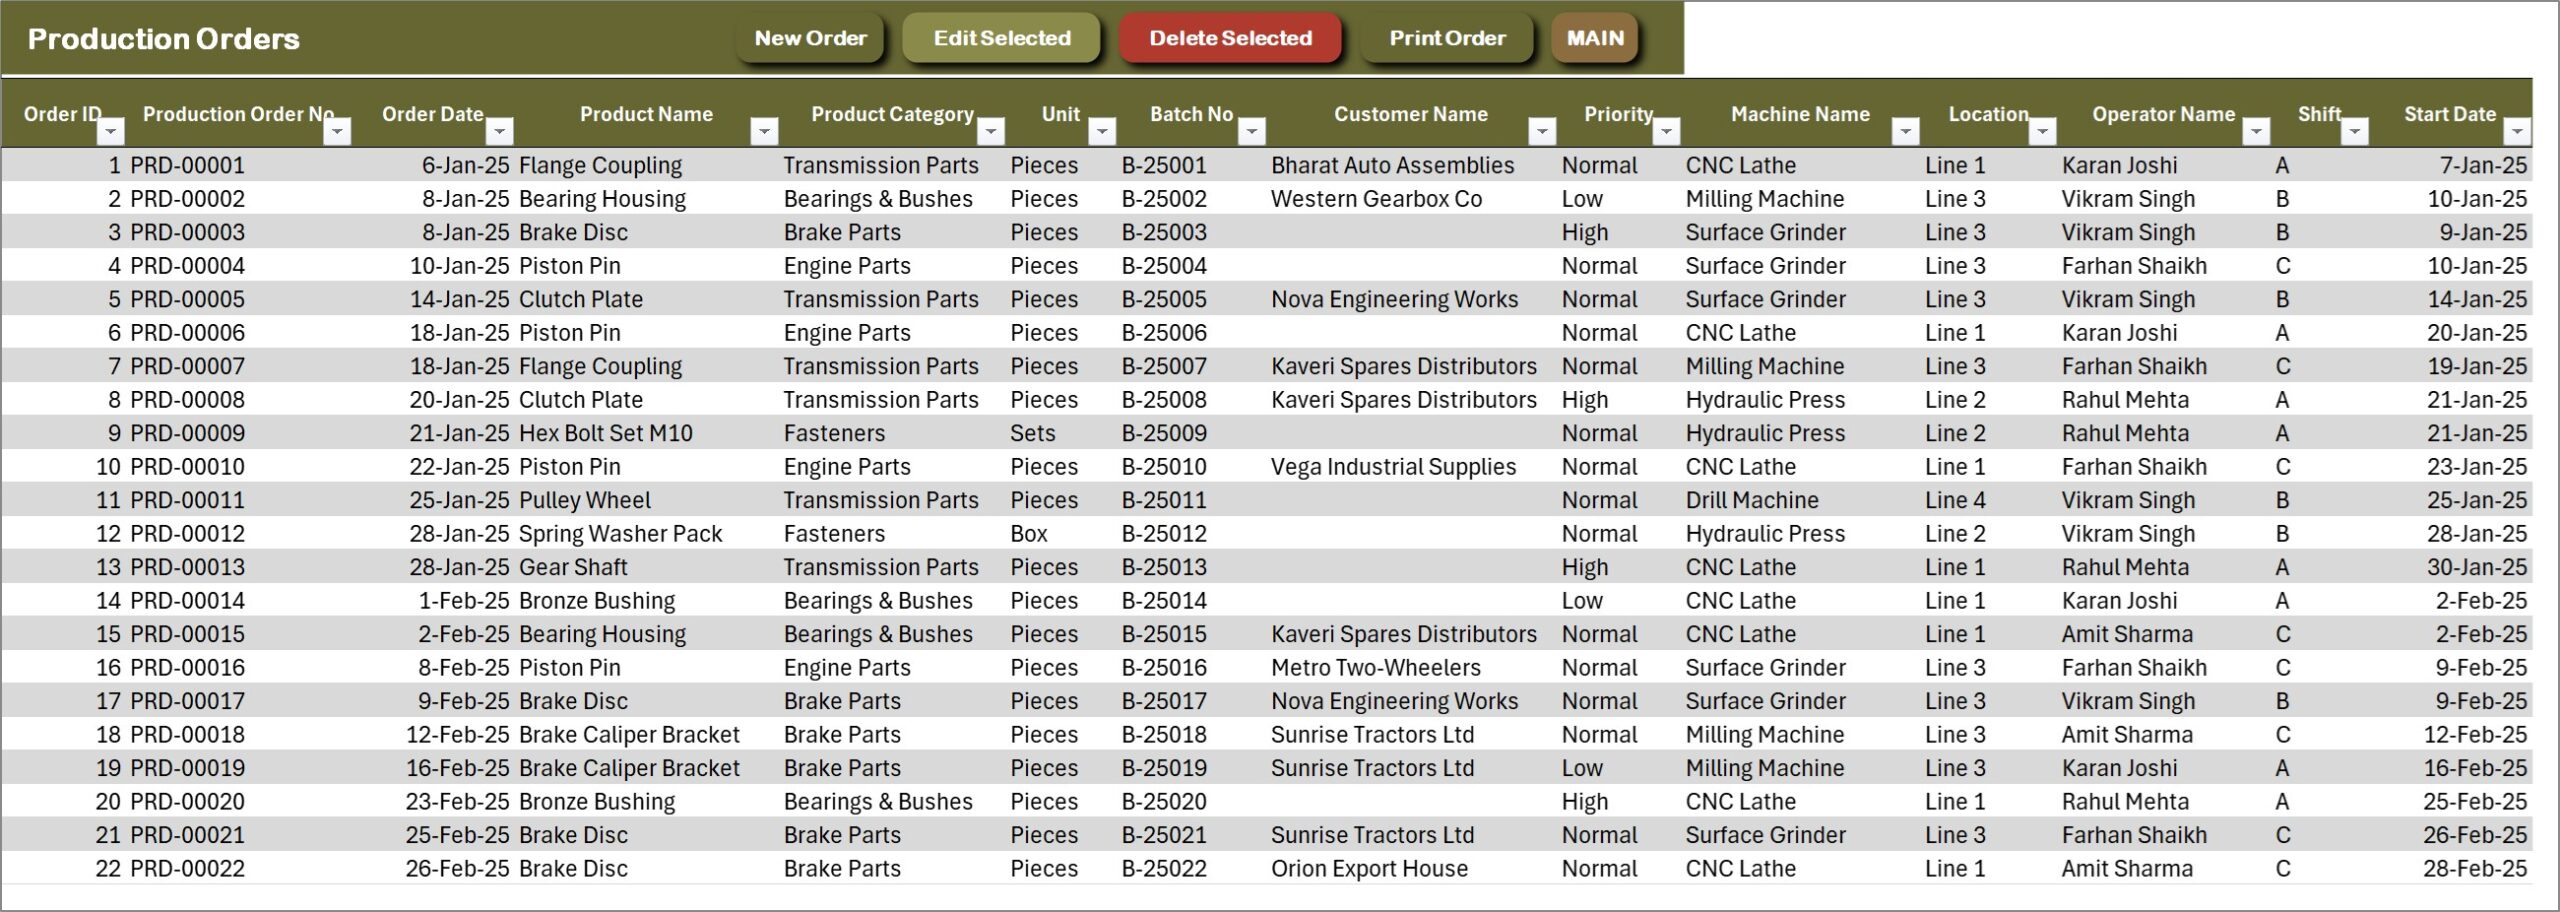
Production Orders ledger
The heart of the system: one row per order with product, batch, customer, priority, machine, line, operator, shift and dates, the planned, actual, rejected and good quantities, and the calculated achievement %, scrap %, capacity utilisation %, production cost and output value. New Order, Edit Selected, Delete Selected and Print Order sit on the action bar.
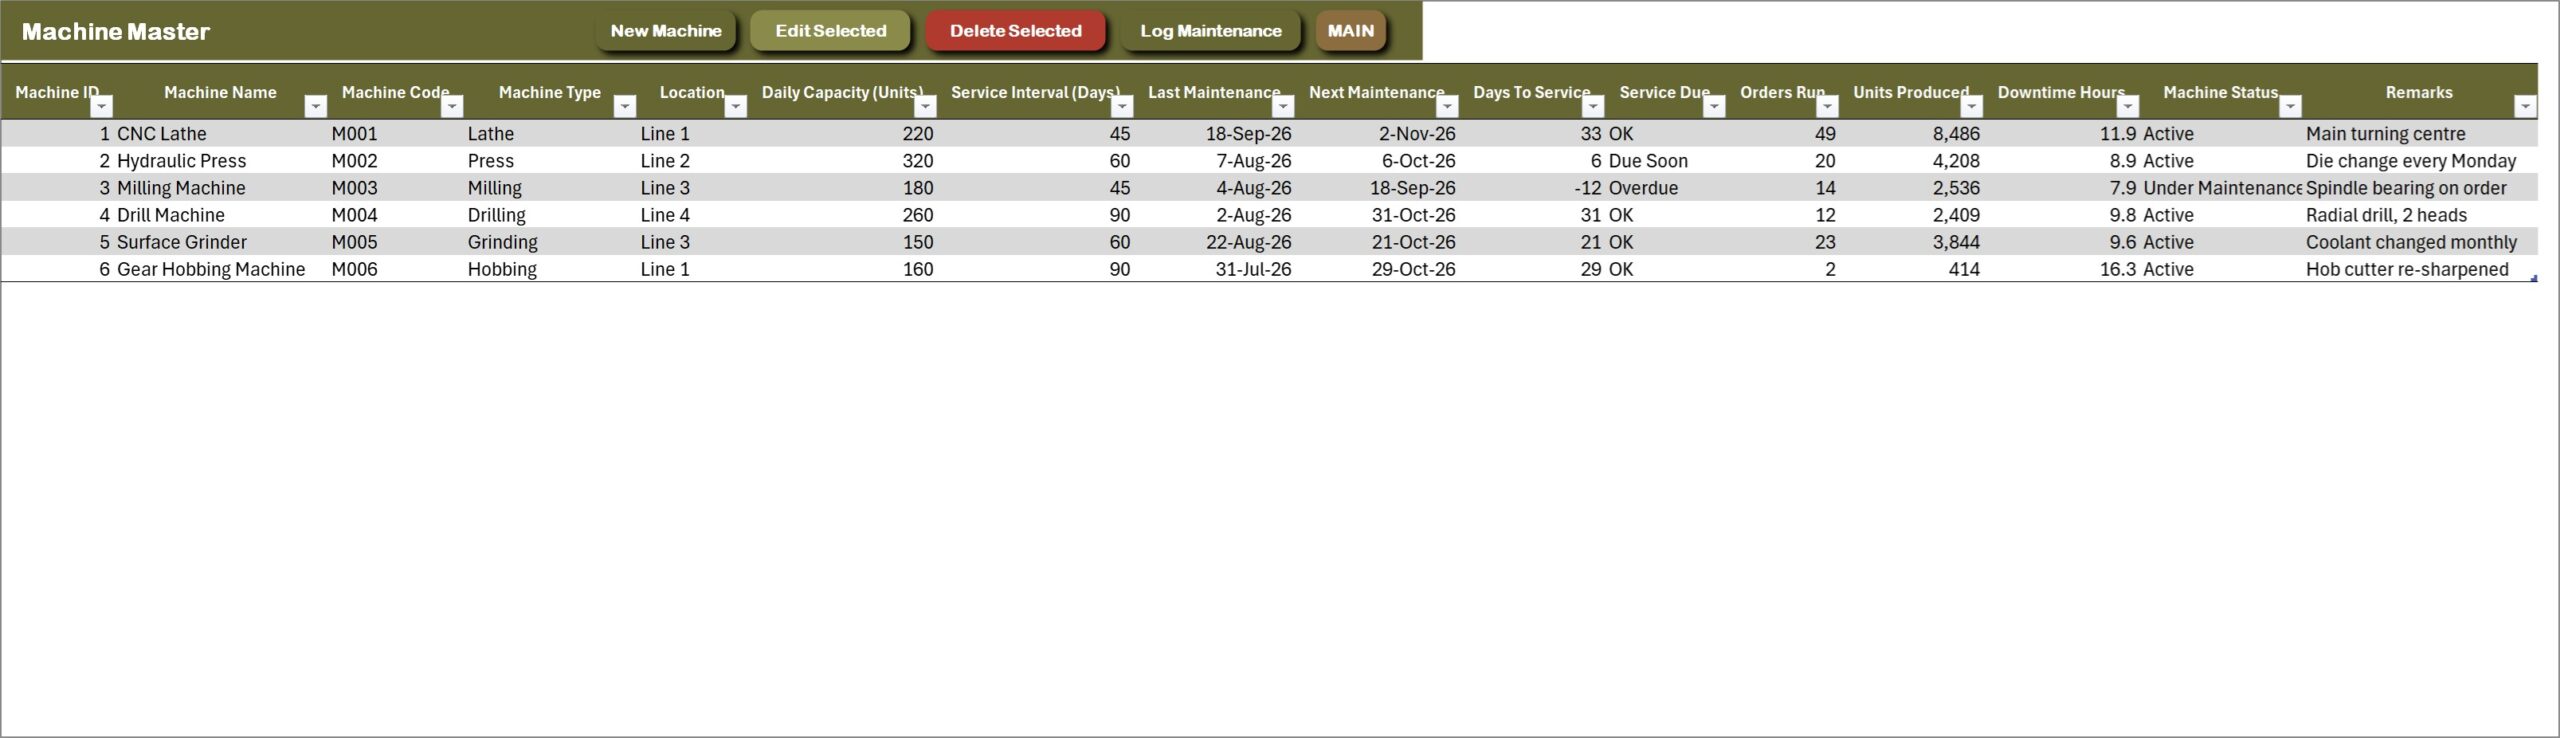
Machine Master and Maintenance Log
Each machine carries its daily capacity – which feeds capacity utilisation on every order – and a service interval. Log a job in the Maintenance Log and the machine’s last and next service dates update, days to service count down, and the Service Due column reads OK, Due Soon or Overdue.
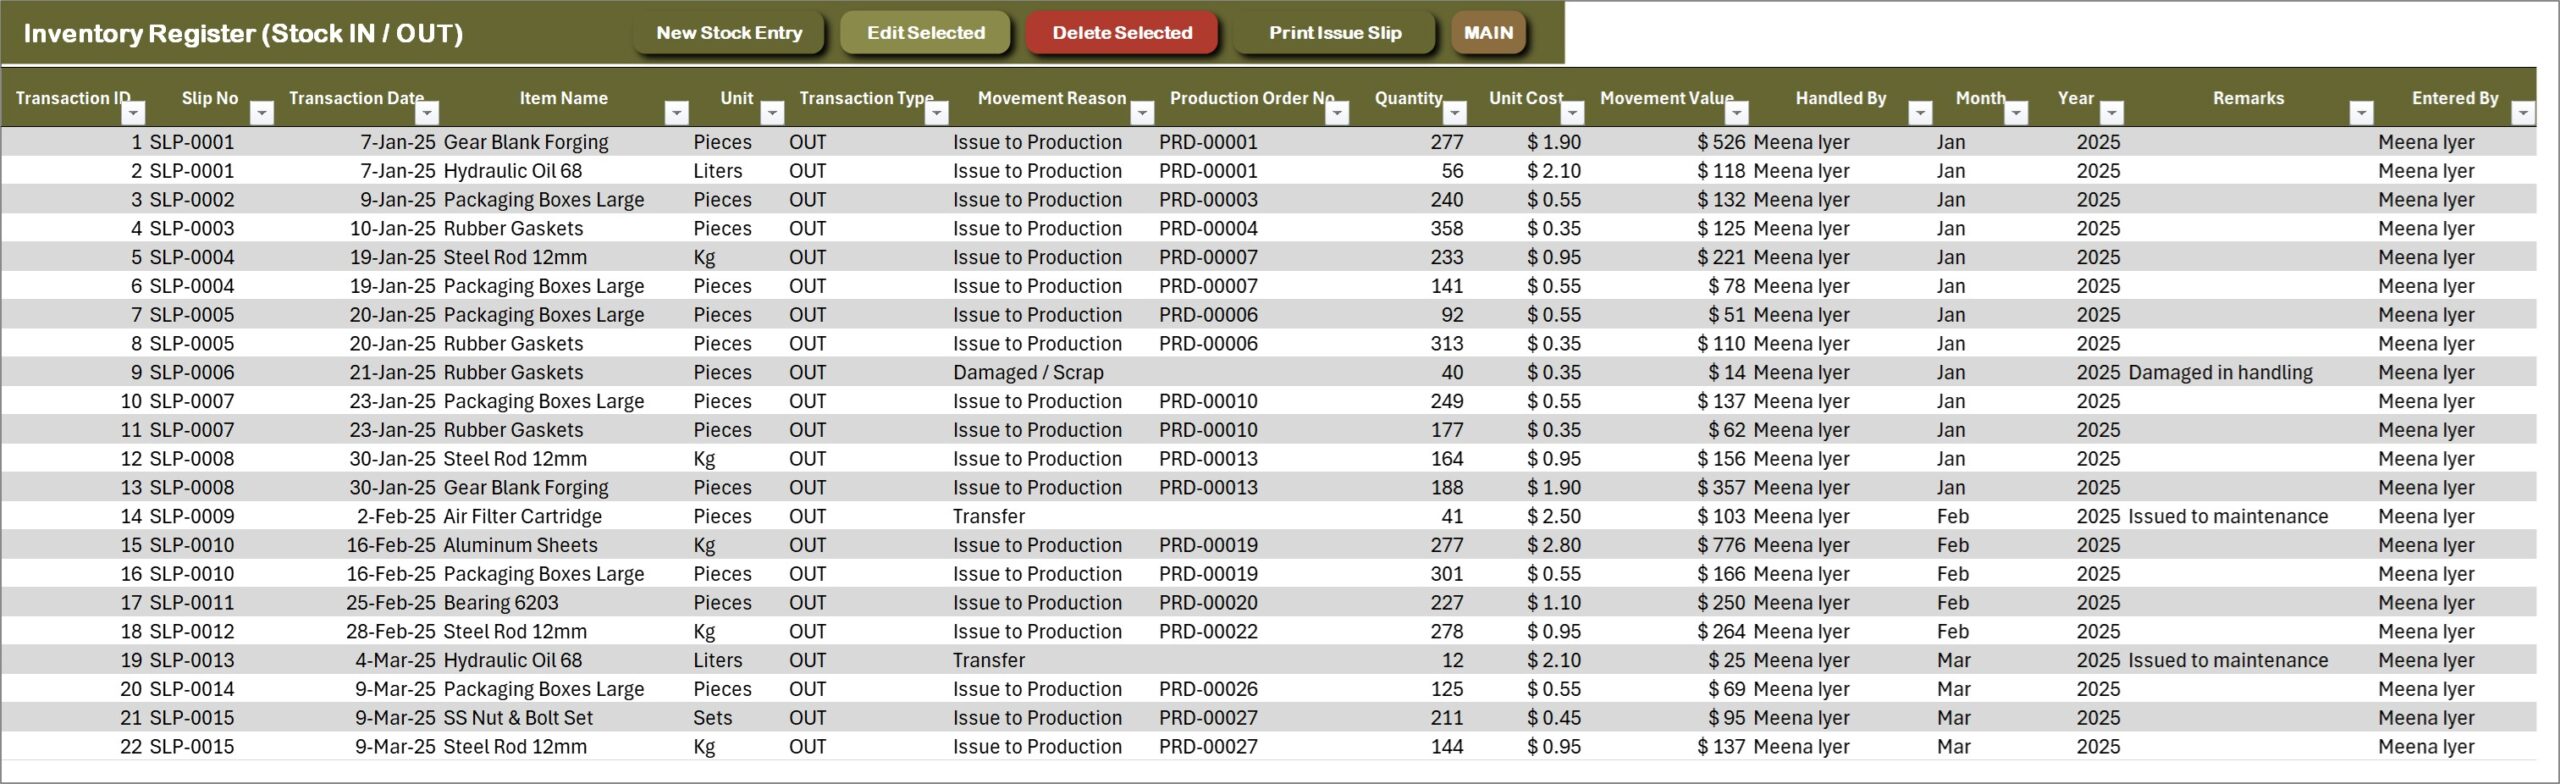
Inventory Register (Stock IN / OUT)
Every material movement with a slip number: issue to production, return from floor, damaged or scrap, or transfer, against the production order it belongs to. Stock in hand on the Raw Material Master moves with each slip, and Print Issue Slip gives the store keeper a signed copy.
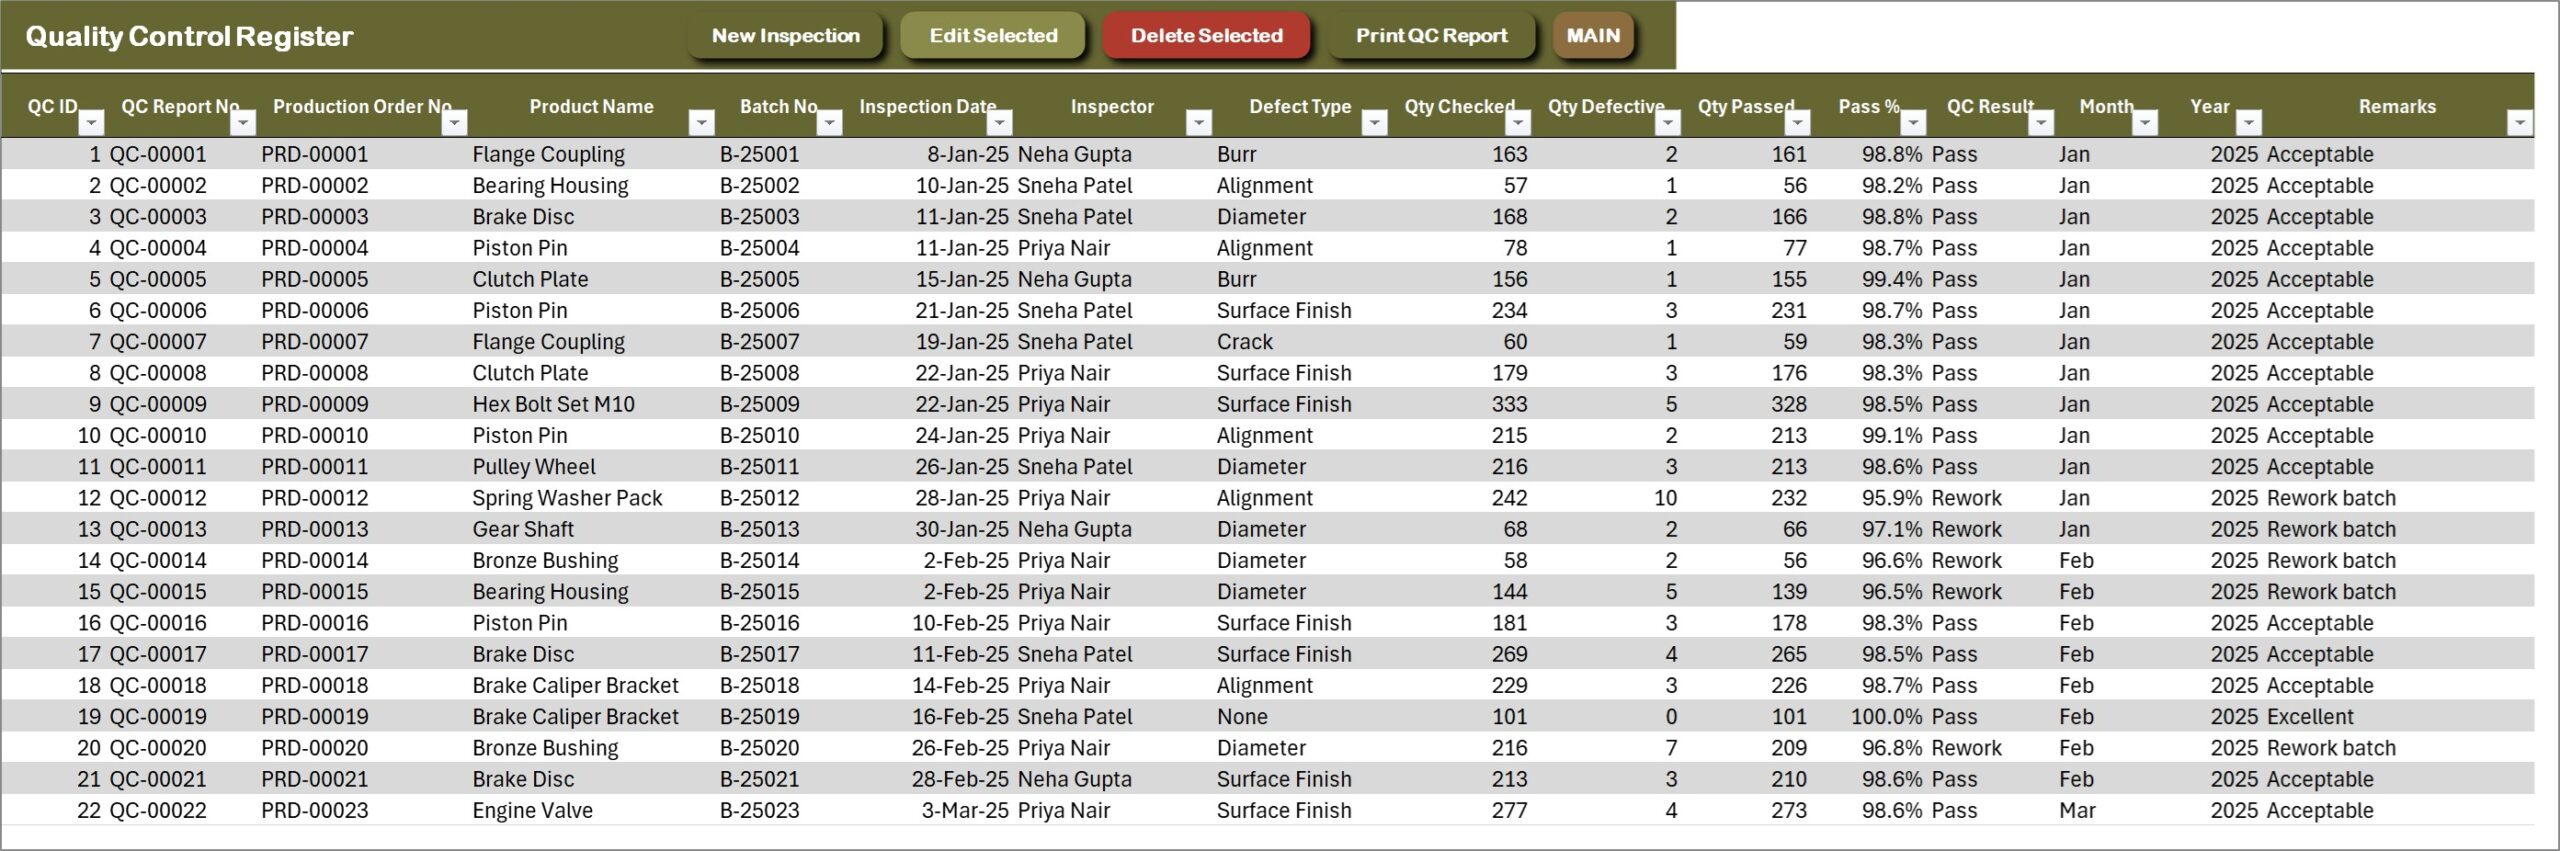
Quality Control Register
Every inspection with QC report number, production order, product, batch, inspector, defect type, quantities checked, defective and passed, pass % and result. Print QC Report prints the selected inspection for the rework tag.
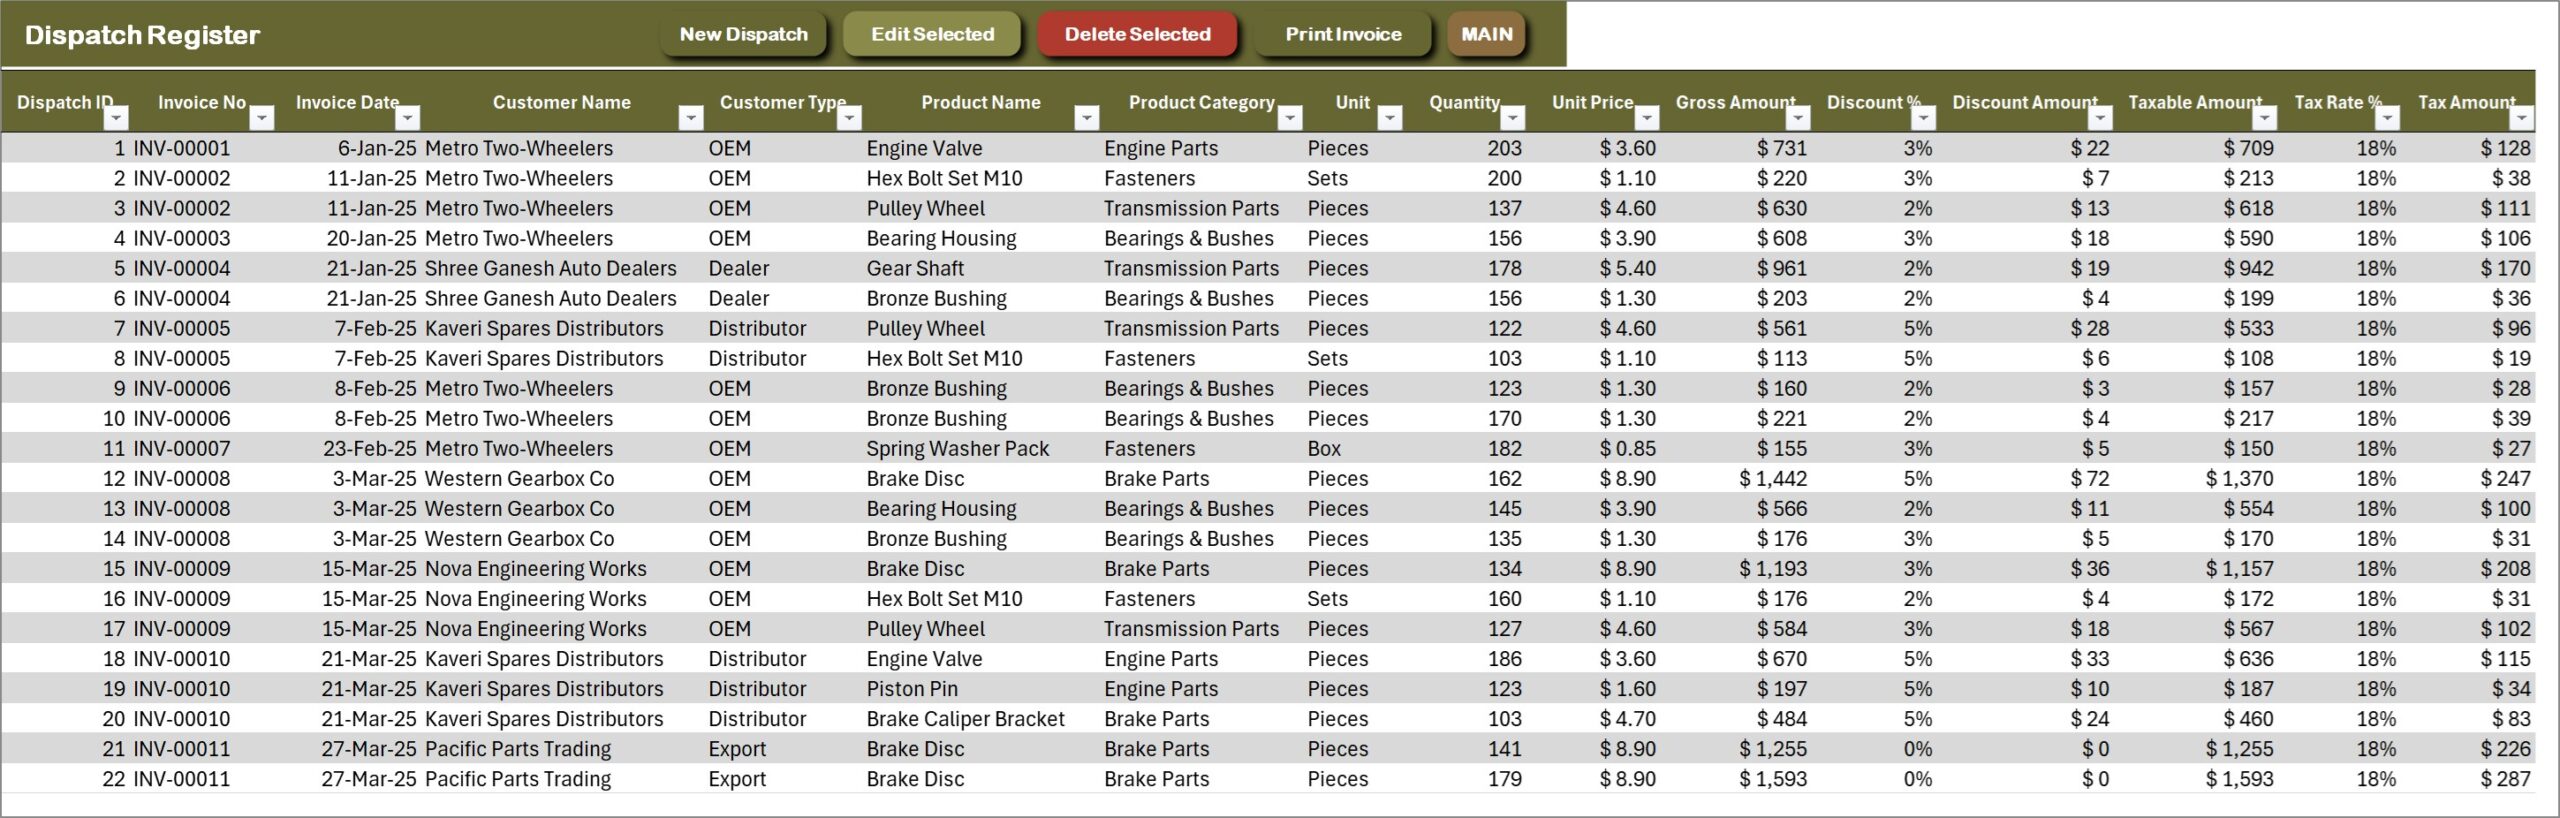
Dispatch Register
The sales side of the plant: invoice number, customer, product, quantity, price, discount, tax, net amount, cost, gross profit, payment status, amount paid, balance due, dispatch status and vehicle number. Print Invoice produces the tax invoice.
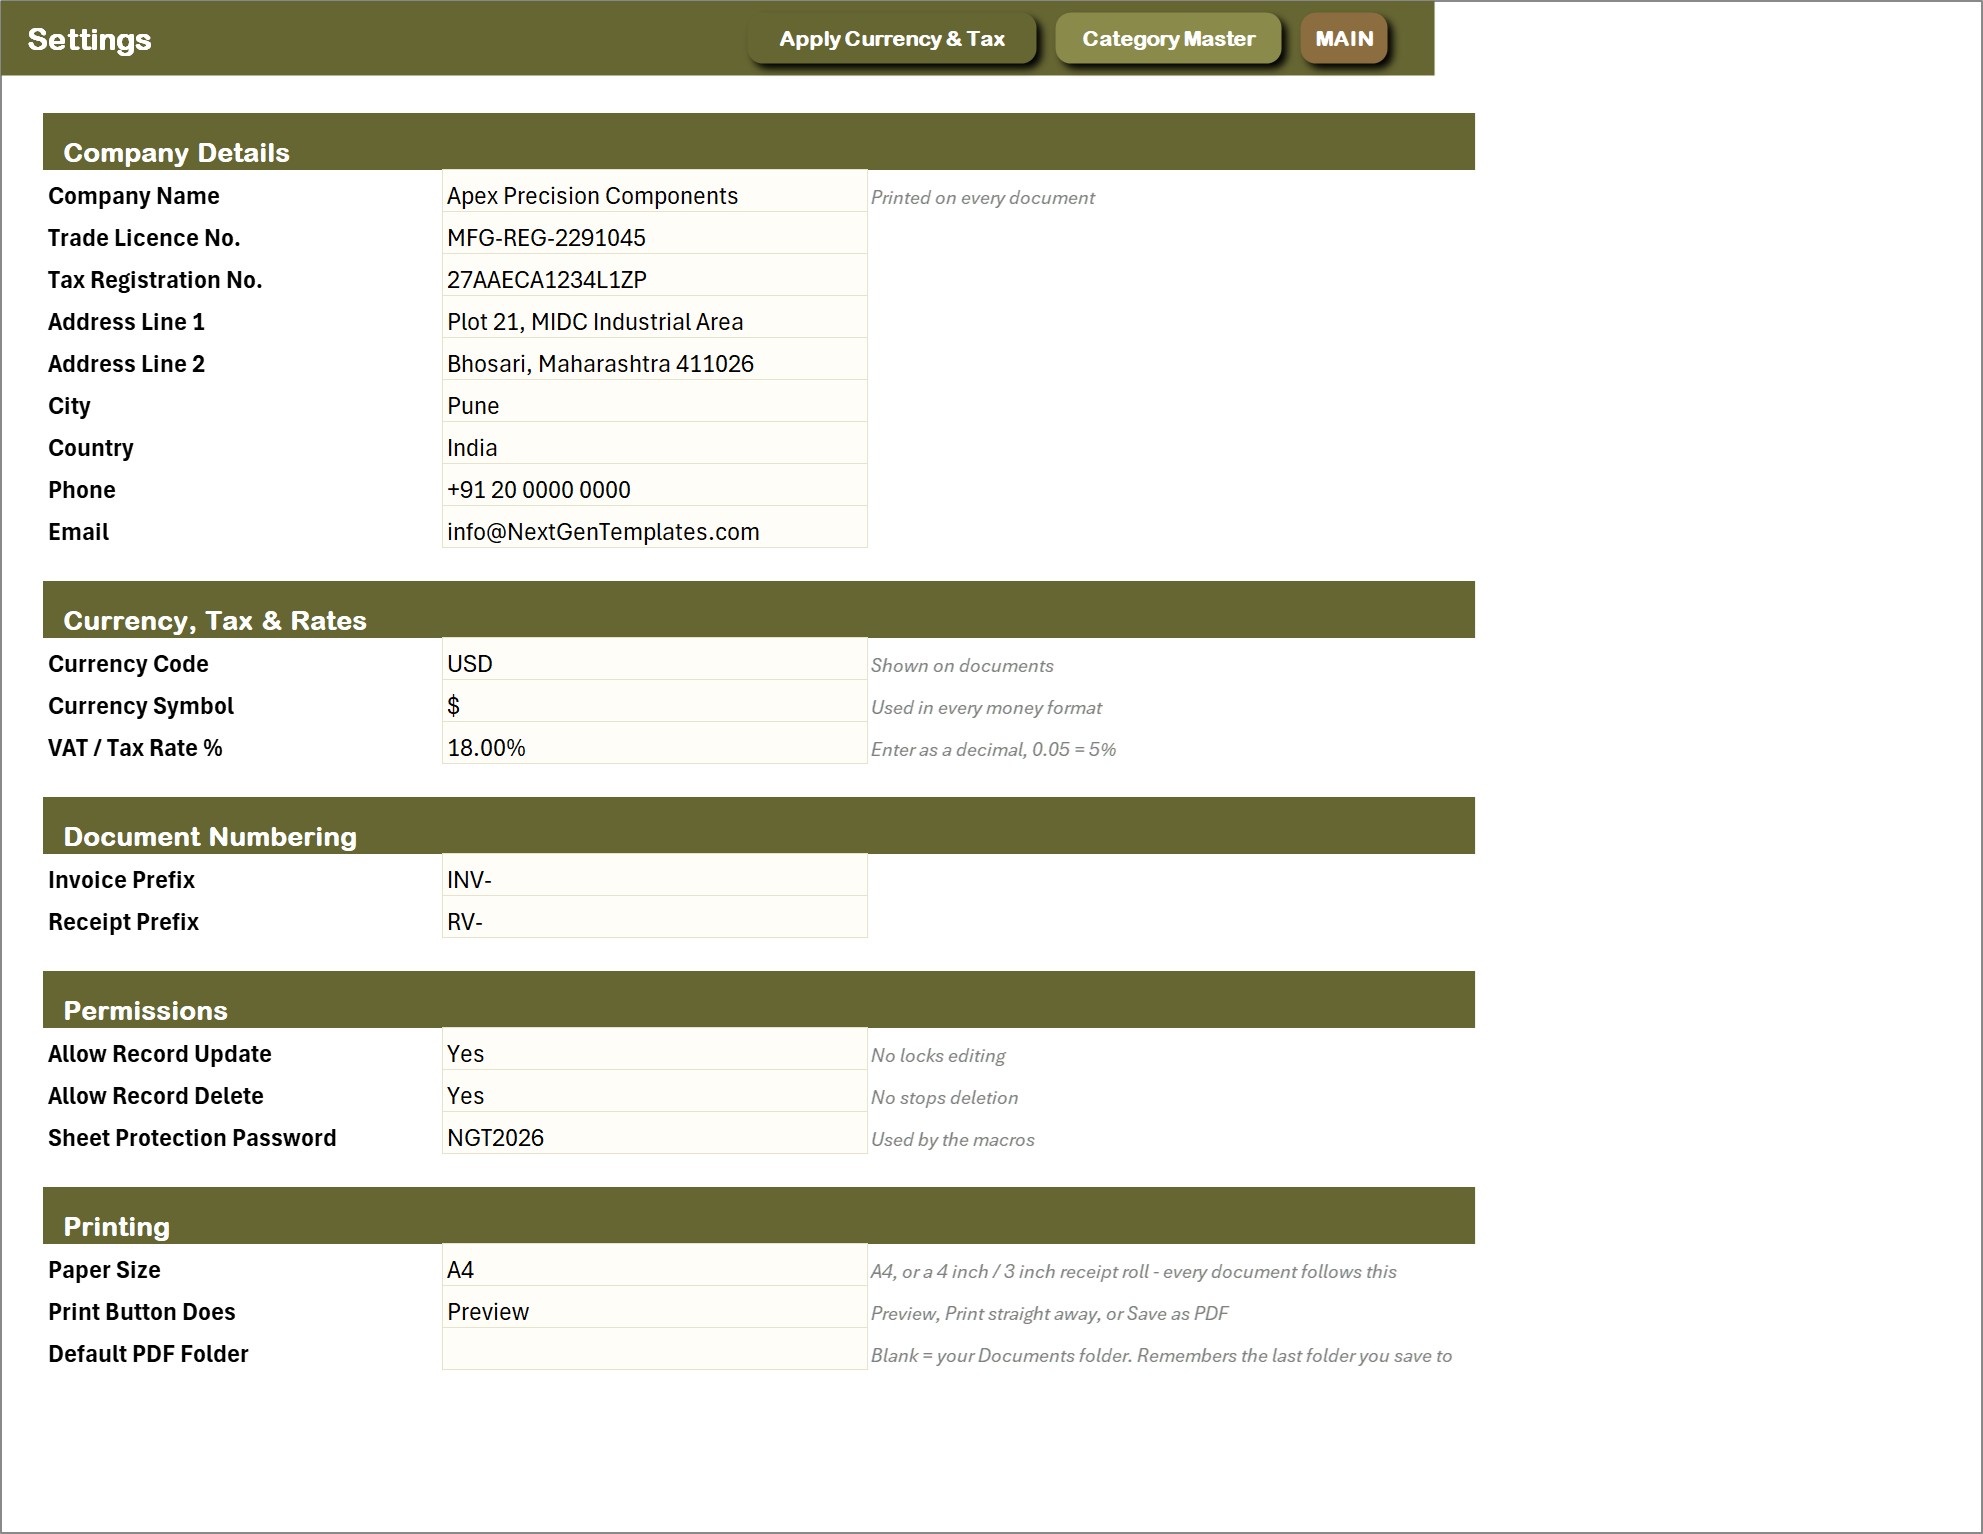
Settings
Company details printed on every document, currency and tax rate, document numbering, permissions to switch off editing or deleting, and printing defaults: paper size, whether the print button previews, prints or saves a PDF, and the default PDF folder.
Plant Production Planning and Control Management System vs. a Production Planning Spreadsheet vs. Cloud MRP / ERP – Feature Comparison
| Feature | This Excel VBA system | Plain production planning spreadsheet | Cloud MRP / ERP (Katana, MRPeasy, Odoo) |
|---|---|---|---|
| Cost | $29 one-time ✅ | Free to $20 one-time | Monthly subscription, often per user |
| Achievement %, scrap % and capacity use per order | Yes, by formula ✅ | Manual formulas | Yes ✅ |
| QC inspections linked to order and batch | Yes ✅ | No | Usually yes |
| Stock with reorder status | Yes, automatic ✅ | Manual | Yes ✅ |
| Machine service due and maintenance log | Yes ✅ | No | Depends on plan |
| Prints at A4, 4 inch and 3 inch | Yes ✅ | No | A4 / PDF |
| Bill of materials and MRP run | No | No | Yes ✅ |
| Several users at once | No | Only in Google Sheets | Yes ✅ |
| Works offline, data stays on your PC | Yes ✅ | Yes | No |
Who Should Use This Template
- Small and mid-size manufacturers, machine shops, component makers and job-work units with a handful of machines and lines
- Production managers who want achievement, scrap and capacity utilisation per order without building formulas
- Quality leads who need inspections, defect types and rework batches recorded against the real order
- Owners who want stock, dispatch invoices, expenses and a Profit & Loss in the same file as production
It is not the right tool if you need several people in the file at once, if you work on a Mac or in Excel for the web, or if your plant depends on bills of materials, MRP runs, finite-capacity scheduling or barcode terminals.
Real-World Use Cases
A 40-person auto-components machine shop. The production manager plans every order against a CNC lathe or milling machine, watches Planned vs Actual Units by Machine each week, and prints the production order on A4 for the operator. The Service Due flag warns him before a machine goes overdue.
A fastener plant’s quality desk. The quality lead logs each inspection against its batch, tags defects as burr, crack, diameter or surface finish, and sends rework batches back with a printed QC Inspection Report. The Quality Control Dashboard is the Monday review.
A small plastic moulding unit. The owner records purchases, issues granules to production with a Stock IN / OUT slip, and watches Low Stock before a line stops. Invoices print on a 3 inch printer at the dispatch gate, and the Profit & Loss shows what the month actually made.
Advantages of This Excel VBA Production Control System
- One file, one place. Production, quality, stock, dispatch, machines and money are connected, so a single order shows up in the dashboards, the stock and the P&L.
- Formulas you do not have to write. Achievement, scrap, capacity utilisation, stock in hand, gross profit and balance due are all calculated for you.
- Clean data by design. Forms check required fields, numbers and duplicates, dates come from a calendar, and read-only boxes cannot be typed over.
- Paperwork included. Five documents print at A4 or on 4 inch and 3 inch rolls straight from the registers.
- Yours to change. Categories, lines, defect types, statuses and more are master lists you edit from a form, and the full version’s VBA is unlocked.
- No subscription. One payment, no per-user fee, and your plant’s data never leaves your PC.
Opportunities for Improvement
- There is no bill of materials: material is issued to an order with a slip rather than exploded from a recipe.
- Scheduling is by dates and machine, not a finite-capacity Gantt plan.
- It is a single-user desktop workbook; there are permissions for editing and deleting but no separate user logins.
- It needs Excel for Windows with macros enabled; Mac, Excel for the web and mobile apps cannot run the forms.
Best Practices
- Set up masters first. Machines with their daily capacity, products with cost and selling price, and materials with reorder levels make every calculated column meaningful.
- Record actuals the same day. Achievement and capacity utilisation are only as fresh as the last update.
- Issue material against the order number. It keeps stock right and tells you what each order consumed.
- Log every maintenance job. The Service Due flag depends on it.
- Keep a dated backup. Save a copy each week before large changes.
Explore Relevant Templates
- CRM and Sales Pipeline Management System in Excel VBA – the same engine built for the sales desk.
- Manufacturing Business Plan Templates Kit – the business plan, forecasts and pitch deck for a manufacturing business.
- Flooring Materials Manufacturing Dashboard in Excel – an analytics dashboard for plants that already capture their data.
- Fire Safety Equipment Manufacturing Dashboard in Excel – another manufacturing dashboard built on pivot charts and slicers.
- VBA Management Systems Mega Pack – five complete Excel VBA systems in one bundle.
For writing your own forms and buttons, Microsoft’s Excel VBA reference is the official starting point.
Frequently Asked Questions
What does this manufacturing management system in Excel track?
Production orders, quality inspections, purchases, stock movements, raw material and finished goods stock, dispatch invoices, machines and maintenance, employees, suppliers, customers and expenses, with five dashboards and a live Profit & Loss statement on top.
Does it calculate achievement, scrap and capacity utilisation automatically?
Yes. Each production order works out good quantity, achievement %, scrap %, production days, capacity utilisation %, production cost and output value from what you enter and the machine’s daily capacity.
Does it handle a bill of materials or MRP?
No. Material is issued to an order with a Stock IN / OUT slip and raw material stock shows a Low Stock status against its reorder level, but there is no bill-of-materials explosion or MRP run.
What documents can I print?
Production Order, QC Inspection Report, Purchase Order, Tax Invoice and Material Issue / Receipt Slip, each at A4, 4 inch or 3 inch, from the register’s Print button or the Print Centre.
Can I stop staff editing or deleting records?
Yes. Allow Record Update and Allow Record Delete on the Settings sheet switch those actions off. There are no separate user logins – it is a single-user desktop workbook.
Does it work on Mac or Excel for the web?
No. The forms and printing are VBA, so it needs Microsoft Excel 2016 or later for Windows with macros enabled.
Can I try it before buying?
Yes. The 7-day free trial on the product page is the complete system; after 7 days it locks and offers the full version.
About the Author
Built by PK – Microsoft Certified Professional with 15+ years of Excel, Google Sheets and Power BI experience. Founder of NextGenTemplates, reaching 300K+ subscribers across YouTube channels (@PKAnExcelExpert, @NextGenTemplates, @NeoTechNavigators). Every template is hand-built and tested before release.
Conclusion
If your plant runs on a production planning spreadsheet, a stock book and an invoice pad, the Plant Production Planning and Control Management System brings them together in one Excel file: orders that measure themselves, quality tied to the batch, stock that moves on its own, machines that warn you before service is due, and paperwork that prints in three sizes. It is Excel VBA production management without a subscription: try it free for 7 days, then keep it for a one-time price.
Get the Plant Production Planning and Control System