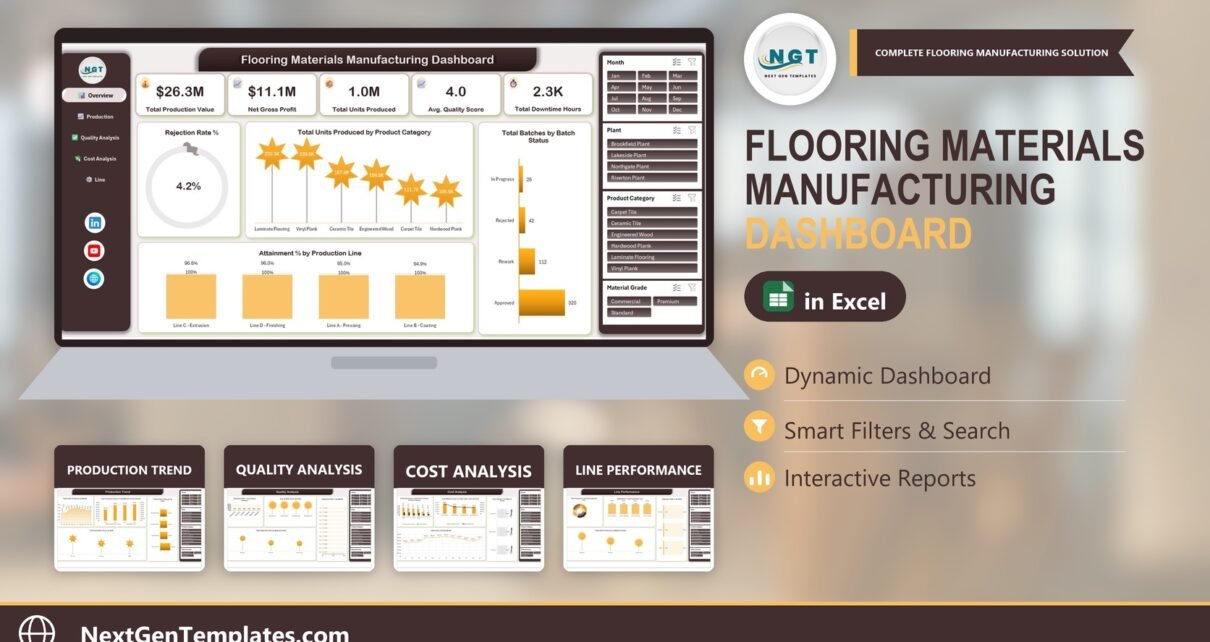
The Flooring Materials Manufacturing Dashboard in Excel turns 500 production batch records into 5 interactive dashboard pages with 5 KPI cards, 20 charts and 4 slicers. In the sample data it reports $26.3M of Total Production Value, $11.1M of Net Gross Profit, 1.0M Total Units Produced, an Avg. Quality Score of 4.0, 2.3K Total Downtime Hours and a 4.2% Rejection Rate.
Flooring plants make many similar products on shared lines — laminate, vinyl plank, ceramic tile, carpet tile, engineered wood and hardwood — and the batch log quickly becomes too big to read row by row. This flooring materials manufacturing dashboard answers the questions a plant review actually asks: which plant produced the most, which category rejects the most, which line missed its plan, and where material and labor costs are eating margin.
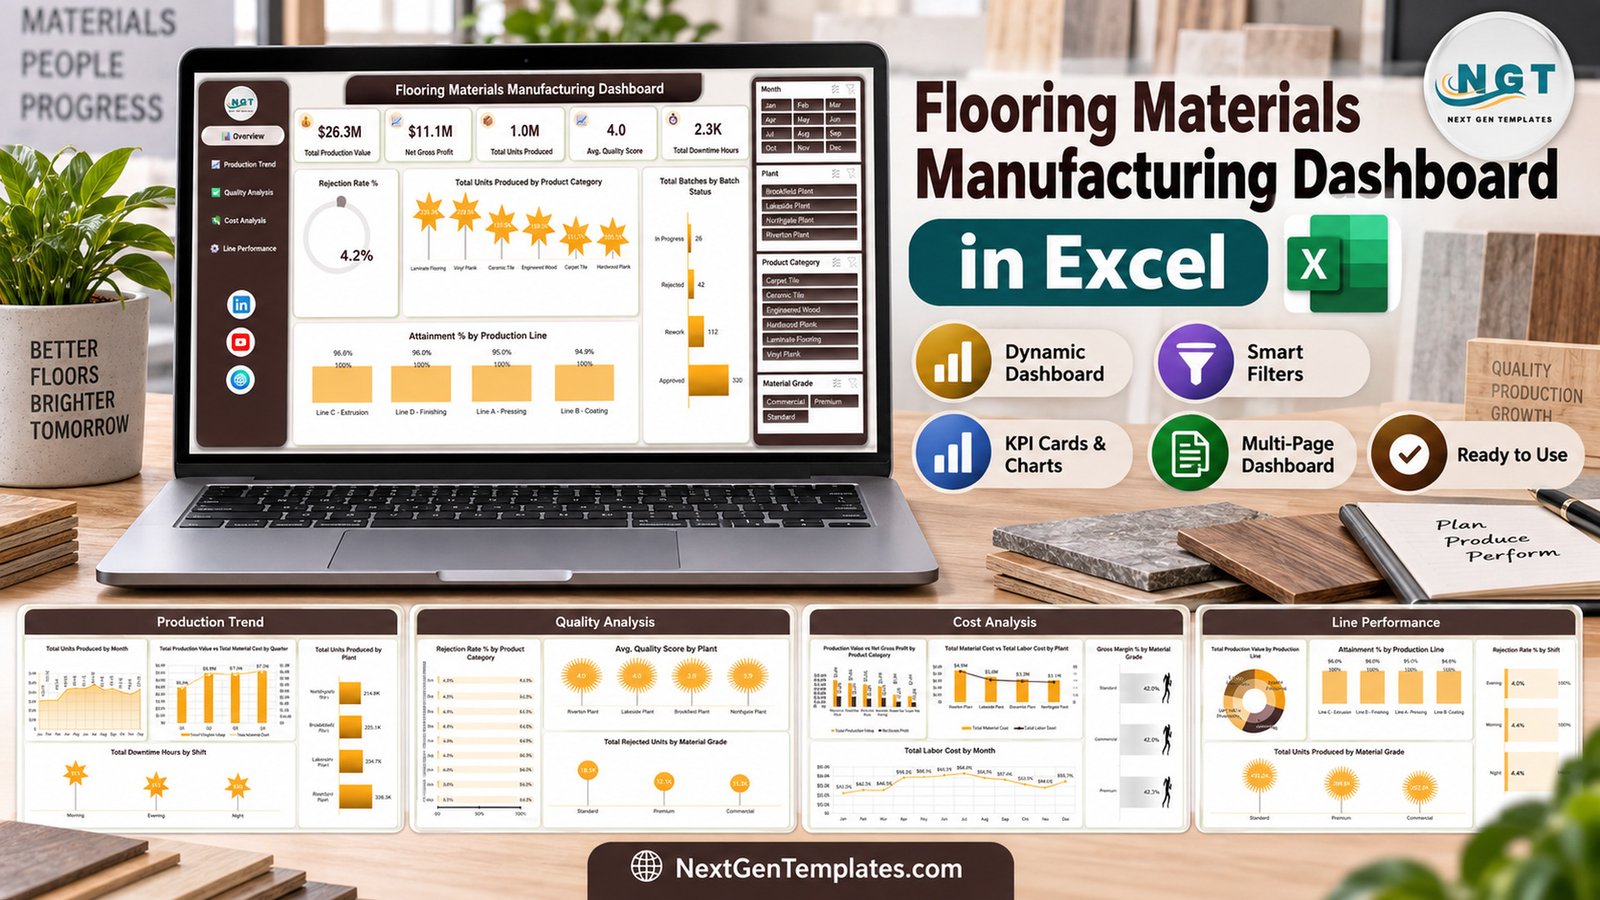
Key Features of the Flooring Materials Manufacturing Dashboard
- Five KPI cards: Total Production Value, Net Gross Profit, Total Units Produced, Avg. Quality Score and Total Downtime Hours sit at the top of the Overview page.
- Four slicers on every page: Month, Plant, Product Category and Material Grade filter all cards and charts on a page together.
- Calculated measures: Net Gross Profit equals Production Value minus Raw Material Cost, Labor Cost and Energy Cost. Rejection Rate % equals Units Rejected divided by Units Produced. Attainment % equals Units Produced divided by Planned Units. Gross Margin % divides gross profit by Production Value.
- Page navigation menu: a left-hand menu jumps between Overview, Production Trend, Quality Analysis, Cost Analysis and Line Performance.
- Structured data table: the Data sheet holds TblData with 29 columns, including Batch ID, Production Date, Plant, Production Line, Shift, Supervisor, Product Category, Product, Material Grade, Batch Status, Planned Units, Units Produced, Units Rejected, Machine Hours, Downtime Hours, Raw Material Cost, Labor Cost, Energy Cost, Production Value and Quality Score.
- No macros: the workbook uses an Excel table, PivotTables, PivotCharts and slicers only.
Dashboard Pages Explanation
1. Overview
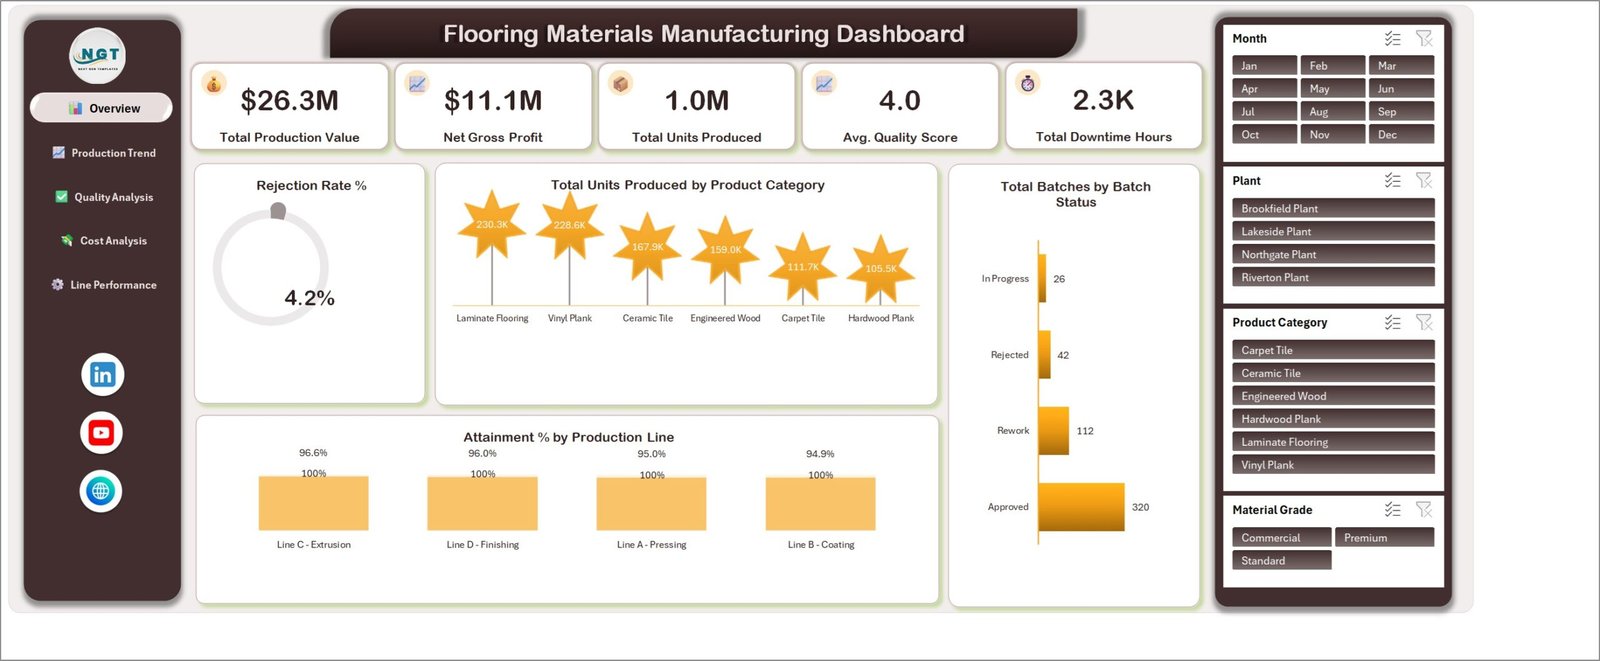
The Overview shows the five KPI cards, a Rejection Rate % ring (4.2% in the sample), Total Units Produced by Product Category (Laminate Flooring leads at 230.3K), Total Batches by Batch Status (320 Approved, 112 Rework, 42 Rejected, 26 In Progress) and Attainment % by Production Line, where the four lines range from 94.9% to 96.6%.
2. Production Trend
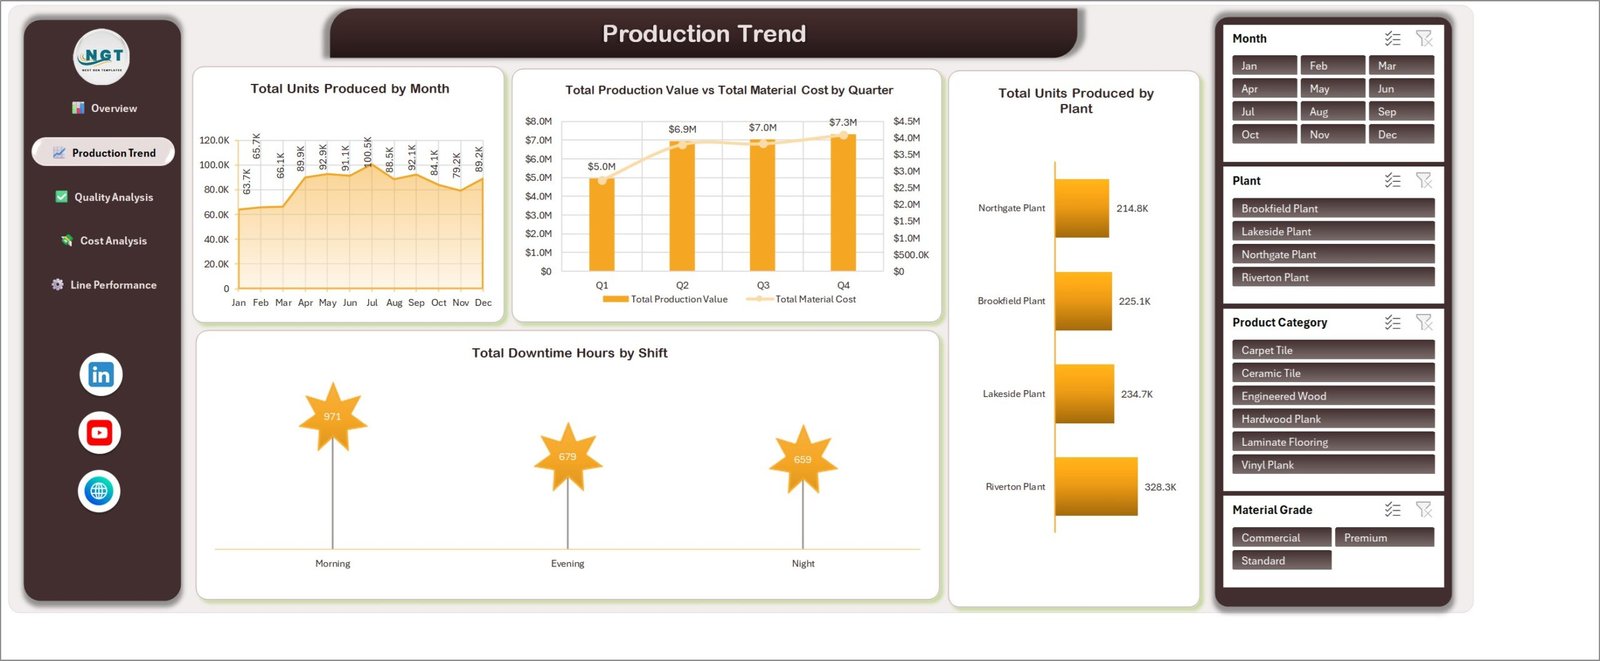
This page follows output over time and across sites: Total Units Produced by Month, Total Production Value vs Total Material Cost by Quarter, Total Units Produced by Plant (Riverton Plant is highest at 328.3K) and Total Downtime Hours by Shift, where the Morning shift logs 971 hours against 679 for Evening and 659 for Night.
3. Quality Analysis
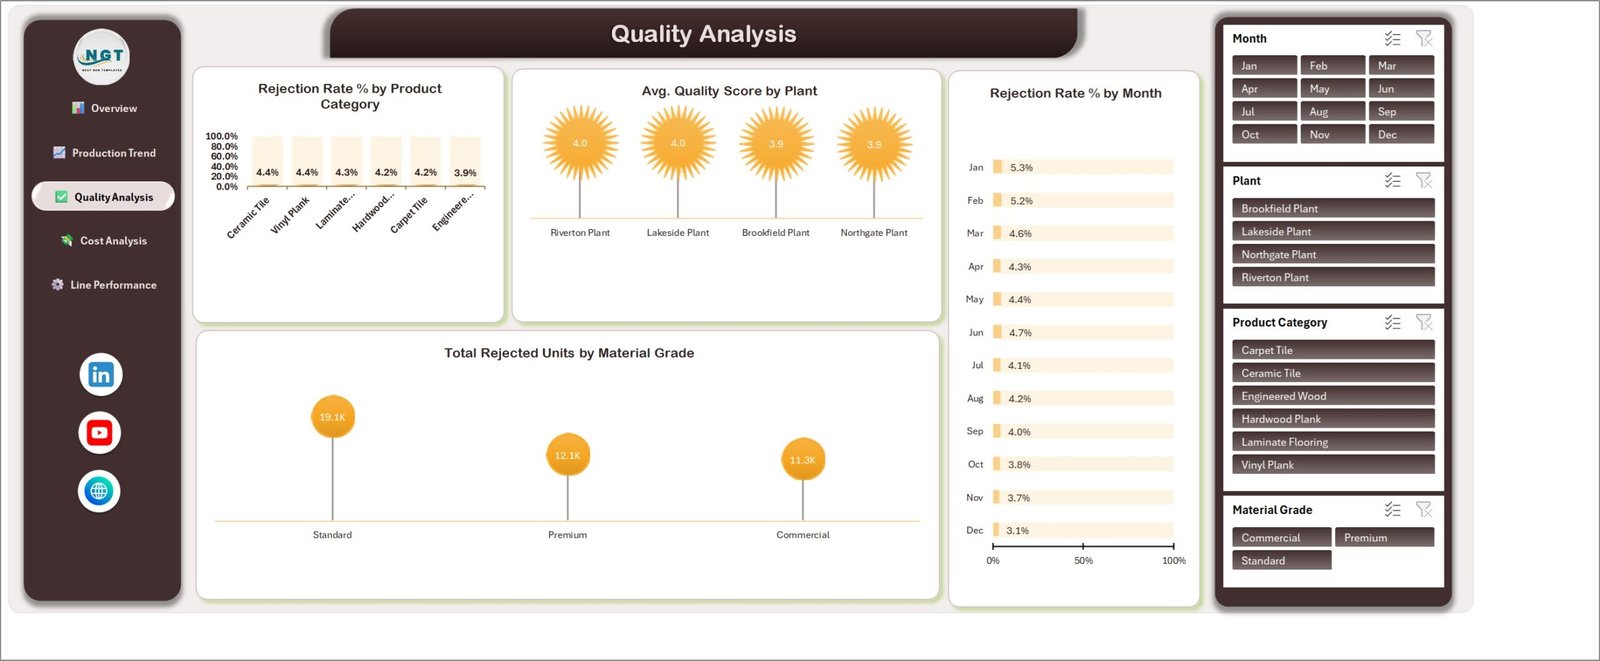
Quality Analysis combines Rejection Rate % by Product Category, Avg. Quality Score by Plant, Rejection Rate % by Month (falling from 5.3% in January to 3.1% in December in the sample) and Total Rejected Units by Material Grade, where Standard grade carries 19.1K rejected units.
4. Cost Analysis
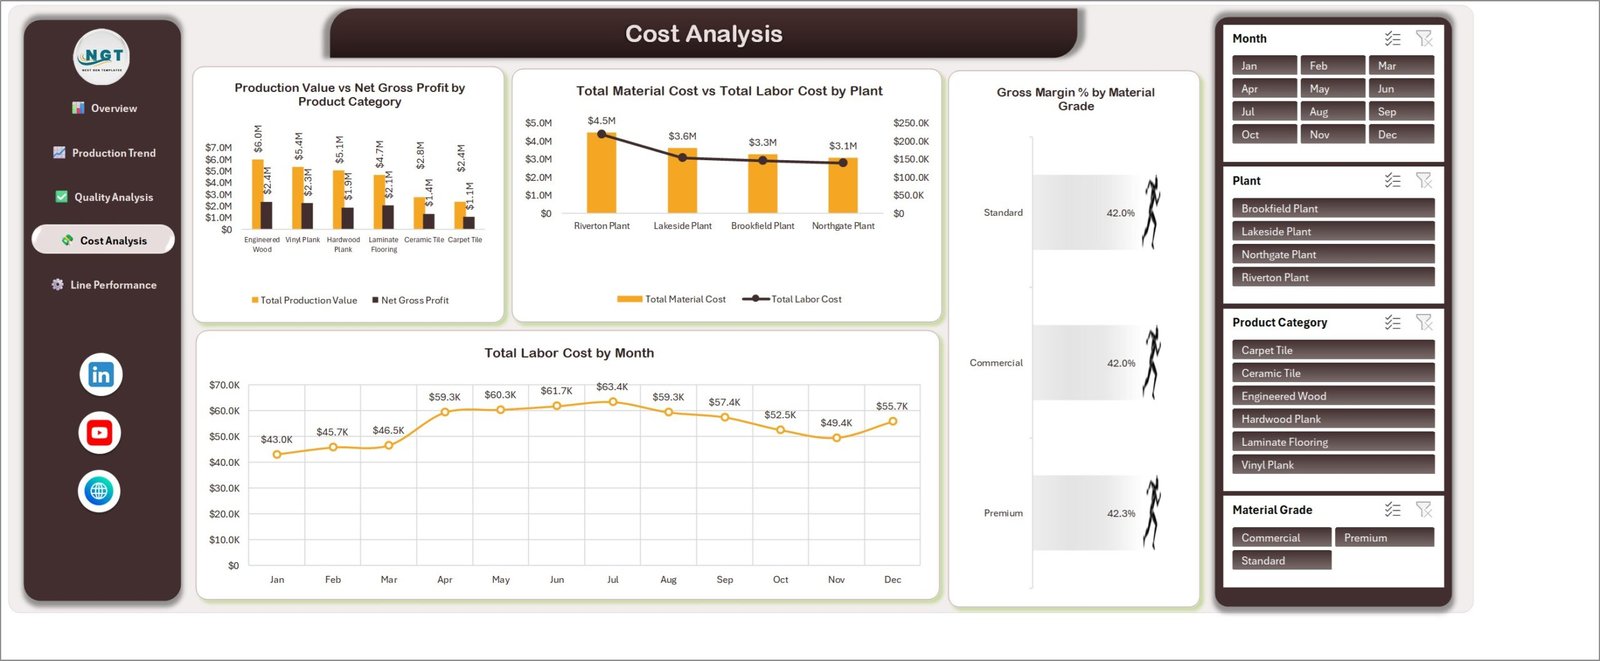
Cost Analysis places Production Value vs Net Gross Profit by Product Category next to Total Material Cost vs Total Labor Cost by Plant, Gross Margin % by Material Grade (42.0% to 42.3%) and Total Labor Cost by Month, which peaks at $63.4K in July.
5. Line Performance
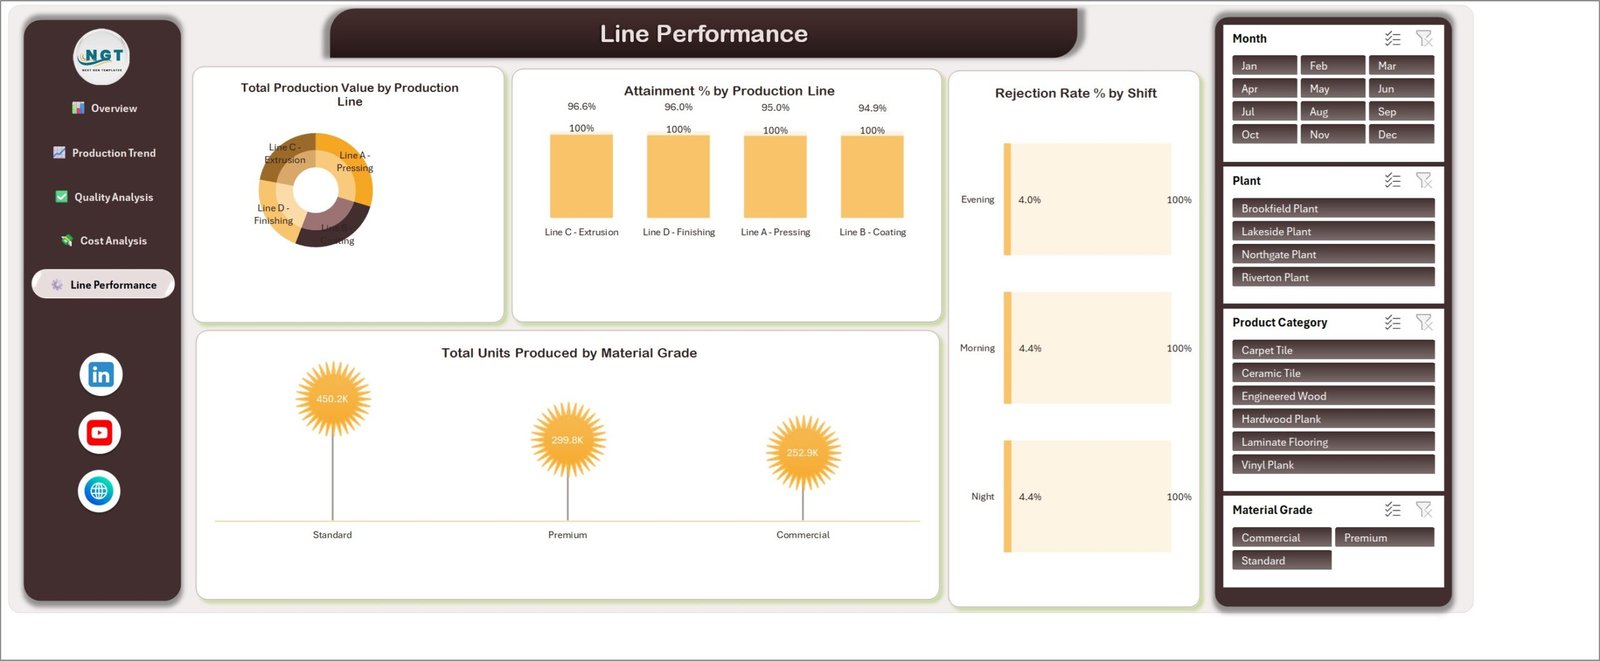
Line Performance compares Line A – Pressing, Line B – Coating, Line C – Extrusion and Line D – Finishing through Total Production Value by Production Line and Attainment % by Production Line, then adds Rejection Rate % by Shift and Total Units Produced by Material Grade.
Flooring Materials Manufacturing Dashboard vs. Google Sheets Build vs. Paid MES / ERP Analytics — Feature Comparison
| Feature | Flooring Materials Manufacturing Dashboard in Excel | Google Sheets equivalent (build it yourself) | Paid MES / ERP analytics module |
|---|---|---|---|
| Cost | ✅ One-time purchase | Free tool, but hours of build time | Recurring subscription, usually quote-based |
| Platform | ✅ Microsoft Excel (desktop) | Google Sheets in a browser | Vendor cloud or on-premise system |
| Setup time | ✅ Paste data, Refresh All | Days to design pivots and charts | Weeks of implementation |
| Real-time team collaboration | OneDrive / SharePoint co-authoring | ✅ Built in | ✅ Built in |
| Mobile access | Excel mobile app (view) | ✅ Sheets app | ✅ Vendor app |
| Customizable fields | ✅ Full access | ✅ Full access | Vendor configuration only |
| Share with link | OneDrive link | ✅ Native | User licences required |
| Year-1 cost at 5 users | ✅ One payment, no per-user fee | Your build time | Per-user licence fees |
| Flooring quality, cost and line pages | ✅ Ready on day one | You design them | Generic manufacturing reports |
| Live machine data feed | No — manual refresh | No | ✅ Yes |
For flooring plants that want clear production, quality and cost reporting without a full MES rollout, the Flooring Materials Manufacturing Dashboard in Excel sits in the sweet spot.
Who Should Use This Template
Perfect for:
- Plant managers at laminate, vinyl plank, ceramic tile, carpet tile and wood flooring factories
- Quality leads who report rejection rate and quality score by plant, category and shift
- Cost controllers comparing material cost, labor cost and gross margin across plants
- Operations analysts who already export batch logs from their production system to Excel
Not a fit if:
- You need live sensor, OEE or MES data flowing in automatically
- You need inventory, purchasing or sales order management rather than production analysis
Real-World Use Cases
Maria runs two laminate and vinyl plank lines. Every Monday she pastes the previous week’s batches into the Data sheet, refreshes, and opens Line Performance to check which line fell below plan on Attainment % and which shift shows the highest Rejection Rate %. The weekly production meeting now starts from one screen instead of a raw export.
David leads quality at a ceramic tile plant. He filters Quality Analysis to Ceramic Tile and the Premium grade, compares Rejection Rate % by Month with Avg. Quality Score by Plant, and brings the chart to the monthly quality review.
Aisha is cost controller for a four-plant flooring group. Before each quarter close she uses Cost Analysis to compare Total Material Cost vs Total Labor Cost by Plant and Gross Margin % by Material Grade, then drills into a single plant with the Plant slicer.
Advantages of the Flooring Materials Manufacturing Dashboard
- One view of output, quality and cost: five pages cover production, rejection, margin and line attainment from a single batch table.
- Consistent filtering: the same four slicers appear on every page, so a filtered view reads the same way everywhere.
- No formula writing: gross profit, rejection rate, attainment and gross margin are already calculated.
- Easy to extend: because it is built on PivotTables, you can add your own PivotChart from the same data. Microsoft explains the basics in Create a PivotTable to analyze worksheet data.
- Low cost: a one-time purchase with no per-user subscription.
Opportunities for Improvement
- No refresh on open: after pasting new data you must click Data > Refresh All, otherwise the pages keep showing the previous figures.
- Attainment bars are hard to compare: Attainment % by Production Line draws each line against a 100% target, so values between 94.9% and 96.6% look almost identical; read the data labels.
- Thin rejection bars: the Rejection Rate % charts use a 0-100% axis, so rates around 4% show as very short bars.
- Crowded donut labels: on Total Production Value by Production Line, the line labels overlap the ring at default size.
- Energy Cost has no chart of its own: it feeds Net Gross Profit and Gross Margin % but is not charted separately.
- No live data connection: the dashboard analyses pasted batch data and does not connect to machines or an MES.
Best Practices
- Keep the TblData column headers unchanged and paste new rows inside the table so the PivotTables expand with it.
- Record Planned Units for every batch; without it Attainment % cannot be calculated.
- Use consistent names for plants, lines and product categories so slicers do not show duplicates.
- Clear all slicers before copying a chart into a management report, or note the filter you applied. Microsoft’s guide to using slicers to filter data covers multi-select and clearing filters.
- Replace the fictional sample data completely before sharing results.
Explore Relevant Templates
- Ceramic Tiles Production Dashboard in Excel — a production dashboard focused on ceramic tile output.
- Digital Twins in Manufacturing Dashboard in Excel — another manufacturing analytics workbook.
- Flooring Installation KPI Dashboard in Excel — a different template: a KPI dashboard for flooring installation businesses rather than factories.
- Running a whole plant? See the Plant Production Manager Toolkit on NextGenTemplates.
Frequently Asked Questions
What does the Flooring Materials Manufacturing Dashboard track?
The Flooring Materials Manufacturing Dashboard tracks Total Production Value, Net Gross Profit, Total Units Produced, Avg. Quality Score and Total Downtime Hours, plus Rejection Rate %, Attainment % and Gross Margin %, filtered by month, plant, product category and material grade across five pages.
How long does setup take?
Setup is quick. Paste your batch records into the TblData table on the Data sheet with the same headers and click Data > Refresh All. The Flooring Materials Manufacturing Dashboard does not refresh automatically when the file opens, so refresh after every data change.
Do I need macros or Power BI?
No. This flooring production template is a standard .xlsx workbook built from an Excel table, PivotTables, PivotCharts and slicers. It needs no macros, add-ins or Power BI. Desktop Excel is recommended for the best slicer experience.
How does this compare to a paid MES analytics module?
An MES connects directly to machines and usually carries recurring licence fees. This flooring production template is a one-time purchase that analyses the batch data you paste in, which suits plants wanting clear reporting without a system rollout.
Can I use my own plants and product categories?
Yes. Plant, Production Line, Shift, Product Category and Material Grade are plain text columns. Enter your own names, refresh, and the slicers and charts of this flooring production template update to show them.
Is the sample data real?
No. The 500 batches, plant names and supervisors in this flooring production template are fictional sample data for demonstration. Replace them with your own records before drawing conclusions.
About the Author
Built by PK — Microsoft Certified Professional with 15+ years of Excel, Google Sheets, and Power BI experience. Founder of NextGenTemplates, reaching 300K+ subscribers across YouTube channels. Every template is hand-built and tested before release.
Conclusion
This flooring production template gives flooring plants a clear, filterable view of production, quality, cost and line performance from one batch table — without a subscription or a system rollout.
👉 Click here to Purchase this flooring production template
✅ Instant download · One-time payment · No subscription
🎥 Watch more tutorials: Youtube.com/@PKAnExcelExpert
Last updated: September 2026