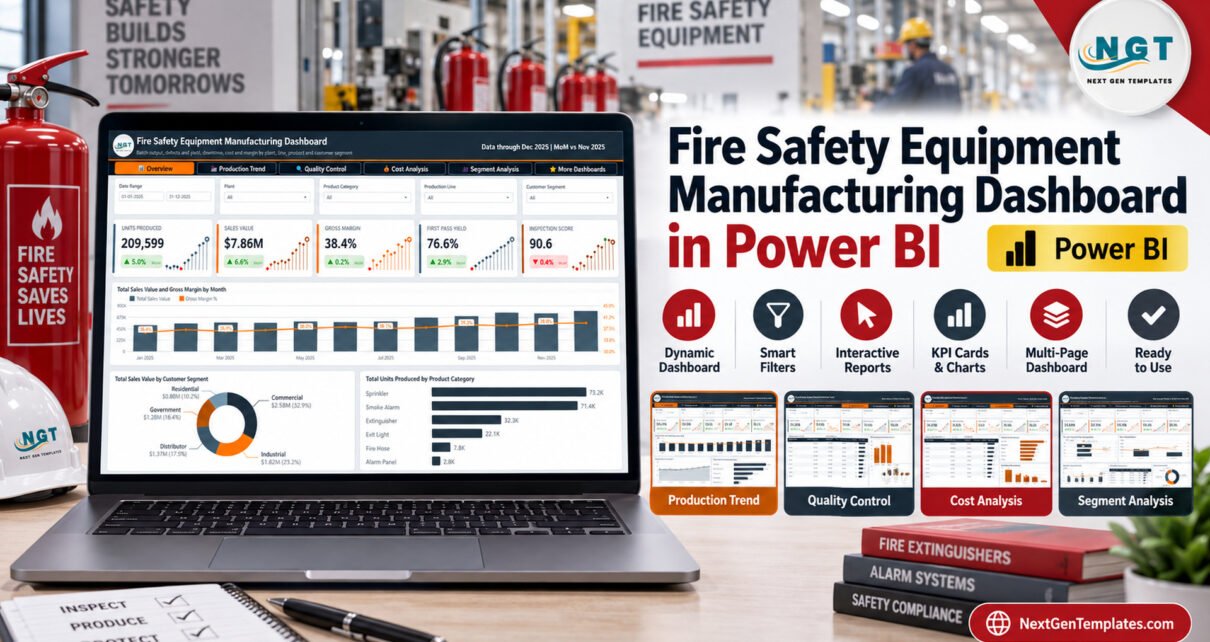
The Fire Safety Equipment Manufacturing Dashboard in Power BI is a five-page reporting template for manufacturers of extinguishers, alarm panels, sprinklers, smoke alarms, fire hoses and exit lights. Its sample model contains 500 batch records and demonstrates 209,599 units produced, $7.86M sales value, 38.4% gross margin, 76.6% first-pass yield and a 90.6 inspection score. Those figures are sample data, not performance benchmarks. The purpose of the report is to give production, quality and finance teams a structured starting point for analyzing their own batch records without building every page from a blank PBIX.
Download the Fire Safety Equipment Manufacturing Dashboard in Power BI. The ZIP includes the editable PBIX, sample Data.xlsx and a Power BI dashboard user manual PDF.

Key Features of Fire Safety Equipment Manufacturing Dashboard in Power BI
The report is organized around the questions plant and business teams regularly ask: How much was produced? Where did downtime rise? Which product categories show more defects? What did production cost? Which plants and customer segments contribute the most value?
- Five analysis pages: Overview, Production Trend, Quality Control, Cost Analysis and Segment Analysis.
- Page-specific slicers: filter by date, plant, product category, production line, shift, supervisor, batch status, customer segment or certification where those fields apply.
- Production cards: track total batches, units produced, average batch size, downtime hours and downtime per batch.
- Quality cards: review units tested, defective units, defect rate, first-pass yield and rework rate.
- Commercial measures: analyze sales value, revenue per unit, average batch value, production cost, gross profit, gross margin and cost per unit.
- Editable Power BI file: adapt pages, model fields, measures, colors and source connections in Power BI Desktop.
This is a reporting layer, not an MES, MRP, ERP or inspection-management application. It does not capture shop-floor events automatically and it does not certify equipment.
Dashboard Pages Explanation
1. Overview
The opening page summarizes units, sales, margin, first-pass yield and inspection score. The monthly chart places sales value beside gross margin, while the lower visuals compare customer segments and equipment categories. In the sample data, categories include sprinklers, smoke alarms, extinguishers, exit lights, fire hoses and alarm panels.
2. Production Trend
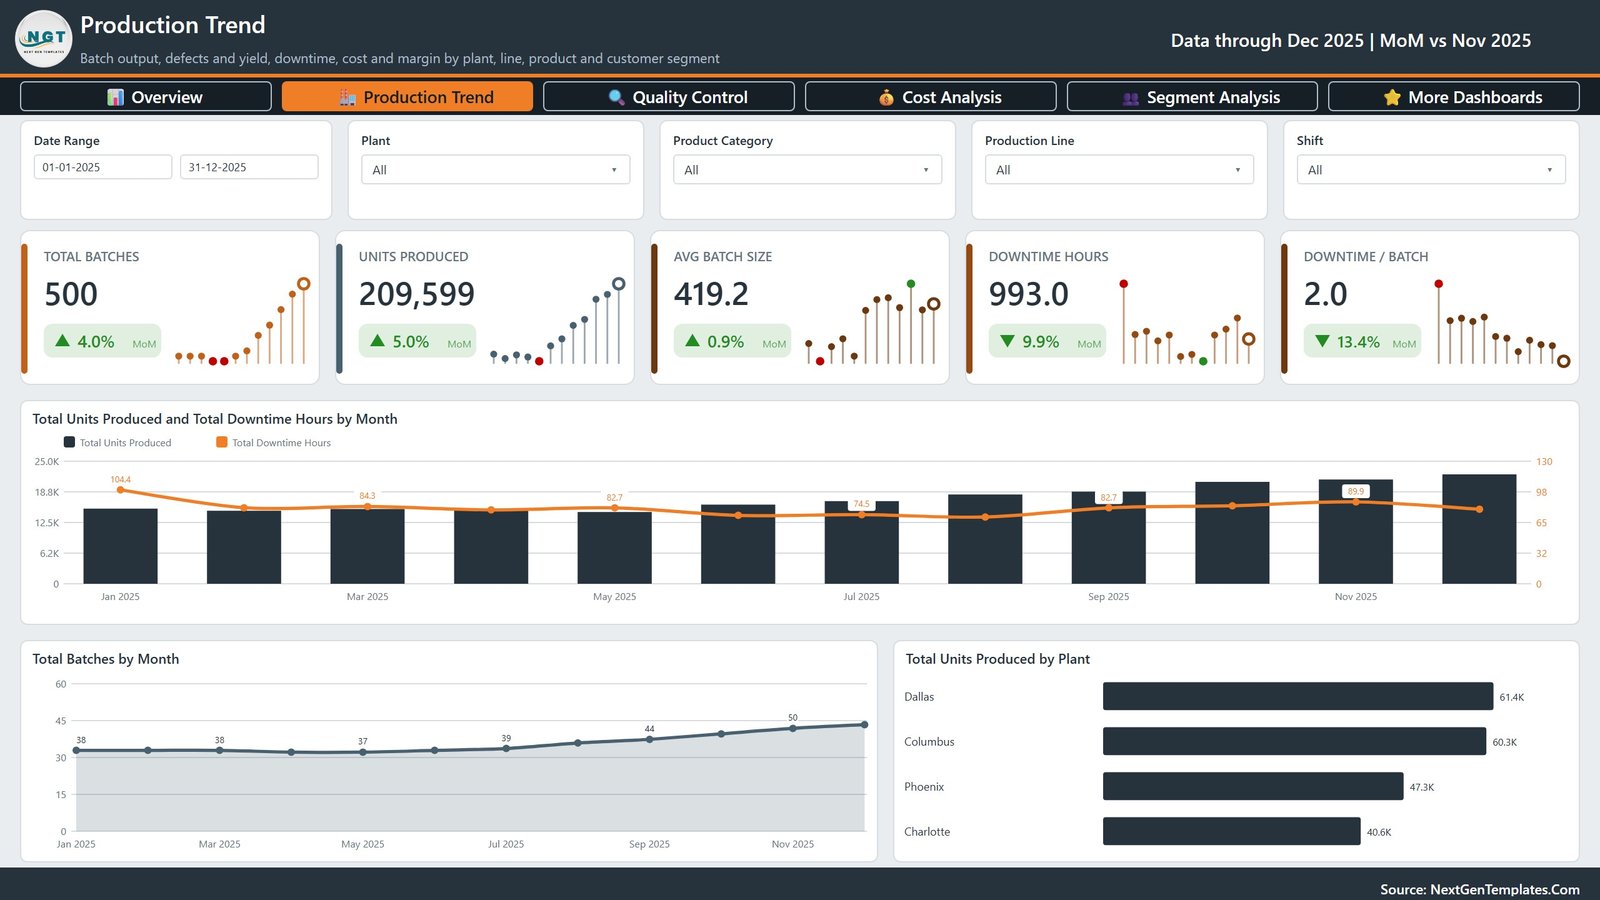
The Production Trend page focuses on batch flow and downtime. Its headline cards show 500 sample batches, 209,599 units, 419.2 average batch size, 993 downtime hours and 2.0 downtime hours per batch. Monthly visuals make it easier to see whether output and downtime moved together, while plant bars compare sample locations.
3. Quality Control
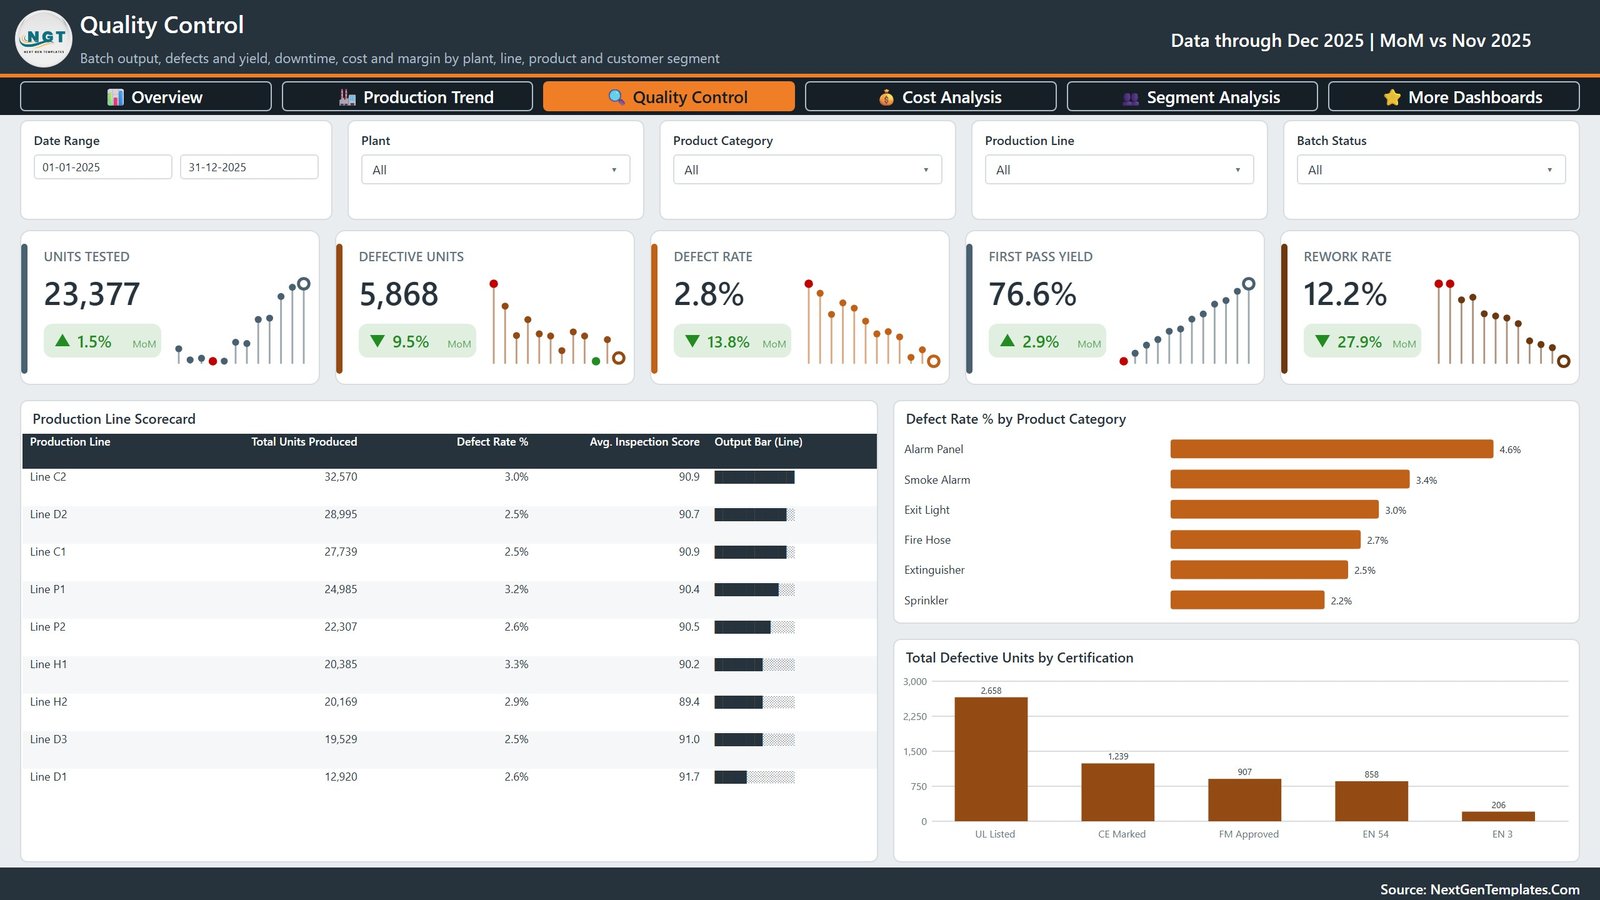
The Quality Control page brings units tested, defective units, defect rate, first-pass yield and rework rate into one view. A line scorecard adds output and inspection-score context, while product-category and certification charts support deeper review. Certification names shown in the report are fields from the sample dataset. They are not validation by the template author.
4. Cost Analysis
The Cost Analysis page connects operational volume with production economics. Cards display production cost, gross profit, gross margin, cost per unit and average batch value. The page compares sales and margin by product category, material and labor cost by quarter, and profitability by plant.

5. Segment Analysis
The Segment Analysis page compares Commercial, Industrial, Distributor, Government and Residential sample customers. It reports units, sales, revenue per unit, average batch value and gross margin, then breaks down units by the certification labels contained in the data.

Fire Safety Equipment Manufacturing Dashboard in Power BI vs. Excel vs. Paid MES/SaaS – Feature Comparison
| Feature | This Power BI template | Excel dashboard | Paid MES/SaaS |
|---|---|---|---|
| Primary role | Interactive analytical reporting | Spreadsheet-based reporting | Operational execution and integrated reporting |
| Template price | One-time $17.99 sale price | Varies by workbook | Usually subscription plus implementation |
| Setup | Map or replace structured source data | Paste/import data into workbook structure | Configuration and integration project |
| Team sharing | Power BI Service requires appropriate licensing | File or Microsoft 365 sharing | Usually included by plan |
| Machine/ERP integration | Not included | Not included | May be available |
| Compliance evidence | No | No | Depends on validated implementation |
| Year-1 cost for 5 users | $17.99 plus Microsoft licensing | Template plus Microsoft licensing | Vendor-specific |
Who Should Use This Template
It suits production managers who need a repeatable monthly plant review; quality leads comparing defects, yield and rework; cost analysts placing production cost beside margin; operations directors comparing plants and production lines; and Power BI consultants building a faster first version for a fire-safety equipment manufacturer.
It is not suitable when the requirement is barcode scanning, work-order execution, preventive maintenance, stock control, automated sensor feeds, certification issuance or audit-ready regulatory evidence. Those needs require operational systems and properly governed processes beyond a visualization template.
Real-World Use Cases
Monthly plant performance review
A plant manager can filter one date range and compare units, downtime and cost across facilities before the operations meeting.
Quality improvement discussion
A quality lead can identify product categories or lines with higher defect rates, then investigate the source records outside the dashboard.
Customer-segment profitability review
A commercial analyst can compare sales, units, average batch value, revenue per unit and margin across customer segments.
Advantages of This Power BI Manufacturing Dashboard
- Starts with five completed report pages instead of a blank canvas.
- Connects production, quality, cost and customer views in one PBIX.
- Uses visible filters and clear KPI cards for guided analysis.
- Includes an Excel sample-data file for understanding the expected structure.
- Can be adapted in Power BI Desktop without buying a separate dashboard subscription.
Opportunities for Improvement
The template intentionally stays within reporting. A future implementation may add your own targets, exception thresholds, work-order links, inventory measures, scheduled refresh, role-level security or governed certification master data. These are not included out of the box and should be designed around your systems and controls.
You may also extend the model with planned-versus-actual production, scrap cost, supplier performance, warranty returns, order backlog or maintenance downtime when those fields exist in a trusted source. Additions should be modeled deliberately instead of typed into visual-level calculations without documentation. For shared deployments, define who owns each measure, how often the source refreshes and which users may see plant, customer or financial details. A dashboard becomes more useful when every number has an agreed definition and an accountable data owner.
Before rollout, test the report with a controlled copy of your data and reconcile cards, tables and charts to source-system totals. Document transformations in Power Query, record any measure changes, and keep the sample workbook as a reference rather than mixing demo rows with live records. If different plants use different definitions for a batch, defect, rework event or inspection score, standardize those definitions first. Consistent business rules matter more than visual polish when the report supports management decisions.
Best Practices
- Define every KPI and unit before loading your own data.
- Keep plant, line, product, customer and certification labels consistent.
- Validate source totals against your approved operational reports.
- Separate sample data from production data during testing.
- Use Power Query steps that can be refreshed repeatedly rather than manual edits.
- Review Microsoft guidance for Power Query in Power BI Desktop.
- Restrict Power BI Service access according to your organization’s data policy.
Explore Relevant Templates
- Digital Twins in Manufacturing Dashboard in Power BI
- ERP Systems Dashboard in Power BI
- Fire Safety Services KPI Dashboard in Excel
Frequently Asked Questions
What is included in the download?
The ZIP contains the editable PBIX, sample Data.xlsx and a Power BI dashboard user manual PDF.
Are the figures in the screenshots real company results?
No. They are sample values provided to demonstrate the report.
Can I use my own data?
Yes. Map your structured data to the expected fields or update Power Query and the model.
Does the report prove UL, CE, FM or EN compliance?
No. Those are sample-data labels. The dashboard does not test products or provide certification evidence.
Does it include direct ERP or machine integration?
No. Integration work is separate and depends on the source system.
Can the report be shared online?
You can publish through Power BI Service if you have the appropriate Microsoft licensing, permissions and data governance.
Is Power BI Desktop free?
Microsoft offers Power BI Desktop as a free Windows application; service sharing and some features may require paid licensing.
About the Author
Built by PK – Microsoft Certified Professional with 15+ years of Excel, Google Sheets, and Power BI experience. Founder of NextGenTemplates, reaching 300K+ subscribers across YouTube channels. Every template is hand-built and tested before release.
Conclusion
This five-page Power BI manufacturing dashboard gives teams a ready structure for production, quality, cost and segment analysis. Its strongest value is speed: the pages, cards, slicers and visuals already exist, while the PBIX remains editable for your own model. Treat it as a reporting accelerator, validate every measure against your definitions, and keep certification and compliance decisions in the systems and processes that formally own them.
Get the editable Power BI dashboard and replace the sample records with your own manufacturing data.
For more tutorials, visit PK: An Excel Expert on YouTube.