A freelancer working across three platforms pays three different commissions on the same hour of work. Contra takes 5.0%. Upwork and Freelancer take 10.0%. Guru takes 9.0%, Toptal 15.0%, and Fiverr 20.0%. On a $1.3M book of business that spread is worth $154.9K – and no marketplace will ever show it to you, because showing it means admitting a competitor is cheaper.
The Freelance Marketplaces Dashboard in Excel is a five-page workbook built to answer that one question and the several that follow it: which platform actually pays, which service category delivers on time, and which client type is worth chasing. It ships with 500 sample project records already loaded, so every chart works the moment you open it. This post walks through all five pages, what each chart shows, and where the template stops being the right tool.
Key Features of the Freelance Marketplaces Dashboard in Excel
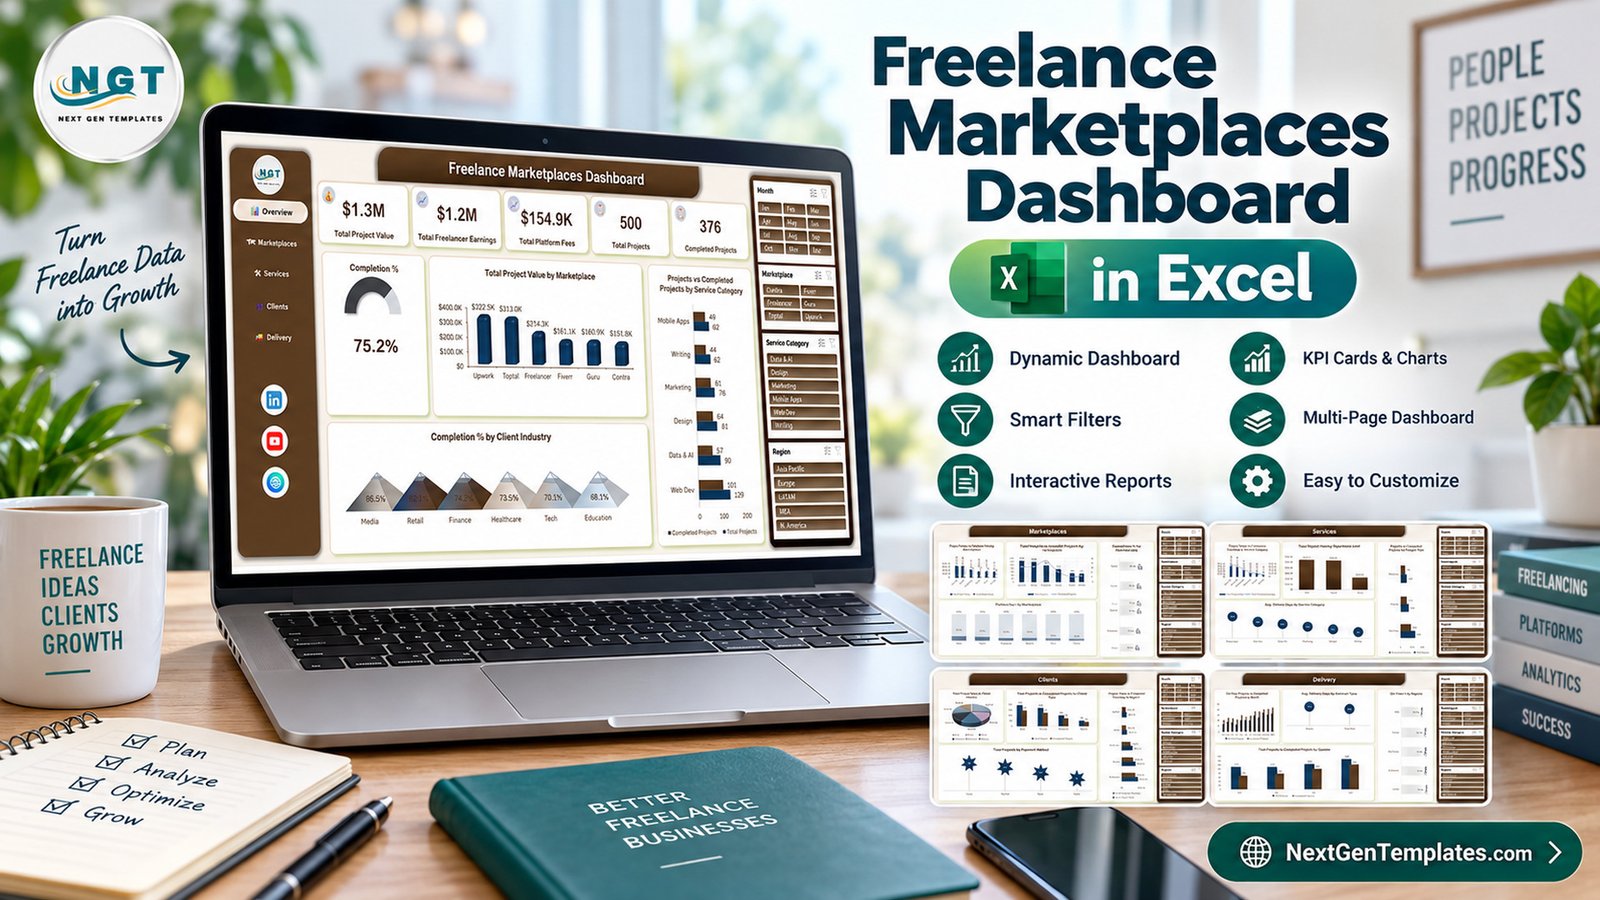
- Five report pages linked by a sidebar menu that stays put – Overview, Marketplaces, Services, Clients, Delivery.
- Four slicers on every page – Month, Marketplace, Service Category and Region – so a single click refilters the whole workbook.
- Six marketplaces side by side: Upwork, Fiverr, Freelancer, Toptal, Guru and Contra.
- Platform fee percentage and fee dollars charted separately, because a 20% fee on a small book costs less than 10% on a large one.
- Delivery analysis across month, quarter, region and contract type.
- Standard .xlsx, no macros, Excel 2016+ or Microsoft 365, Windows or Mac.
- PDF user manual in the download, covering column definitions and formulas.
Dashboard Pages Explanation
Page 1 – Overview
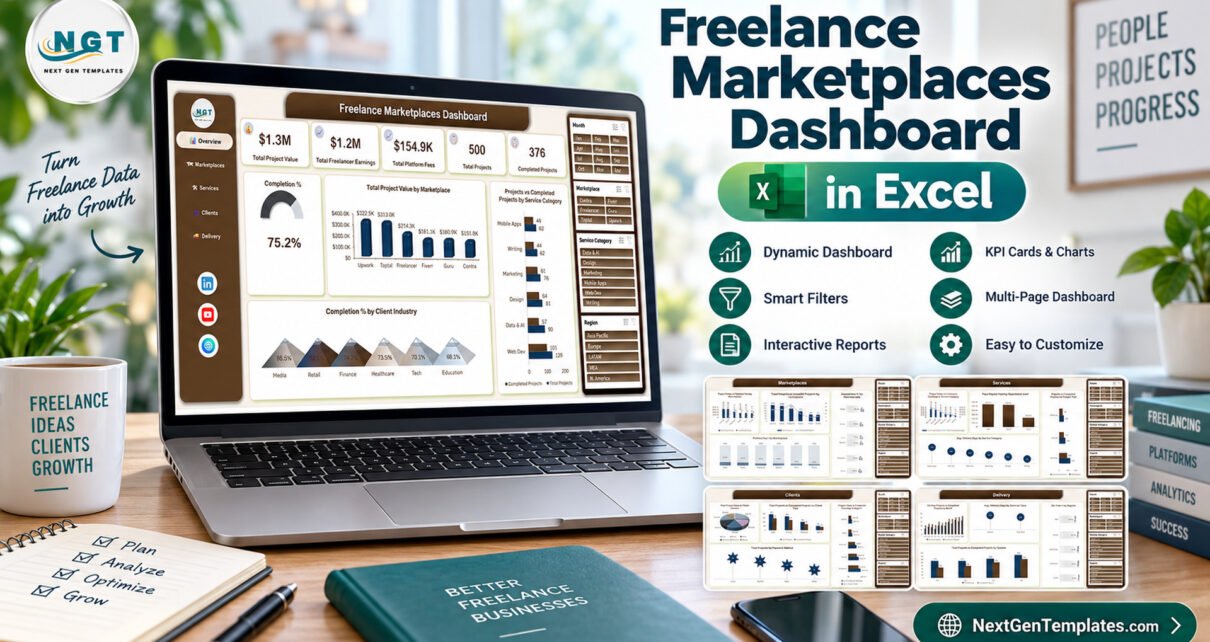
Five KPI cards run across the top: Total Project Value $1.3M, Total Freelancer Earnings $1.2M, Total Platform Fees $154.9K, Total Projects 500 and Completed Projects 376. A Completion % gauge reads 75.2%.
Underneath, Total Project Value by Marketplace ranks the six platforms – Upwork $322.5K, Toptal $313.0K, Freelancer $214.3K, Fiverr $161.1K, Guru $160.9K and Contra $151.8K. Projects vs Completed Projects by Service Category pairs volume against delivery for Web Dev, Data & AI, Design, Marketing, Writing and Mobile Apps. Completion % by Client Industry runs from Media at 86.5% down through Retail 82.1%, Finance 74.2%, Healthcare 73.5%, Tech 70.1% and Education at 68.1%.
Page 2 – Marketplaces
This is the page that justifies the template. Project Value vs Platform Fees by Marketplace puts the two bars next to each other: Toptal returns $313.0K but surrenders $47.0K, while Freelancer returns $214.3K and surrenders only $21.4K. Total Projects vs Cancelled Projects by Marketplace overlays a cancellation line on project counts – Upwork 124, Fiverr 116, Freelancer 94, Guru 71, Toptal 48, Contra 47. Completion % by Marketplace ranks reliability from Toptal at 85.4% to Fiverr at 69.0%, and Platform Fee % by Marketplace states the headline rate for each.
Page 3 – Services
Project Value vs Freelancer Earnings by Service Category shows Web Dev at $413.6K leading Data & AI at $370.1K, Mobile Apps $242.4K, Marketing $132.9K, Design $110.3K and Writing $54.3K. Total Project Value by Experience Level is the surprise on this page: Mid sits at $555.1K, ahead of Expert at $526.4K, with Entry at $242.0K. Projects vs Completed Projects by Project Type splits Milestone, Ongoing and One-Time work, and Avg. Delivery Days by Service Category runs from Mobile Apps at 25.2 days to Writing at 6.2.
Page 4 – Clients
Total Project Value by Client Industry is a pie with six near-equal slices, the largest $347.9K and the smallest $182.4K. Total Projects vs Completed Projects by Client Type shows SMB at 190 projects with 143 completed, Startup 162/121, Enterprise 98/71 and Agency 50/41. Project Value vs Freelancer Earnings by Region covers N. America, Europe, Asia Pacific, MEA and LATAM, and Total Projects by Payment Method gives Card 175, PayPal 147, Bank 107 and Wallet 71.
Page 5 – Delivery
On-Time Projects vs Completed Projects by Month traces both series across Jan-Dec and rises steadily through the year. Avg. Delivery Days by Contract Type reduces to two numbers – Hourly 16.5 days, Fixed Price 14.1. On-Time % by Region ranks LATAM 78.8%, N. America 75.2%, Asia Pacific 73.6%, Europe 72.1% and MEA 60.7%. Total Projects vs Completed Projects by Quarter closes with Q1 114/70, Q2 112/79, Q3 125/103 and Q4 149/124.
Freelance Marketplaces Dashboard vs. Google Sheets vs. Paid Freelance SaaS – Feature Comparison
| This Excel dashboard | Google Sheets build | Bonsai / Hubstaff Tasks | |
|---|---|---|---|
| Cost | One payment, under $30 | Free, but you build it | $21-$39 per user / month |
| Platform | Excel 2016+ / Microsoft 365 | Browser | Browser and mobile app |
| Setup time | Paste your export and refresh | Several days of chart work | Hours, plus data migration |
| Real-time team collaboration | Via OneDrive co-authoring | Yes, built in | Yes, built in |
| Mobile access | Excel mobile app, read-only in practice | Yes | Yes |
| Customizable fields | Full – it is your workbook | Full | Limited to their schema |
| Share with link | Yes, through OneDrive | Yes | Yes |
| Year-1 cost at 5 users | Under $30 total | $0 plus build time | $1,260-$2,340 |
| Multi-marketplace fee comparison | Built in for six platforms | Build it yourself | Usually single-workspace |
| Works offline | Yes | No | No |
Who Should Use This Template
It earns its place for freelancers billing on two or more marketplaces, small agencies routing work through platform accounts, and operations leads who report monthly to someone who will not log into a SaaS tool. The common thread is more than one platform – if everything you do runs through a single marketplace, that platform’s own analytics tab already tells you most of this.
It is the wrong tool if you need live API sync, invoicing, contracts, payments or time tracking. None of those are in the workbook and none are planned. It is an analysis layer over data you already have.
Real-World Use Cases
The three-platform developer. Billing through Upwork, Toptal and Contra, she finds Toptal returning the second-highest project value while charging the second-highest fee, and Web Dev carrying an 18.4-day average delivery. She reprices her Toptal milestone work rather than dropping the platform.
The six-person studio. The Clients page shows SMB clients completing 143 of 190 projects against Agency clients completing 41 of 50. The Delivery page shows Q4 at 149 projects against Q1’s 114. Contractor capacity gets planned around Q4 instead of spread evenly.
The agency operations lead. She filters to one region, exports the Delivery page to PDF and emails it. On-Time % by Region putting MEA at 60.7% against LATAM’s 78.8% becomes the next delivery review’s agenda.
Advantages of the Freelance Marketplaces Dashboard in Excel
- Cross-platform view no marketplace provides. The fee comparison is the reason to own it.
- No lock-in. A plain .xlsx with no macros and no add-ins. Your data stays on your machine.
- Immediate feedback. 500 sample rows mean you evaluate a working dashboard, not an empty shell.
- Four-dimension filtering. Month, marketplace, service and region compose, so you can ask narrow questions.
- One payment. At five users the SaaS alternatives run past $1,200 in year one.
Opportunities for Improvement
Honest limitations, because they matter more than the feature list:
- No API connection. Every refresh means exporting from each platform and pasting. On a monthly cadence that is fine; weekly it becomes a chore.
- Single currency. The formulas are currency-agnostic but there is no conversion, so multi-currency billing has to be normalised before it goes in.
- Mobile is read-only in practice. Slicers are awkward on a phone. This is a desktop tool.
- Fee percentages are static. The sample rates reflect standard published commissions; tiered or negotiated rates need editing on the data sheet.
- No forecasting. It reports what happened. There is no projection or scenario modelling.
Best Practices
- Keep a pristine copy of the original file before deleting the sample rows.
- Do not rename the data sheet column headers – the charts reference them.
- Normalise currency before pasting if you bill in more than one.
- Refresh with Data > Refresh All after every paste, not just on the page you are looking at.
- Clear all four slicers before exporting a page, or you will send a filtered report by accident.
- Get comfortable with slicer multi-select – Microsoft’s slicer guide covers it in two minutes.
- Review fee percentages quarterly; marketplaces change their commission structures.
Explore Relevant Templates
- Gig Economy KPI Scorecard in Excel – target-versus-actual traffic lights instead of trend charts.
- Influencer Collectives Dashboard in Excel – the same multi-platform analysis for creator networks.
- AI Art Studios Dashboard in Excel – project and delivery analytics for creative studios.
Frequently Asked Questions
Does it connect to Upwork or Fiverr automatically?
No. You export from each platform and paste into the data sheet, then refresh. That keeps the workbook working regardless of platform API changes, and keeps your data local.
Which Excel versions are supported?
Excel 2016 or later and Microsoft 365, on Windows or Mac. Standard .xlsx, no macros, so no security prompt about enabling content.
Can I add a seventh marketplace?
Yes. Add rows with the new marketplace name and refresh – the charts and the Marketplace slicer pick it up. Six is what the sample data uses, not a limit.
Is there a Google Sheets version of this dashboard?
Not of this exact workbook. The nearest equivalents are the Freelance Marketplace Gig Tracker and the Freelance Developer Dashboard, both in Google Sheets, with a different page structure.
What is actually in the download?
One ZIP containing the .xlsx workbook and a PDF user manual. Nothing to install.
Does it track time or send invoices?
No. It is an analysis dashboard. Time tracking, invoicing, contracts and payments are all out of scope.
About the Author
Built by PK – Microsoft Certified Professional with 15+ years of Excel, Google Sheets, and Power BI experience. Founder of NextGenTemplates, reaching 300K+ subscribers across YouTube channels. Every template is hand-built and tested before release.
Conclusion
The Freelance Marketplaces Dashboard in Excel exists because the platform you earn the most on is not always the platform you keep the most from. Five pages, six marketplaces, four slicers and 500 sample records, in a plain .xlsx that costs less than one month of the SaaS alternatives.
Get it here: Freelance Marketplaces Dashboard in Excel on NextGenTemplates.
More Excel dashboards, walkthroughs and build tutorials on the PK: An Excel Expert YouTube channel.