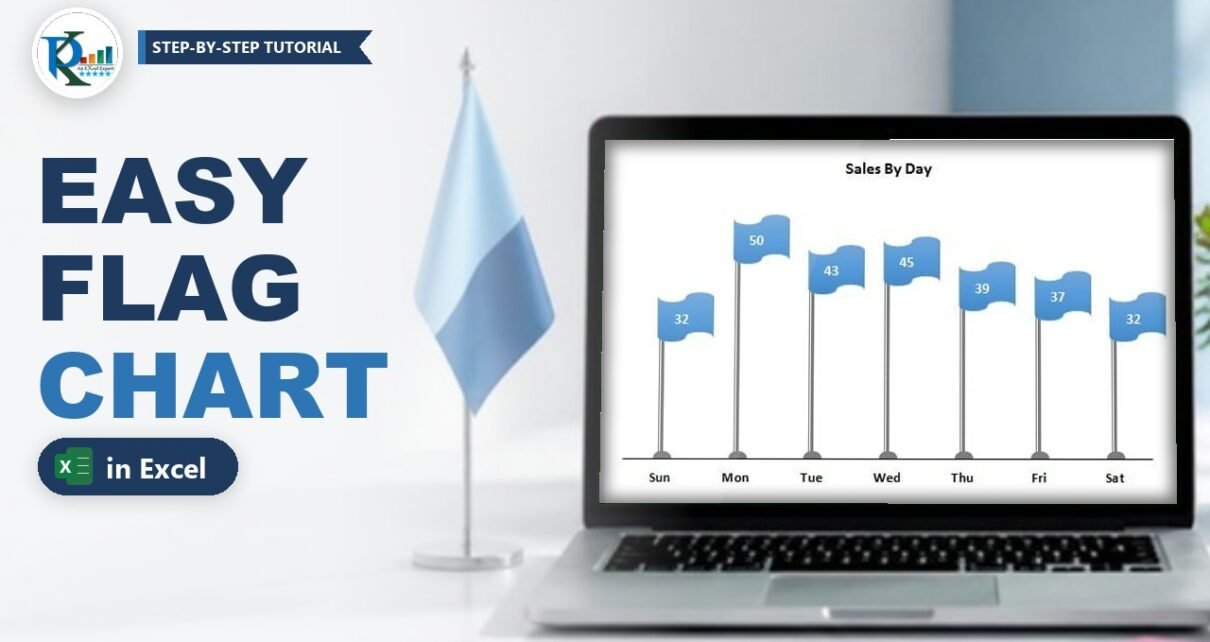
Flag Chart in Excel: Infographic with Error Bars and Shapes
A flag chart in Excel turns a plain column chart into an eye-catching infographic: every value becomes a flag on a pole, and the pole height shows the number. It
Transforming Data into Decisions