New: NextGenTemplates Academy - video courses on Excel formulas with AI and Pivot Tables & dashboards. Early-bird: 20% off with code EARLYBIRD20 - first 20 orders only. See the courses →
  • Learn Excel (Free Course)
    • 1. Shortcut Keys
    • 2. Fill & Flash Fill
    • 3. Find & Replace
    • 4. Sort & Filter
    • 5. Formulas & Functions
    • 6. Data Validation
    • 7. Conditional Formatting
    • 8. Basic Charts
    • 9. Advanced Charts
    • 10. Pivot Tables
    • 11. Excel Dashboards
    • 12. VBA Course
    • 13. Excel Formulas with AI
  • Templates
  • Tutorials
    • Charts and Visualization
    • VBA
    • Excel Tips and Tricks
    • Excel Dashboards
    • Power Pivot & DAX
  • Power BI
  • Template Store
    • Ready to Use Templates
  • Courses
  • Academy
    • Excel + AI Mastery: 100 Formulas
    • Excel Pivot Tables & Dashboards
  • About Us
  • Contact Us

PK: An Excel Expert

Transforming Data into Decisions

Tag: Funding Source Analysis

Dashboard Power BI

Research & Development Institutes Dashboard in Power BI

December 22, 2025December 22, 2025 PKComments Off on Research & Development Institutes Dashboard in Power BI
Research and Development (R&D) institutes drive innovation, scientific discovery, and long-term growth. However, without clear performance visibility, even the best research initiatives lose direction. Therefore, leaders must track projects, budgets,
Read More
Dashboard Power BI

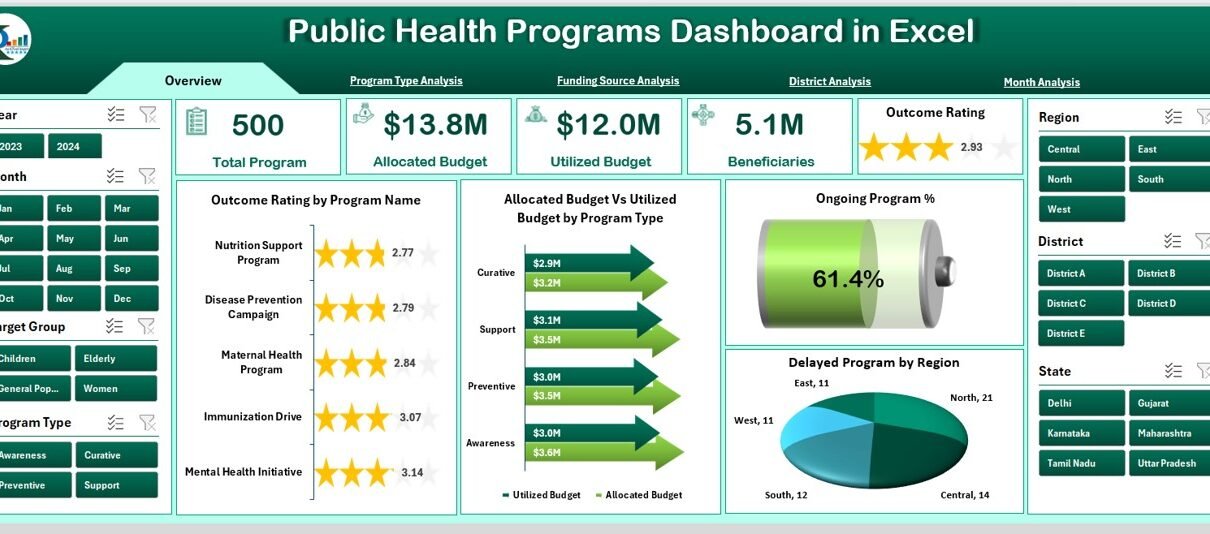
Public Health Programs Dashboard in Excel

December 11, 2025December 11, 2025 PKComments Off on Public Health Programs Dashboard in Excel
Public health programs improve community well-being, reduce disease risks, and strengthen healthcare outcomes. However, teams often struggle to track activities, budgets, beneficiaries, and performance indicators in one place. Reports stay
Read More
Dashboard Power BI

Aristech Startups Dashboard in Power BI

December 7, 2025December 7, 2025 PKComments Off on Aristech Startups Dashboard in Power BI
In today’s fast-moving startup ecosystem, data decides success. Startups, investors, accelerators, and analysts constantly track funding, valuation, revenue, IPO readiness, and industry performance. However, raw startup data often remains scattered
Read More
Dashboard

Smart Cities Development Dashboard in Excel

December 5, 2025December 5, 2025 PKComments Off on Smart Cities Development Dashboard in Excel
Smart cities continue to grow across the world, and every city leader wants better ways to track development activities, measure performance, and improve public services. However, many smart-city teams still
Read More
  • Learn Excel (Free Course)
    • 1. Shortcut Keys
    • 2. Fill & Flash Fill
    • 3. Find & Replace
    • 4. Sort & Filter
    • 5. Formulas & Functions
    • 6. Data Validation
    • 7. Conditional Formatting
    • 8. Basic Charts
    • 9. Advanced Charts
    • 10. Pivot Tables
    • 11. Excel Dashboards
    • 12. VBA Course
    • 13. Excel Formulas with AI
  • Templates
  • Tutorials
    • Charts and Visualization
    • VBA
    • Excel Tips and Tricks
    • Excel Dashboards
    • Power Pivot & DAX
  • Power BI
  • Template Store
    • Ready to Use Templates
  • Courses
  • Academy
    • Excel + AI Mastery: 100 Formulas
    • Excel Pivot Tables & Dashboards
  • About Us
  • Contact Us
Copyright © 2023 PK-AnExcelExpert.com - Privacy Policy