New: NextGenTemplates Academy - video courses on Excel formulas with AI and Pivot Tables & dashboards. Early-bird: 20% off with code EARLYBIRD20 - first 20 orders only. See the courses →
  • Learn Excel (Free Course)
    • 1. Shortcut Keys
    • 2. Fill & Flash Fill
    • 3. Find & Replace
    • 4. Sort & Filter
    • 5. Formulas & Functions
    • 6. Data Validation
    • 7. Conditional Formatting
    • 8. Basic Charts
    • 9. Advanced Charts
    • 10. Pivot Tables
    • 11. Excel Dashboards
    • 12. VBA Course
    • 13. Excel Formulas with AI
  • Templates
  • Tutorials
    • Charts and Visualization
    • VBA
    • Excel Tips and Tricks
    • Excel Dashboards
    • Power Pivot & DAX
  • Power BI
  • Template Store
    • Ready to Use Templates
  • Courses
  • Academy
    • Excel + AI Mastery: 100 Formulas
    • Excel Pivot Tables & Dashboards
  • About Us
  • Contact Us

PK: An Excel Expert

Transforming Data into Decisions

Tag: Industrial KPI Dashboard

Power BI Templates

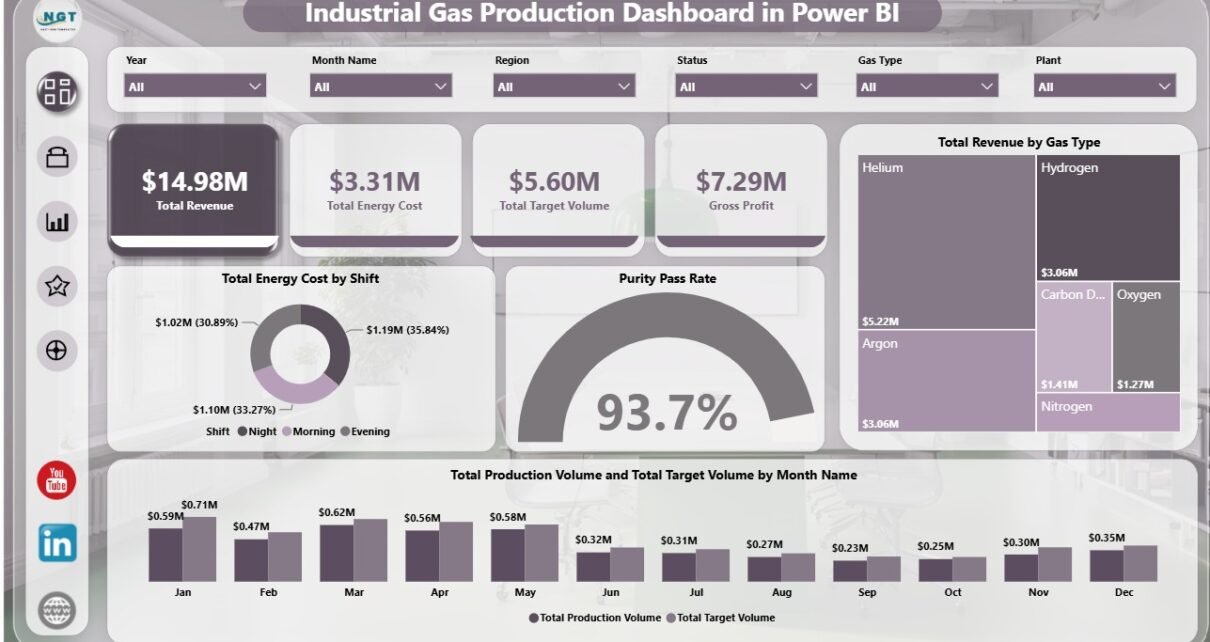
Industrial Gas Production Dashboard in Power BI

June 24, 2026June 24, 2026 PKComments Off on Industrial Gas Production Dashboard in Power BI
Industrial Gas Production Dashboard in Power BI helps plant managers, production supervisors, quality leaders, safety teams, and finance analysts track industrial gas performance from one interactive Power BI report. The
Read More
Dashboard

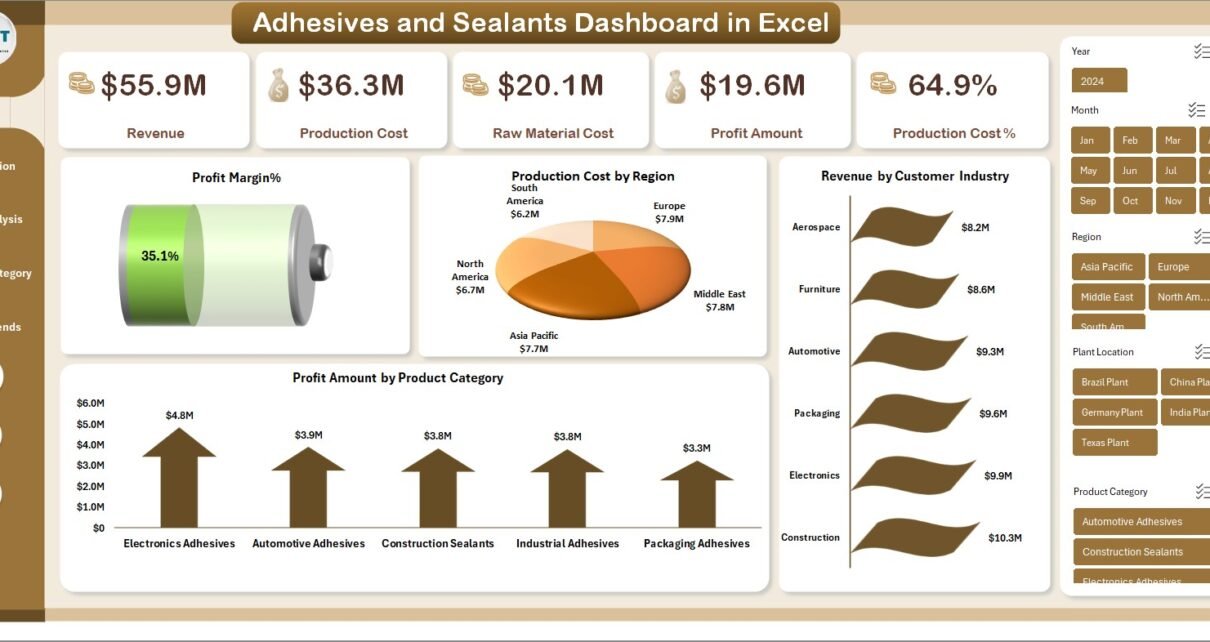
Adhesives and Sealants Dashboard in Excel

March 9, 2026March 9, 2026 PKComments Off on Adhesives and Sealants Dashboard in Excel
The adhesives and sealants industry plays a critical role in modern manufacturing. From automotive and construction to electronics and packaging, almost every industry uses adhesives and sealants in production processes.
Read More
Dashboard

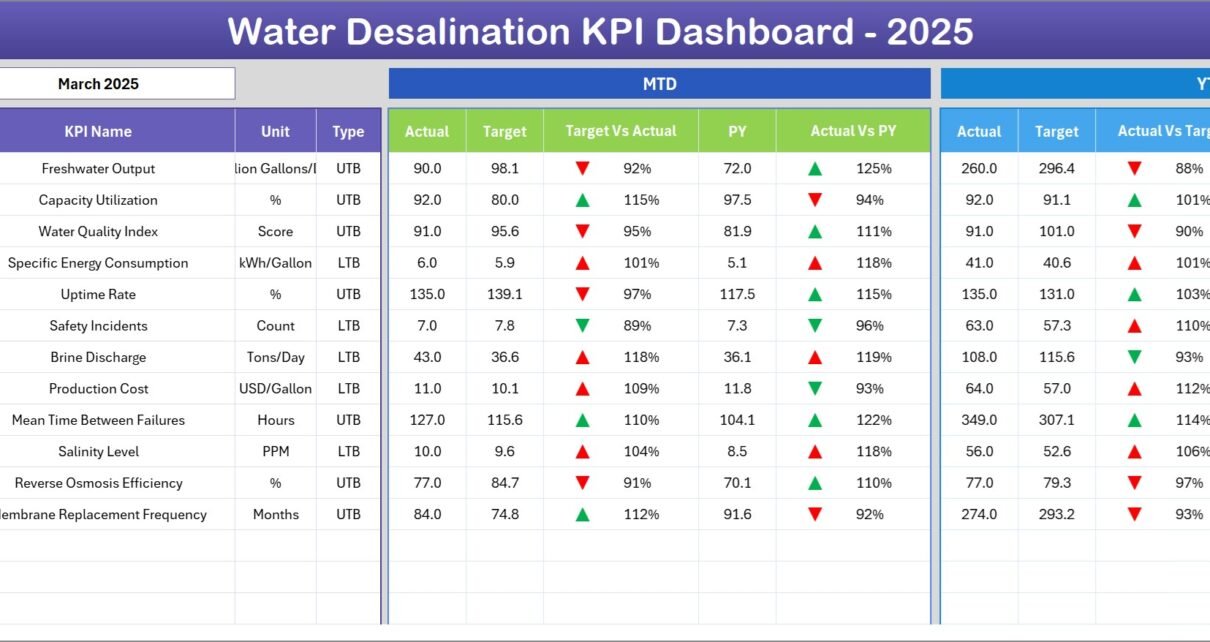
Water Desalination KPI Dashboard in Excel

March 9, 2026March 9, 2026 PKComments Off on Water Desalination KPI Dashboard in Excel
Freshwater scarcity continues to grow worldwide. Many countries now depend on water desalination plants to convert seawater into drinkable water. However, managing a desalination facility involves monitoring multiple operational and
Read More
Dashboard

3D Printing Manufacturing KPI Dashboard in Excel

February 28, 2026February 28, 2026 PKComments Off on 3D Printing Manufacturing KPI Dashboard in Excel
In today’s advanced manufacturing environment, 3D printing (additive manufacturing) has transformed how companies design, prototype, and produce products. Organizations now manufacture complex components faster, reduce material waste, and improve customization
Read More
Dashboard Power BI

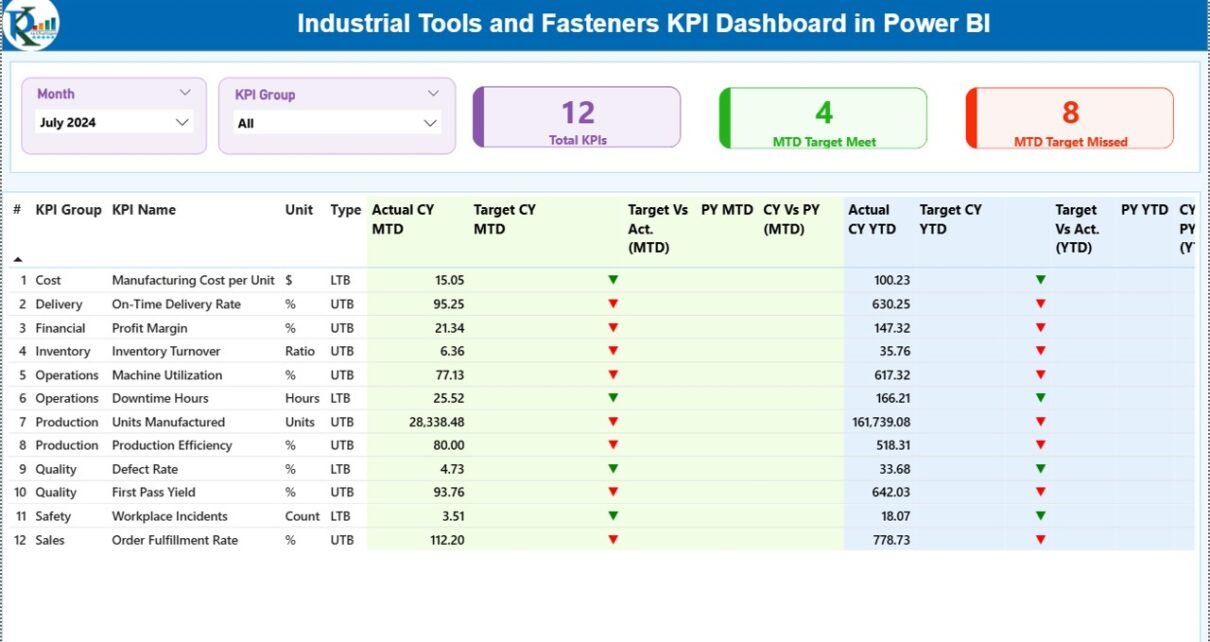
Industrial Tools and Fasteners KPI Dashboard in Power BI

February 28, 2026February 28, 2026 PKComments Off on Industrial Tools and Fasteners KPI Dashboard in Power BI
In today’s competitive manufacturing environment, industrial tools and fasteners companies must monitor performance continuously to maintain quality, control costs, and improve operational efficiency. However, many organizations still depend on scattered
Read More
Dashboard Power BI

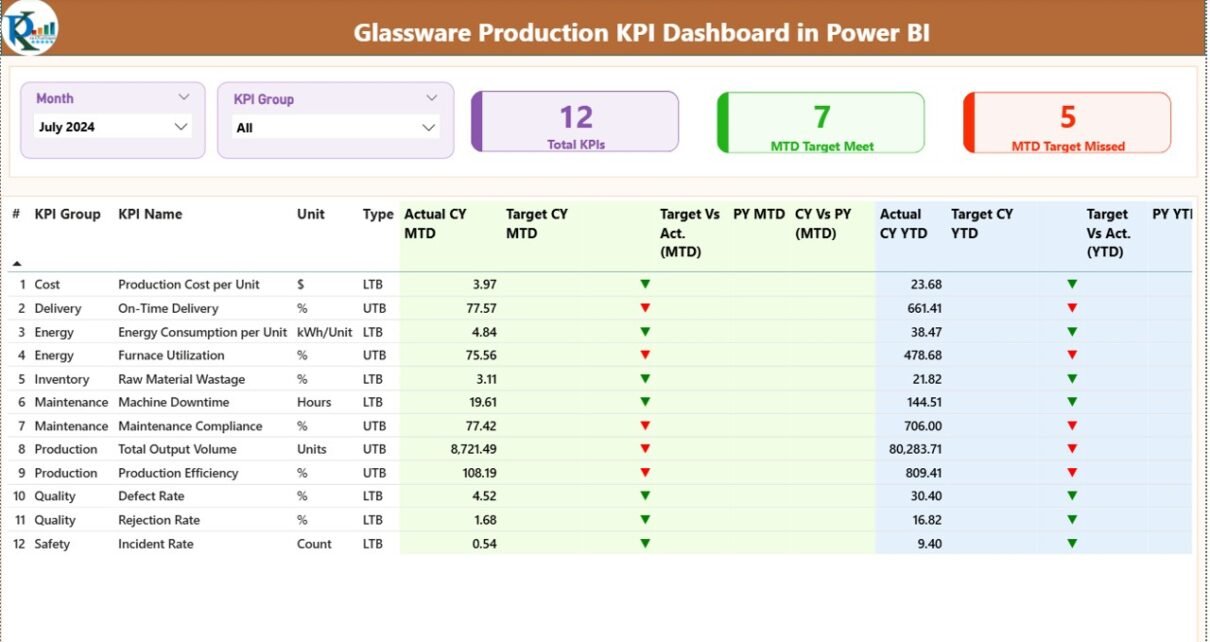
Glassware Production KPI Dashboard in Power BI

February 27, 2026February 27, 2026 PKComments Off on Glassware Production KPI Dashboard in Power BI
In today’s competitive manufacturing environment, glassware production companies must continuously monitor performance to maintain quality, control costs, and improve operational efficiency. Manufacturers face constant challenges such as production losses, quality
Read More
Dashboard

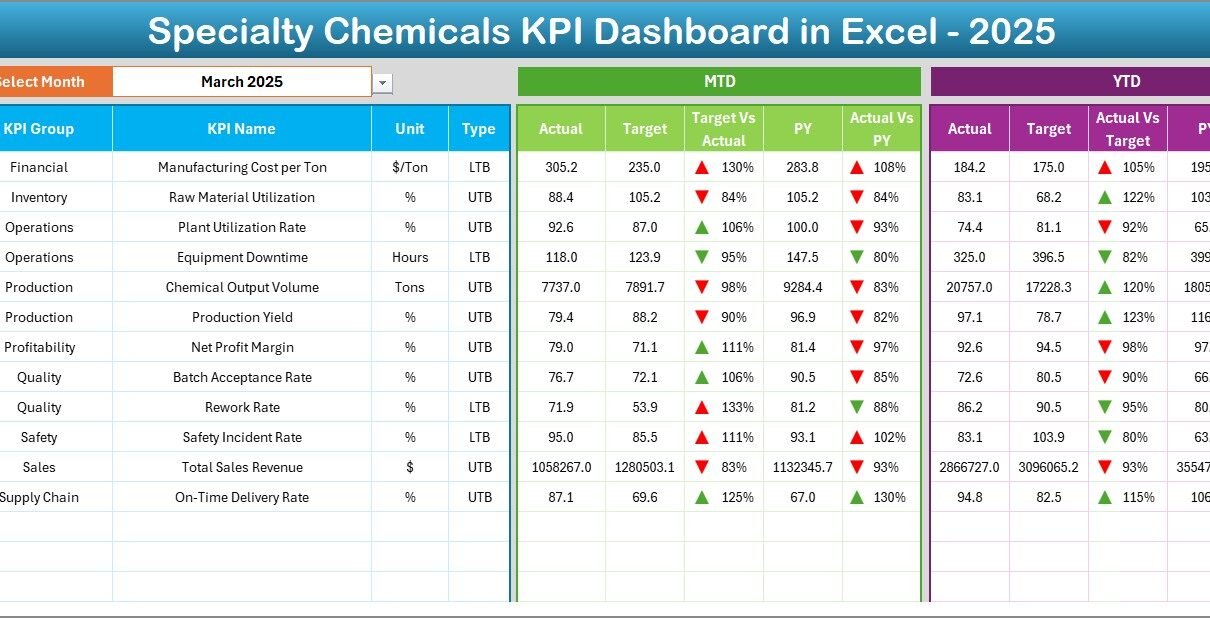
Specialty Chemicals KPI Dashboard in Excel

February 27, 2026February 27, 2026 PKComments Off on Specialty Chemicals KPI Dashboard in Excel
In today’s highly competitive chemical industry, companies must monitor production efficiency, quality performance, safety compliance, and financial outcomes continuously. However, many specialty chemical manufacturers still rely on scattered spreadsheets and
Read More
Dashboard Power BI

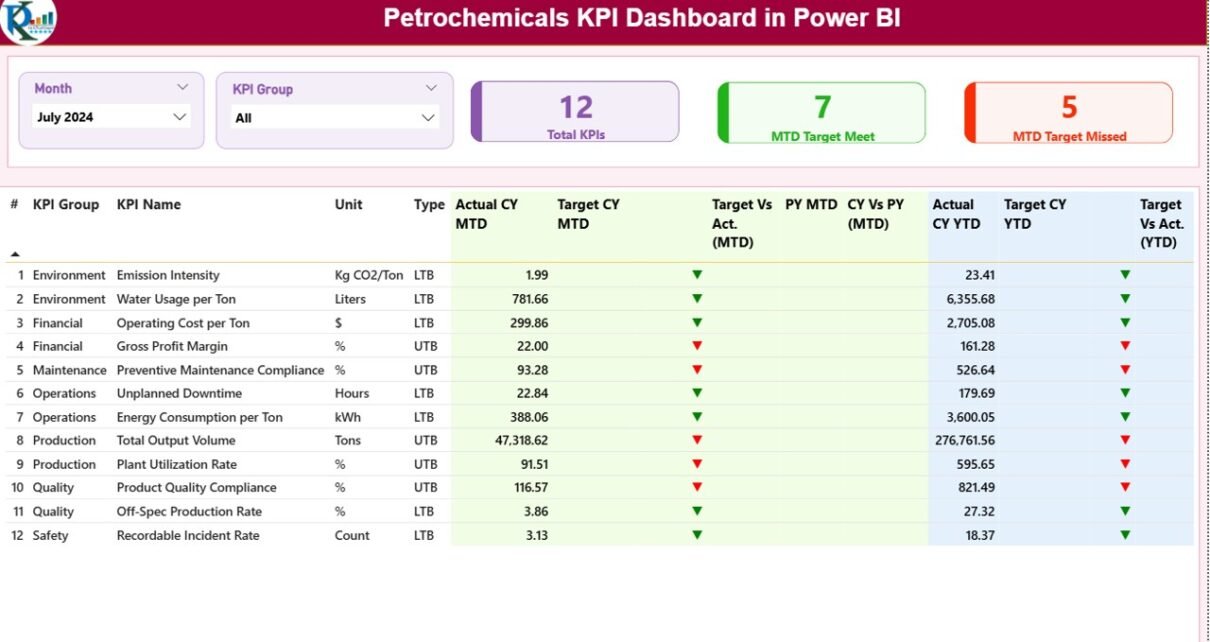
Petrochemicals KPI Dashboard in Power BI

February 26, 2026February 26, 2026 PKComments Off on Petrochemicals KPI Dashboard in Power BI
The petrochemical industry operates in a highly competitive and performance-driven environment. Companies must monitor production efficiency, operational reliability, safety compliance, cost control, and financial performance continuously. However, many organizations still
Read More
Dashboard

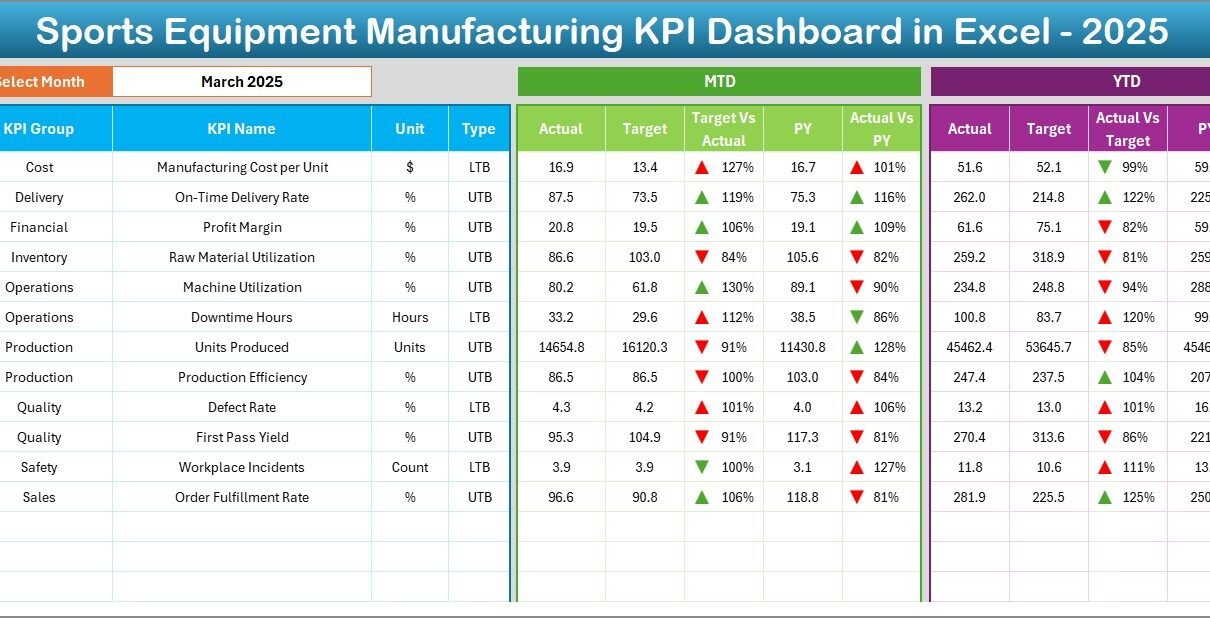
Sports Equipment Manufacturing KPI Dashboard in Excel

February 25, 2026February 25, 2026 PKComments Off on Sports Equipment Manufacturing KPI Dashboard in Excel
Manufacturing sports equipment requires precision, efficiency, quality control, and continuous performance monitoring. Companies must manage production schedules, raw material consumption, workforce productivity, machine utilization, defect rates, and delivery timelines simultaneously.
Read More
Dashboard

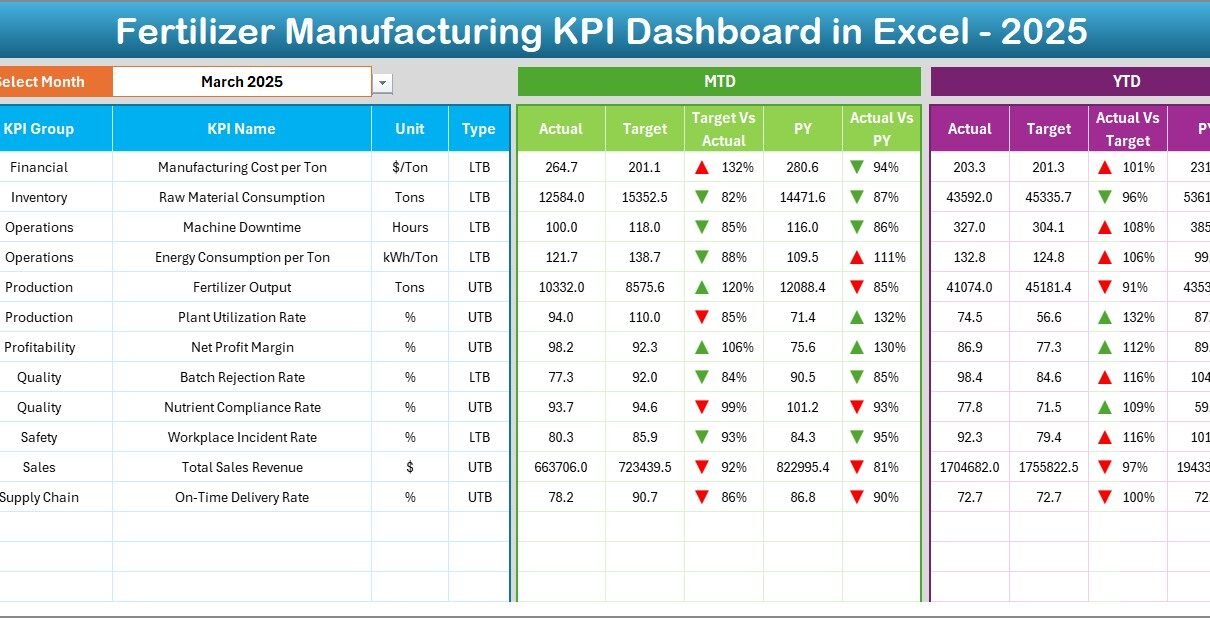
Fertilizer Manufacturing KPI Dashboard in Excel

February 25, 2026February 25, 2026 PKComments Off on Fertilizer Manufacturing KPI Dashboard in Excel
Modern fertilizer manufacturing companies operate in a highly competitive and efficiency-driven environment. Every day, plants manage raw material consumption, production output, energy usage, quality parameters, logistics, and operational costs. However,
Read More

Posts pagination

1 2 Next
  • Learn Excel (Free Course)
    • 1. Shortcut Keys
    • 2. Fill & Flash Fill
    • 3. Find & Replace
    • 4. Sort & Filter
    • 5. Formulas & Functions
    • 6. Data Validation
    • 7. Conditional Formatting
    • 8. Basic Charts
    • 9. Advanced Charts
    • 10. Pivot Tables
    • 11. Excel Dashboards
    • 12. VBA Course
    • 13. Excel Formulas with AI
  • Templates
  • Tutorials
    • Charts and Visualization
    • VBA
    • Excel Tips and Tricks
    • Excel Dashboards
    • Power Pivot & DAX
  • Power BI
  • Template Store
    • Ready to Use Templates
  • Courses
  • Academy
    • Excel + AI Mastery: 100 Formulas
    • Excel Pivot Tables & Dashboards
  • About Us
  • Contact Us
Copyright © 2023 PK-AnExcelExpert.com - Privacy Policy