New: NextGenTemplates Academy - video courses on Excel formulas with AI and Pivot Tables & dashboards. Early-bird: 20% off with code EARLYBIRD20 - first 20 orders only. See the courses →
  • Learn Excel (Free Course)
    • 1. Shortcut Keys
    • 2. Fill & Flash Fill
    • 3. Find & Replace
    • 4. Sort & Filter
    • 5. Formulas & Functions
    • 6. Data Validation
    • 7. Conditional Formatting
    • 8. Basic Charts
    • 9. Advanced Charts
    • 10. Pivot Tables
    • 11. Excel Dashboards
    • 12. VBA Course
    • 13. Excel Formulas with AI
  • Templates
  • Tutorials
    • Charts and Visualization
    • VBA
    • Excel Tips and Tricks
    • Excel Dashboards
    • Power Pivot & DAX
  • Power BI
  • Template Store
    • Ready to Use Templates
  • Courses
  • Academy
    • Excel + AI Mastery: 100 Formulas
    • Excel Pivot Tables & Dashboards
  • About Us
  • Contact Us

PK: An Excel Expert

Transforming Data into Decisions

Tag: Industrial KPI Dashboard

Dashboard Power BI

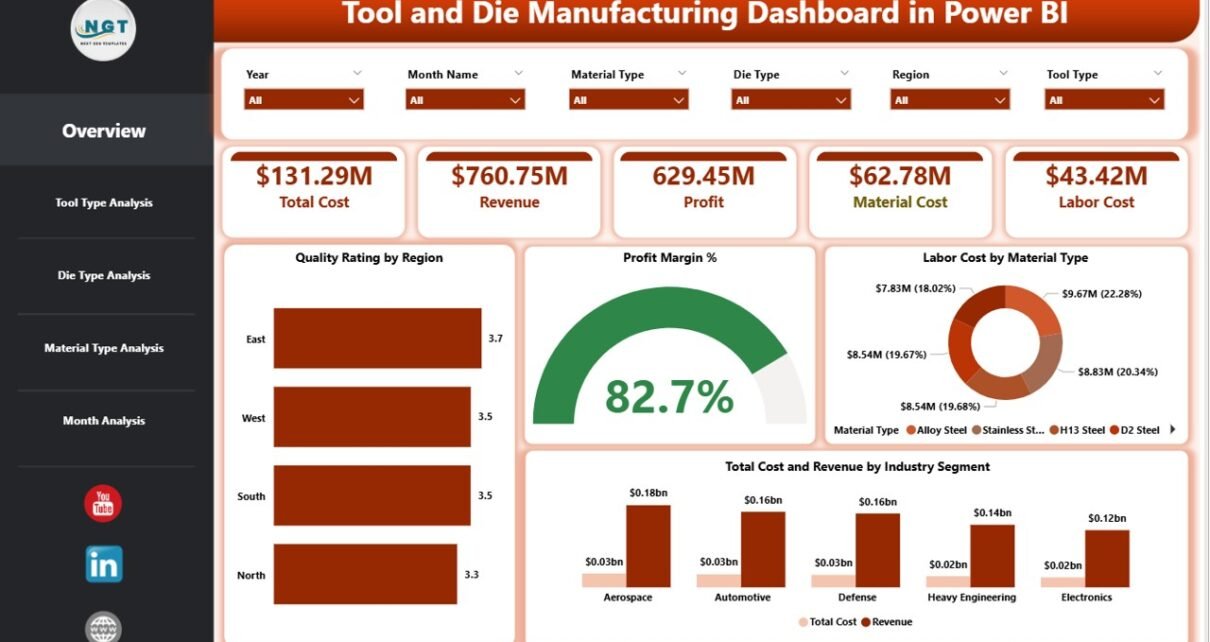
Tool and Die Manufacturing Dashboard in Power BI

February 14, 2026February 14, 2026 PKComments Off on Tool and Die Manufacturing Dashboard in Power BI
The tool and die industry drives modern manufacturing. Automotive plants, aerospace companies, electronics factories, and heavy equipment manufacturers all depend on precision tools and dies. However, many tool rooms still
Read More
Dashboard Power BI

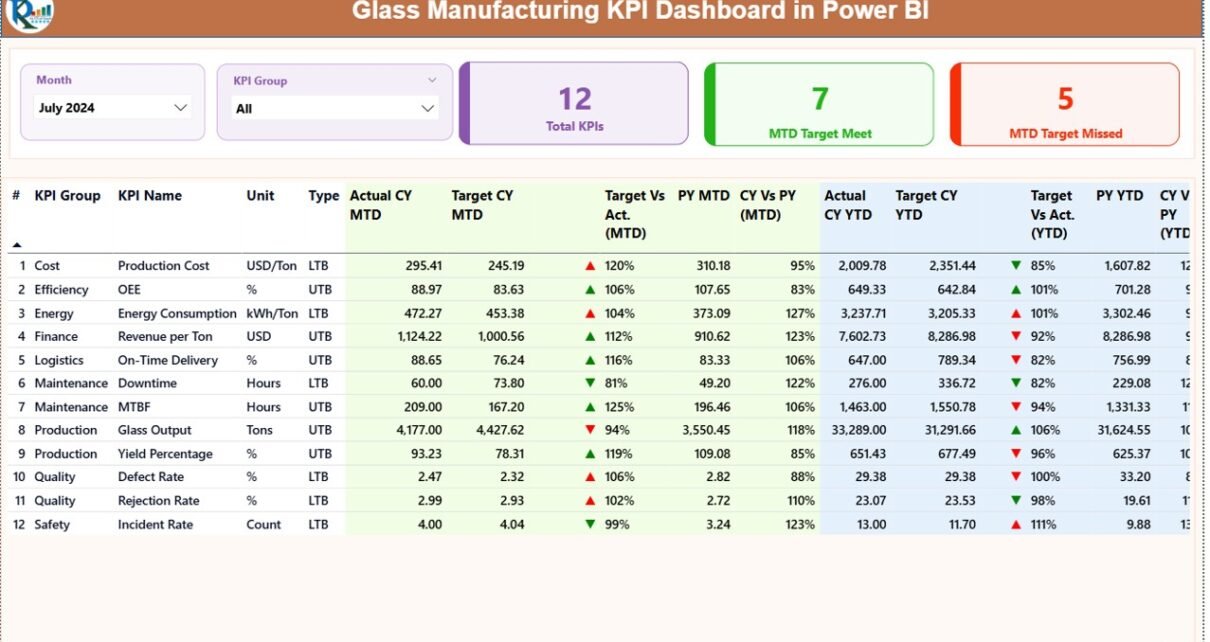
Glass Manufacturing KPI Dashboard in Power BI

December 19, 2025December 19, 2025 PKComments Off on Glass Manufacturing KPI Dashboard in Power BI
Glass manufacturing operates in a highly competitive and quality-sensitive environment. Manufacturers must control production efficiency, energy consumption, waste levels, quality defects, delivery timelines, and financial performance at the same time.
Read More
Dashboard

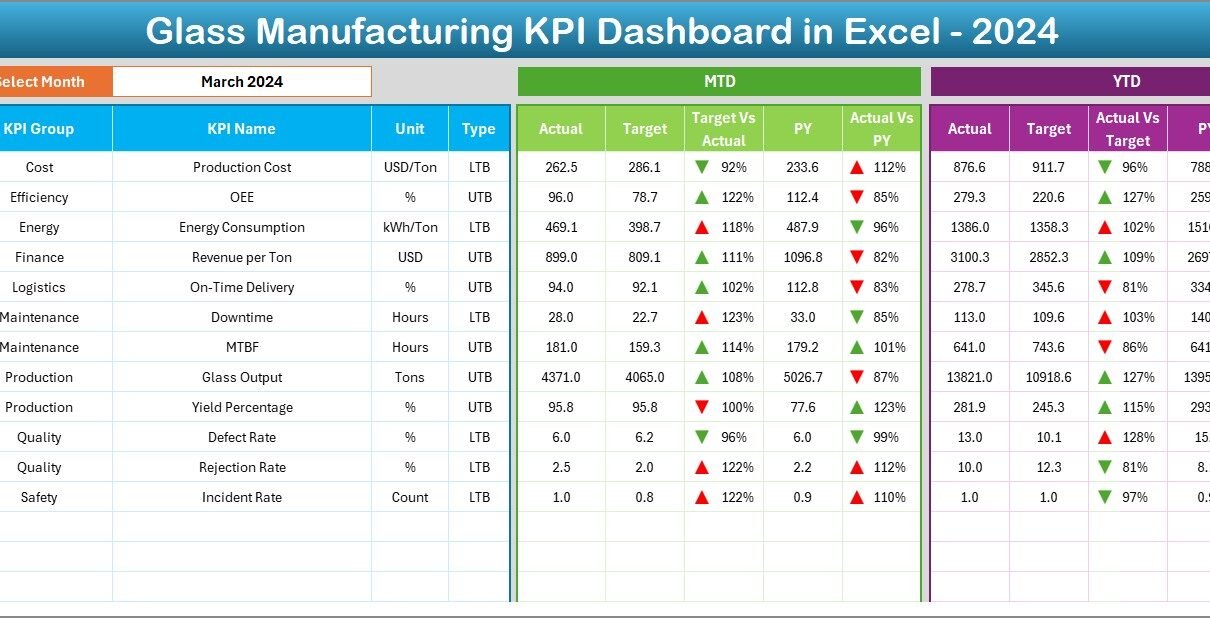
Glass Manufacturing KPI Dashboard in Excel

December 9, 2025December 9, 2025 PKComments Off on Glass Manufacturing KPI Dashboard in Excel
Running a glass manufacturing unit without clear performance visibility often leads to higher waste, increased downtime, missed targets, and delayed decisions. Although production teams generate大量 data every day, many organizations
Read More

Posts pagination

Previous 1 2
  • Learn Excel (Free Course)
    • 1. Shortcut Keys
    • 2. Fill & Flash Fill
    • 3. Find & Replace
    • 4. Sort & Filter
    • 5. Formulas & Functions
    • 6. Data Validation
    • 7. Conditional Formatting
    • 8. Basic Charts
    • 9. Advanced Charts
    • 10. Pivot Tables
    • 11. Excel Dashboards
    • 12. VBA Course
    • 13. Excel Formulas with AI
  • Templates
  • Tutorials
    • Charts and Visualization
    • VBA
    • Excel Tips and Tricks
    • Excel Dashboards
    • Power Pivot & DAX
  • Power BI
  • Template Store
    • Ready to Use Templates
  • Courses
  • Academy
    • Excel + AI Mastery: 100 Formulas
    • Excel Pivot Tables & Dashboards
  • About Us
  • Contact Us
Copyright © 2023 PK-AnExcelExpert.com - Privacy Policy