New: NextGenTemplates Academy - video courses on Excel formulas with AI and Pivot Tables & dashboards. Early-bird: 20% off with code EARLYBIRD20 - first 20 orders only. See the courses →
  • Learn Excel (Free Course)
    • 1. Shortcut Keys
    • 2. Fill & Flash Fill
    • 3. Find & Replace
    • 4. Sort & Filter
    • 5. Formulas & Functions
    • 6. Data Validation
    • 7. Conditional Formatting
    • 8. Basic Charts
    • 9. Advanced Charts
    • 10. Pivot Tables
    • 11. Excel Dashboards
    • 12. VBA Course
    • 13. Excel Formulas with AI
  • Templates
  • Tutorials
    • Charts and Visualization
    • VBA
    • Excel Tips and Tricks
    • Excel Dashboards
    • Power Pivot & DAX
  • Power BI
  • Template Store
    • Ready to Use Templates
  • Courses
  • Academy
    • Excel + AI Mastery: 100 Formulas
    • Excel Pivot Tables & Dashboards
  • About Us
  • Contact Us

PK: An Excel Expert

Transforming Data into Decisions

Tag: KPI Dashboard

Dashboard

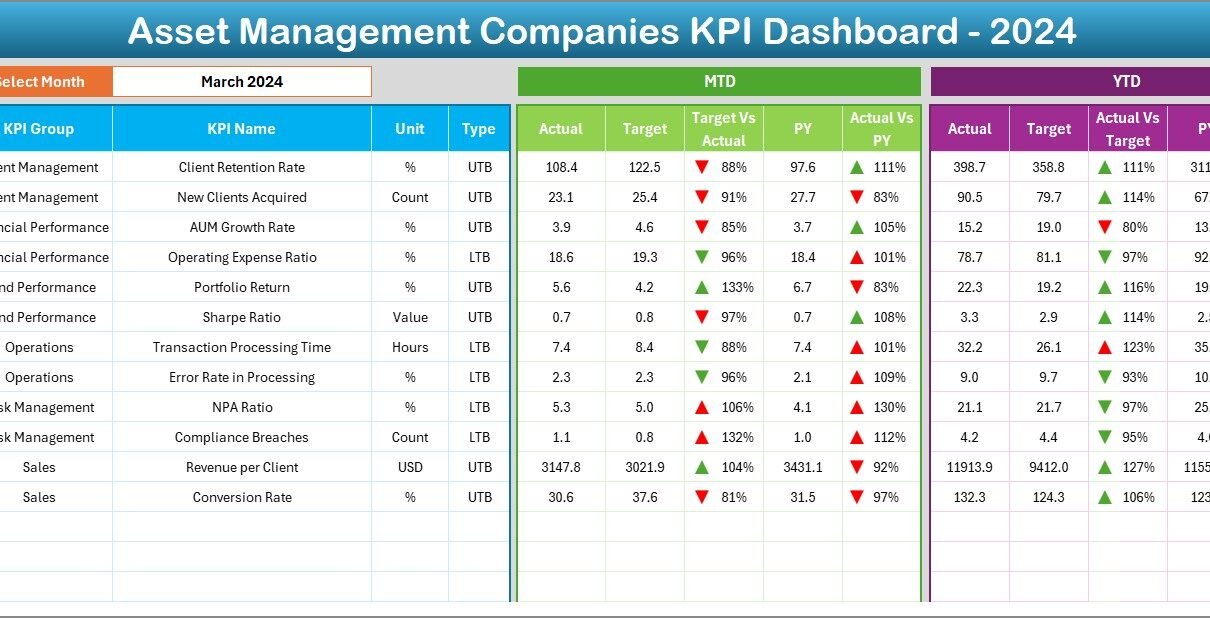
Asset Management Companies KPI Dashboard in Excel

December 5, 2025December 5, 2025 PKComments Off on Asset Management Companies KPI Dashboard in Excel
Asset management companies handle large portfolios, investment strategies, client relationships, compliance tasks, and performance monitoring every day. Because these firms work with sensitive financial data and strict reporting deadlines, decision-makers
Read More
Dashboard Power BI

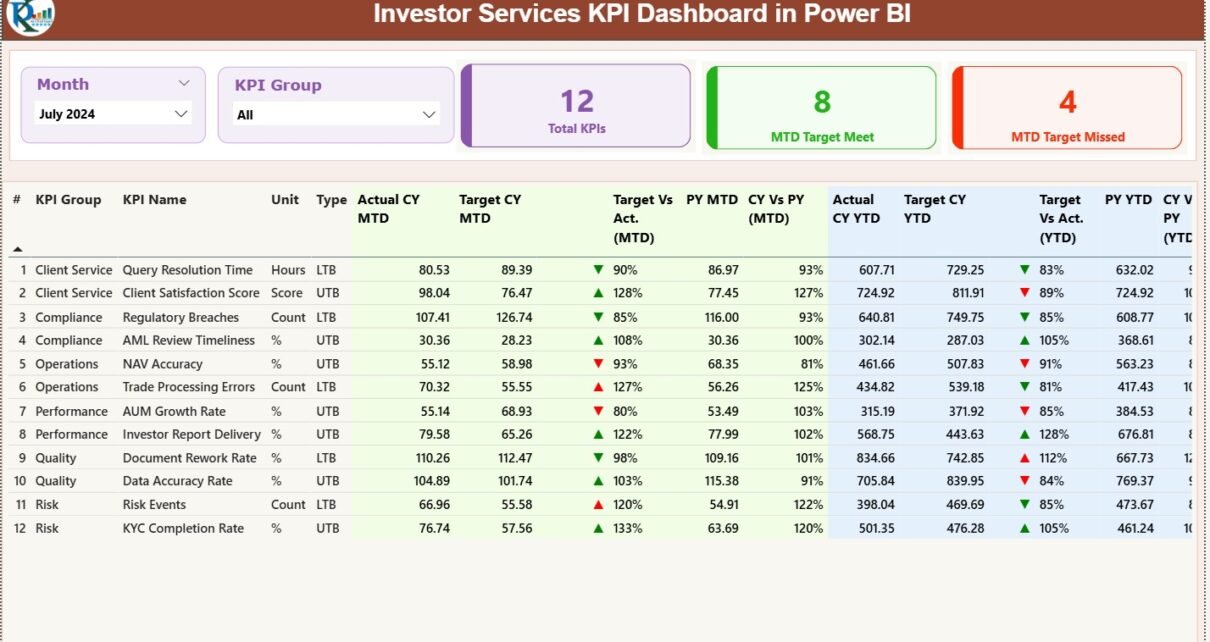
Investor Services KPI Dashboard in Power BI

December 5, 2025December 5, 2025 PKComments Off on Investor Services KPI Dashboard in Power BI
Investor services teams work in a fast and demanding environment. They handle investor onboarding, communication, fund reporting, compliance reviews, performance updates, and service-level commitments every day. Because investors expect transparency
Read More
Dashboard Power BI

Renewable Infrastructure Projects KPI Dashboard in Power BI

December 5, 2025December 5, 2025 PKComments Off on Renewable Infrastructure Projects KPI Dashboard in Power BI
Renewable infrastructure projects grow fast, and teams need accurate data to stay on track. Solar farms, wind energy parks, hydro projects, and other renewable installations operate with tight budgets, strict
Read More
Dashboard Power BI

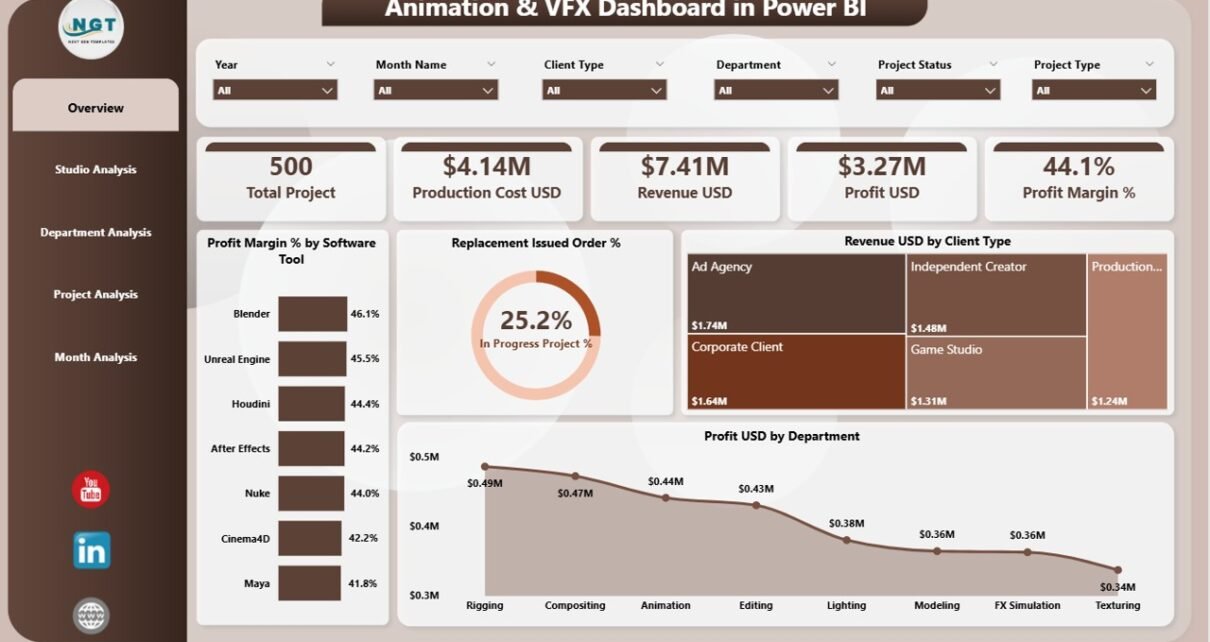
Animation & VFX Dashboard in Power BI

December 4, 2025December 4, 2025 PKComments Off on Animation & VFX Dashboard in Power BI
The animation and VFX industry grows every year because global demand for digital content keeps rising. However, studios face many challenges such as complex workflows, tight deadlines, high production costs,
Read More
Templates

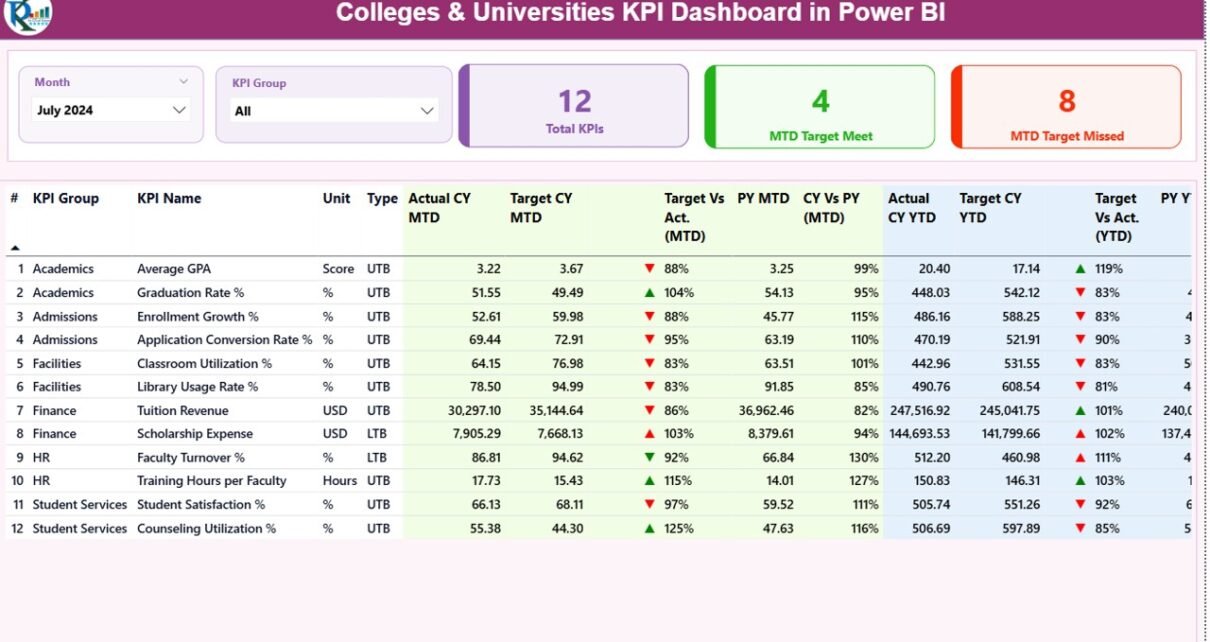
Colleges & Universities KPI Dashboard in Power BI

December 4, 2025December 4, 2025 PKComments Off on Colleges & Universities KPI Dashboard in Power BI
Running a college or university involves hundreds of activities every month. Academic performance, student admissions, staff efficiency, research output, attendance, operational costs, and administrative quality all demand constant attention. Because
Read More
Templates

Office Waste Management Dashboard in Excel

December 3, 2025December 3, 2025 PKComments Off on Office Waste Management Dashboard in Excel
Managing office waste becomes challenging when multiple departments, vendors, and waste categories generate different types of waste every day. Teams struggle when they track everything manually because sheets grow large,
Read More
Dashboard Power BI

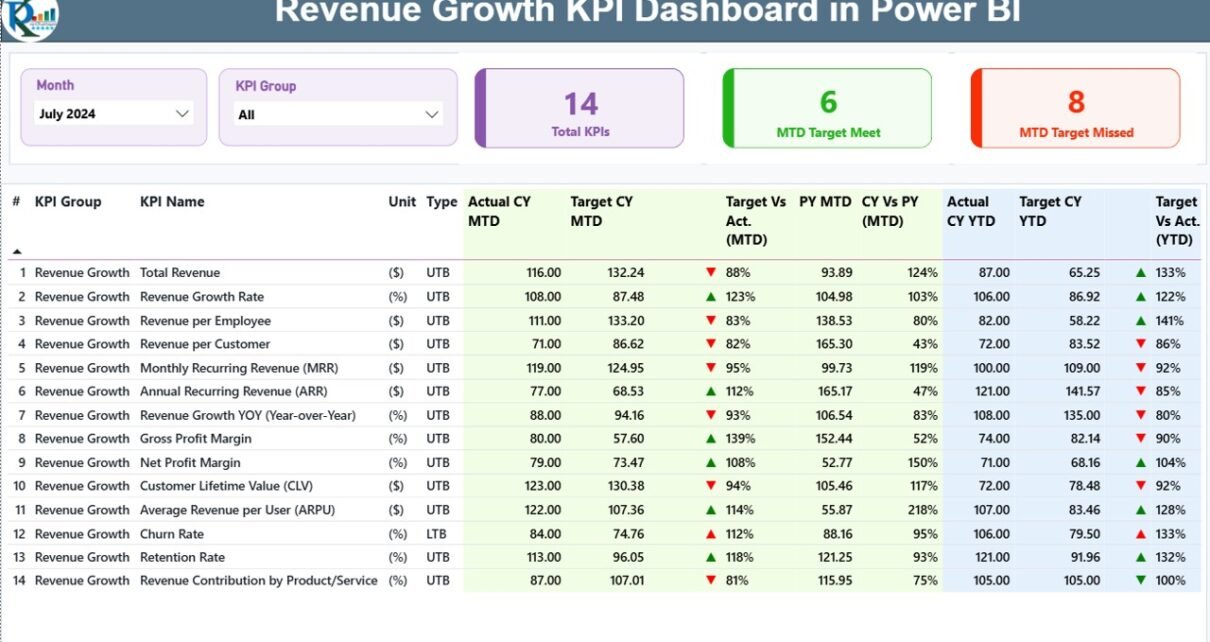
Revenue Growth KPI Dashboard in Power BI

December 3, 2025December 3, 2025 PKComments Off on Revenue Growth KPI Dashboard in Power BI
Businesses need fast and clear insights to grow their revenue. Sales change every month, new products enter the market, customer behaviour shifts often, and marketing teams run many campaigns. Because
Read More
Dashboard Power BI

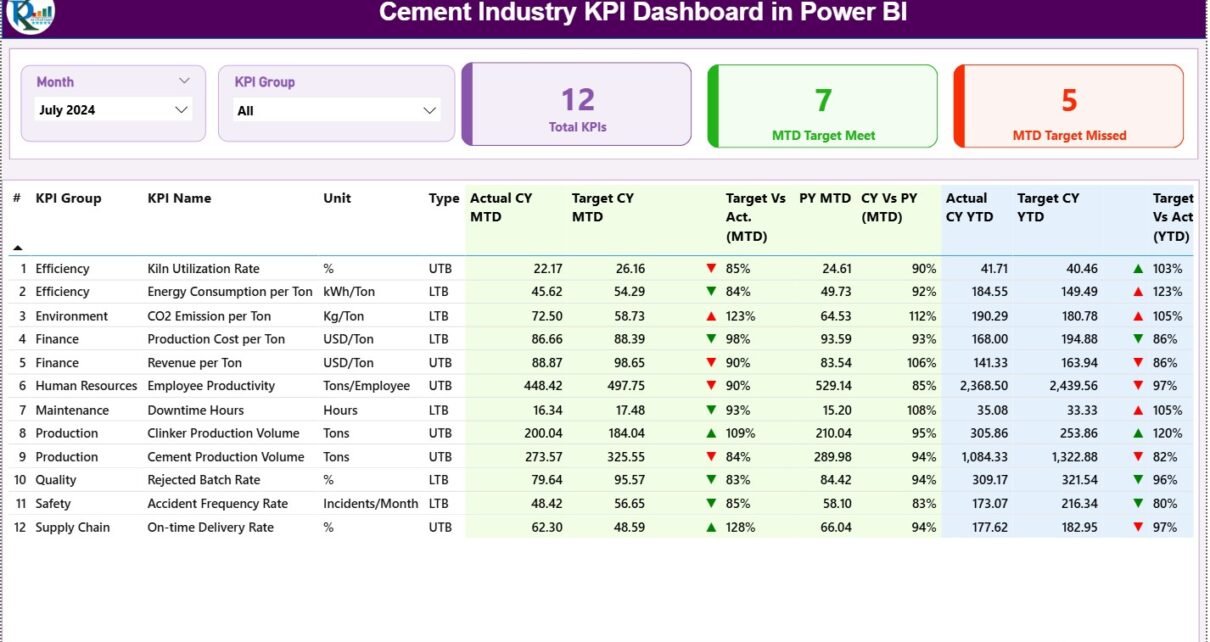
Cement Industry KPI Dashboard in Power BI

December 2, 2025December 2, 2025 PKComments Off on Cement Industry KPI Dashboard in Power BI
The cement industry works in a highly competitive and fast-moving environment. Every day, companies track production, quality, energy efficiency, safety performance, logistics, and sales numbers. As plants expand and operations
Read More
Dashboard Power BI

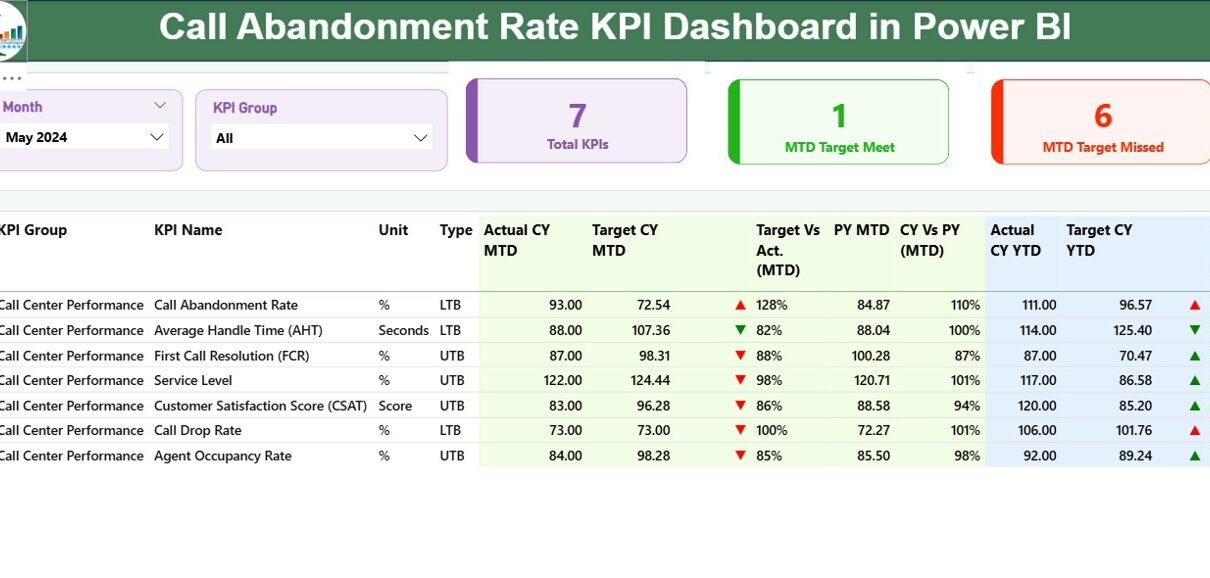
Call Abandonment Rate KPI Dashboard in Power BI

December 1, 2025December 1, 2025 PKComments Off on Call Abandonment Rate KPI Dashboard in Power BI
Call centers deal with hundreds or even thousands of customer calls every day. When the workload increases, many callers hang up before they reach an agent. This impacts customer satisfaction,
Read More
Templates

Cleaning Services KPI Dashboard in Power BI

November 30, 2025November 30, 2025 PKComments Off on Cleaning Services KPI Dashboard in Power BI
Cleaning companies work in a fast and demanding environment. Every day, teams try to complete scheduled tasks, meet client standards, control costs, and maintain staff performance. Because so much happens
Read More

Posts pagination

Previous 1 … 29 30 31 … 83 Next
  • Learn Excel (Free Course)
    • 1. Shortcut Keys
    • 2. Fill & Flash Fill
    • 3. Find & Replace
    • 4. Sort & Filter
    • 5. Formulas & Functions
    • 6. Data Validation
    • 7. Conditional Formatting
    • 8. Basic Charts
    • 9. Advanced Charts
    • 10. Pivot Tables
    • 11. Excel Dashboards
    • 12. VBA Course
    • 13. Excel Formulas with AI
  • Templates
  • Tutorials
    • Charts and Visualization
    • VBA
    • Excel Tips and Tricks
    • Excel Dashboards
    • Power Pivot & DAX
  • Power BI
  • Template Store
    • Ready to Use Templates
  • Courses
  • Academy
    • Excel + AI Mastery: 100 Formulas
    • Excel Pivot Tables & Dashboards
  • About Us
  • Contact Us
Copyright © 2023 PK-AnExcelExpert.com - Privacy Policy