New: NextGenTemplates Academy - video courses on Excel formulas with AI and Pivot Tables & dashboards. Early-bird: 20% off with code EARLYBIRD20 - first 20 orders only. See the courses →
  • Learn Excel (Free Course)
    • 1. Shortcut Keys
    • 2. Fill & Flash Fill
    • 3. Find & Replace
    • 4. Sort & Filter
    • 5. Formulas & Functions
    • 6. Data Validation
    • 7. Conditional Formatting
    • 8. Basic Charts
    • 9. Advanced Charts
    • 10. Pivot Tables
    • 11. Excel Dashboards
    • 12. VBA Course
    • 13. Excel Formulas with AI
  • Templates
  • Tutorials
    • Charts and Visualization
    • VBA
    • Excel Tips and Tricks
    • Excel Dashboards
    • Power Pivot & DAX
  • Power BI
  • Template Store
    • Ready to Use Templates
  • Courses
  • Academy
    • Excel + AI Mastery: 100 Formulas
    • Excel Pivot Tables & Dashboards
  • About Us
  • Contact Us

PK: An Excel Expert

Transforming Data into Decisions

Tag: KPI Dashboard

Dashboard

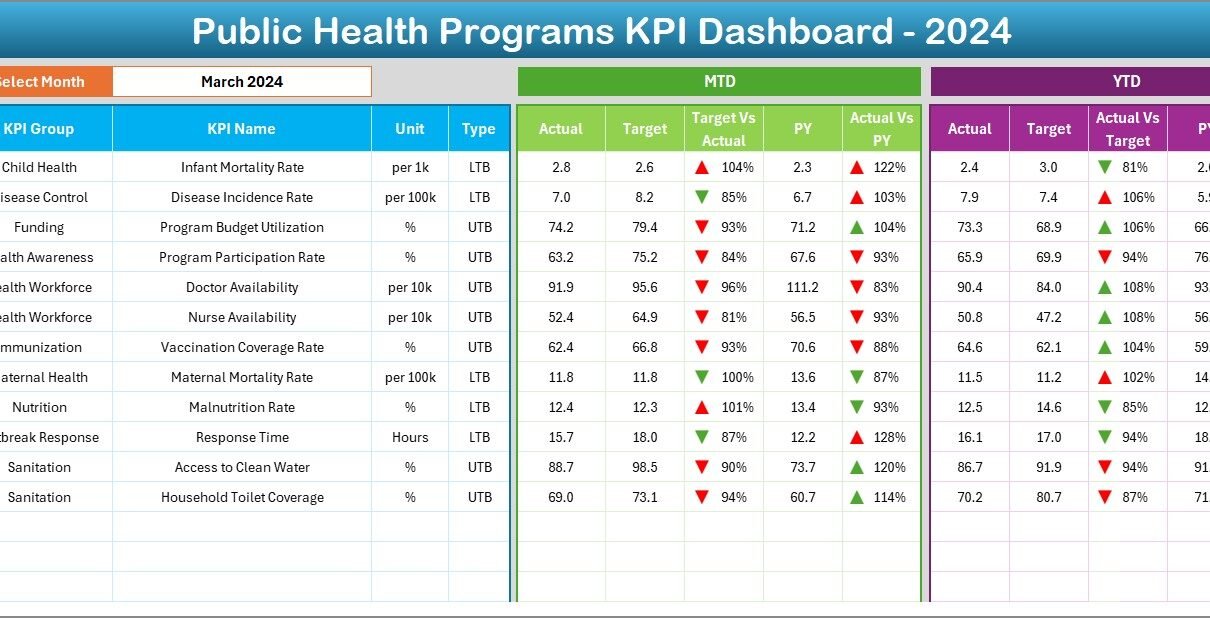
Public Health Programs KPI Dashboard in Excel

November 27, 2025November 27, 2025 PKComments Off on Public Health Programs KPI Dashboard in Excel
Public health programs are critical for improving population health, reducing disease burden, and ensuring access to quality healthcare services. Monitoring the effectiveness of these programs requires accurate data and clear
Read More
Dashboard Power BI

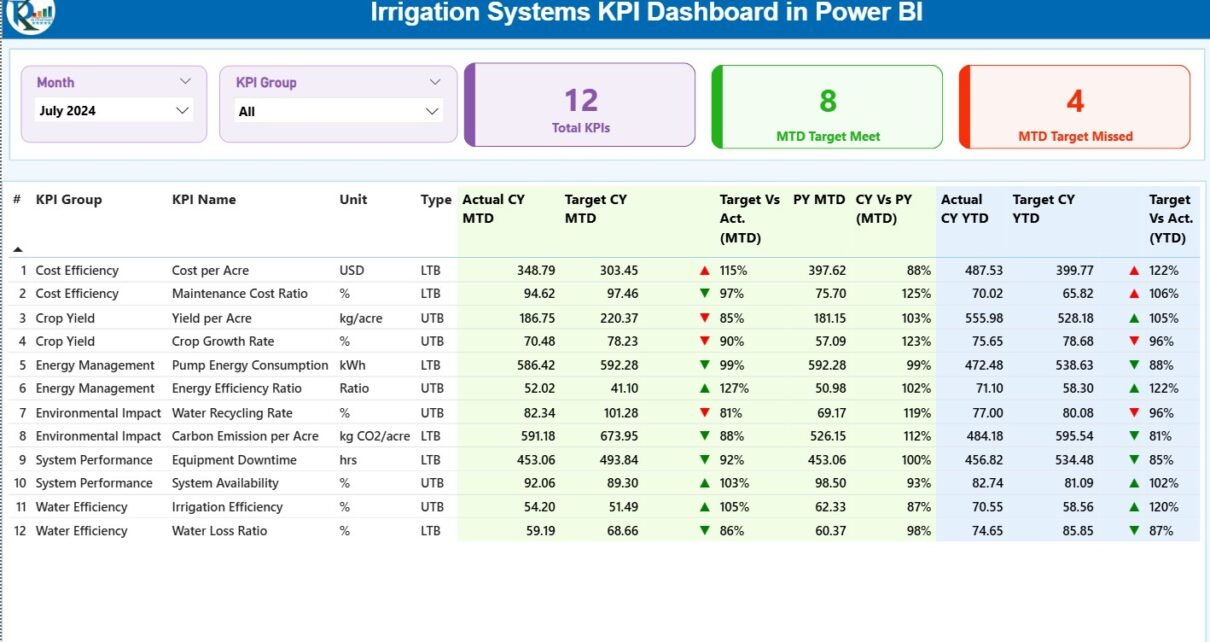
Irrigation Systems KPI Dashboard in Power BI

November 27, 2025November 27, 2025 PKComments Off on Irrigation Systems KPI Dashboard in Power BI
Effective irrigation management is essential for modern agriculture. Monitoring water usage, pump efficiency, field coverage, and system performance requires accurate data. Without proper tracking, irrigation systems can waste resources, increase
Read More
Dashboard Power BI

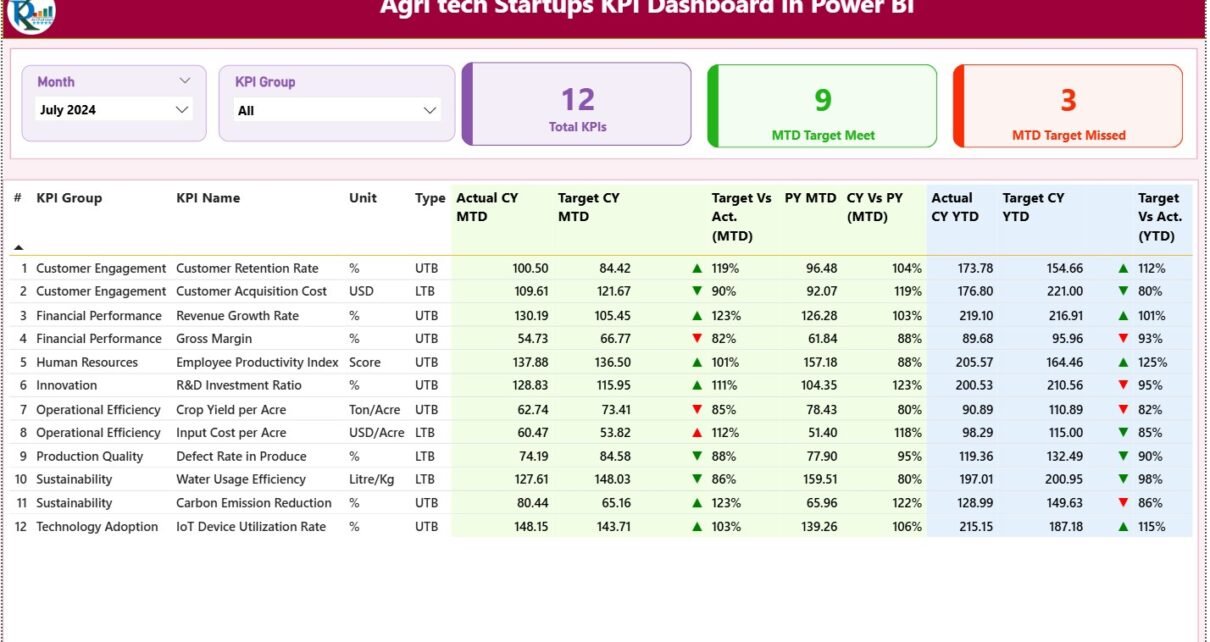
Agri Tech Startups KPI Dashboard in Power BI

November 27, 2025November 27, 2025 PKComments Off on Agri Tech Startups KPI Dashboard in Power BI
Running an Agri Tech startup is not easy. The industry moves fast, farming seasons change quickly, and teams must track dozens of performance indicators every month. Because of this, many
Read More
Dashboard Power BI

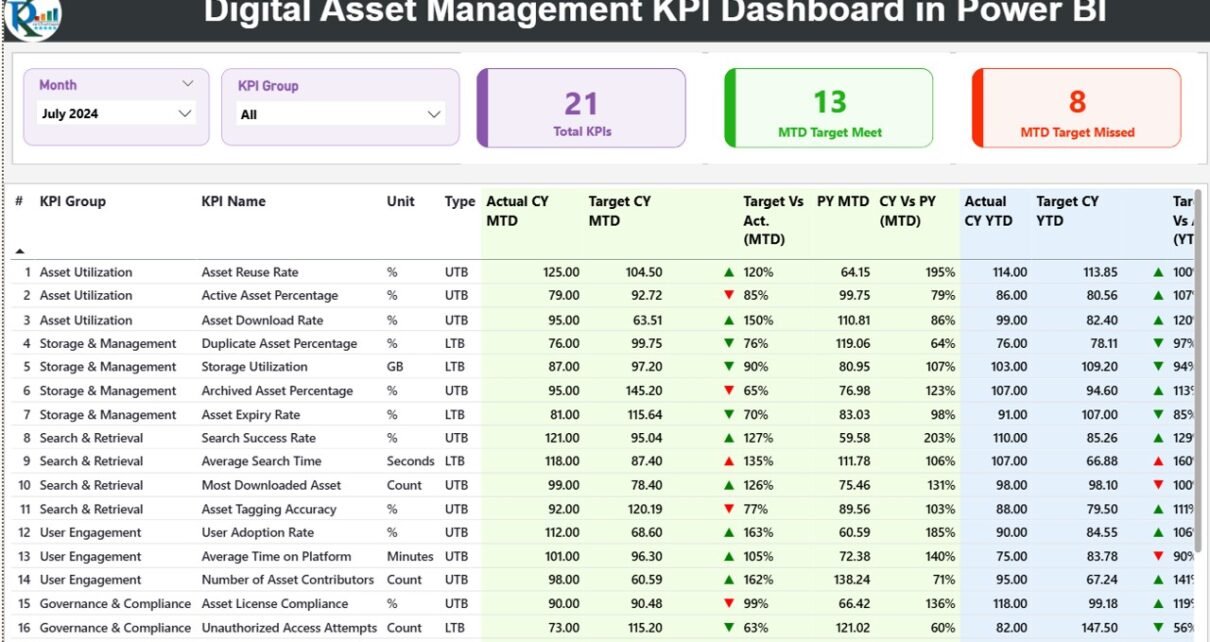
Digital Asset Management KPI Dashboard in Power BI

November 25, 2025November 25, 2025 PKComments Off on Digital Asset Management KPI Dashboard in Power BI
Digital teams manage thousands of assets every day. Images, videos, documents, creative files, and digital resources keep increasing. When the volume grows, teams face challenges with tracking usage, performance, approvals,
Read More
Dashboard Power BI

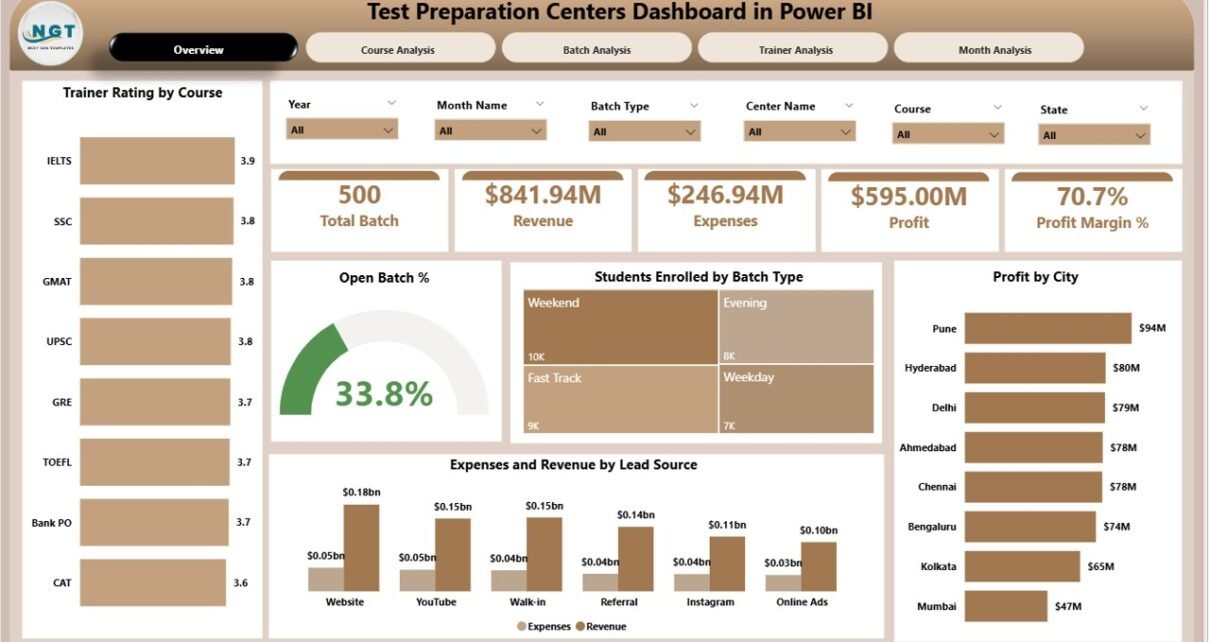
Test Preparation Centres Dashboard in Power BI

November 23, 2025November 23, 2025 PKComments Off on Test Preparation Centres Dashboard in Power BI
Running a test preparation centre demands careful planning, real-time insights, and quick decision-making. Students expect organised batches, skilled trainers, and smooth learning experiences. However, centres handle large volumes of information
Read More
Dashboard

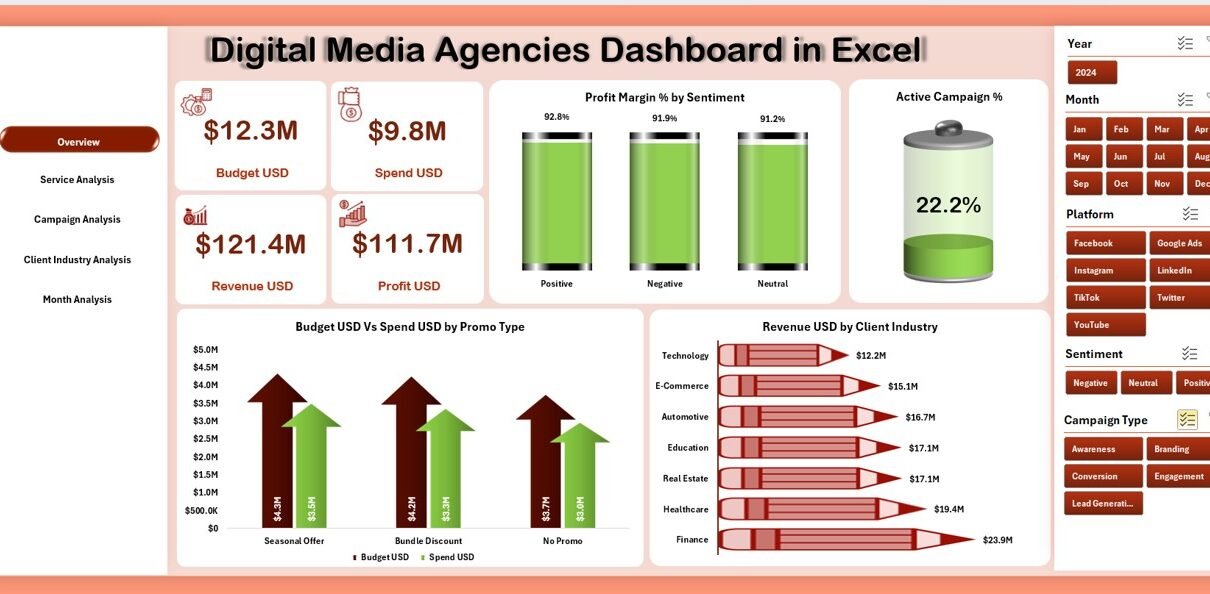
Digital Media Agencies Dashboard in Excel

November 22, 2025November 22, 2025 PKComments Off on Digital Media Agencies Dashboard in Excel
Digital media agencies handle multiple clients, campaigns, platforms, deliverables, and performance indicators every day. Because of this fast-paced environment, managers, analysts, and decision-makers need reliable tools that provide quick insights
Read More
Dashboard

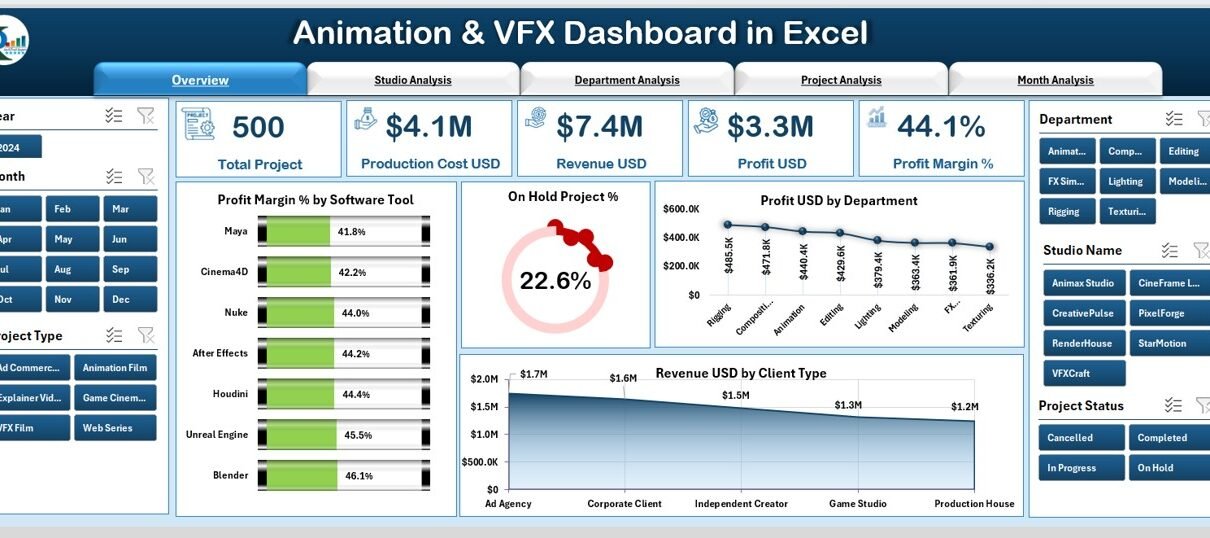
Animation & VFX Dashboard in Excel

November 22, 2025November 22, 2025 PKComments Off on Animation & VFX Dashboard in Excel
Animation and VFX studios work on fast-moving projects, tight timelines, complex revisions, and multiple creative departments. Because of this, managers need a clear view of project status, revenue, production cost,
Read More
Dashboard Power BI

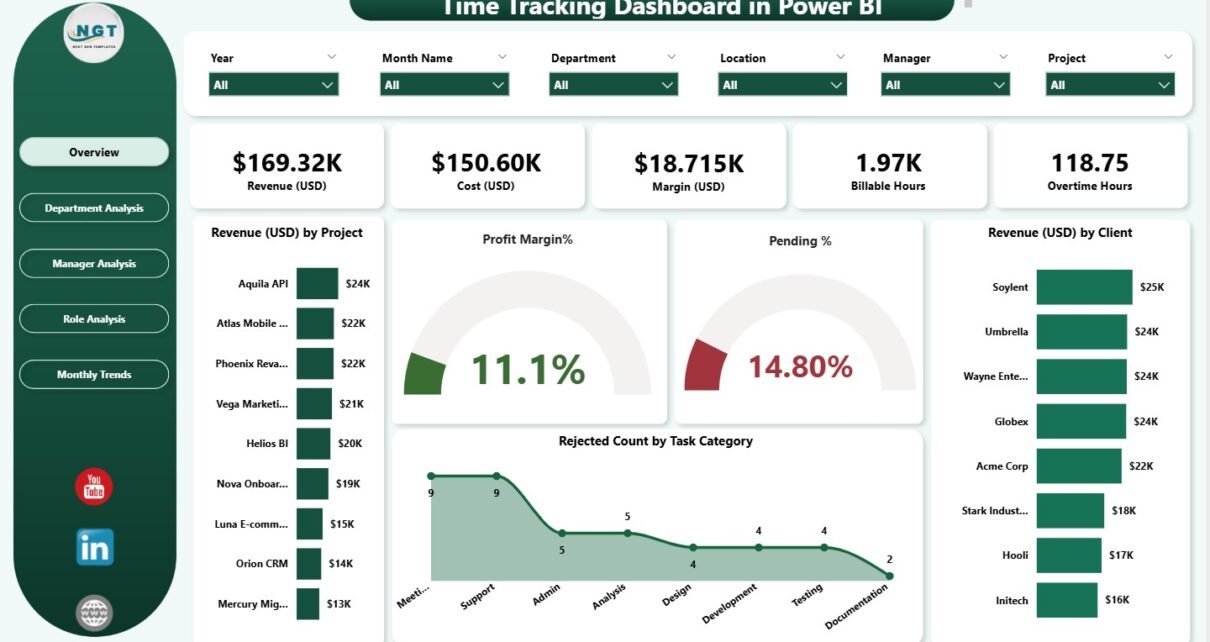
Time Tracking Dashboard in Power BI

November 20, 2025November 20, 2025 PKComments Off on Time Tracking Dashboard in Power BI
Every organization needs accurate time tracking to improve productivity, manage projects, reduce overtime costs, allocate resources effectively, and measure employee performance. However, teams often depend on manual spreadsheets or disconnected
Read More
Dashboard Power BI

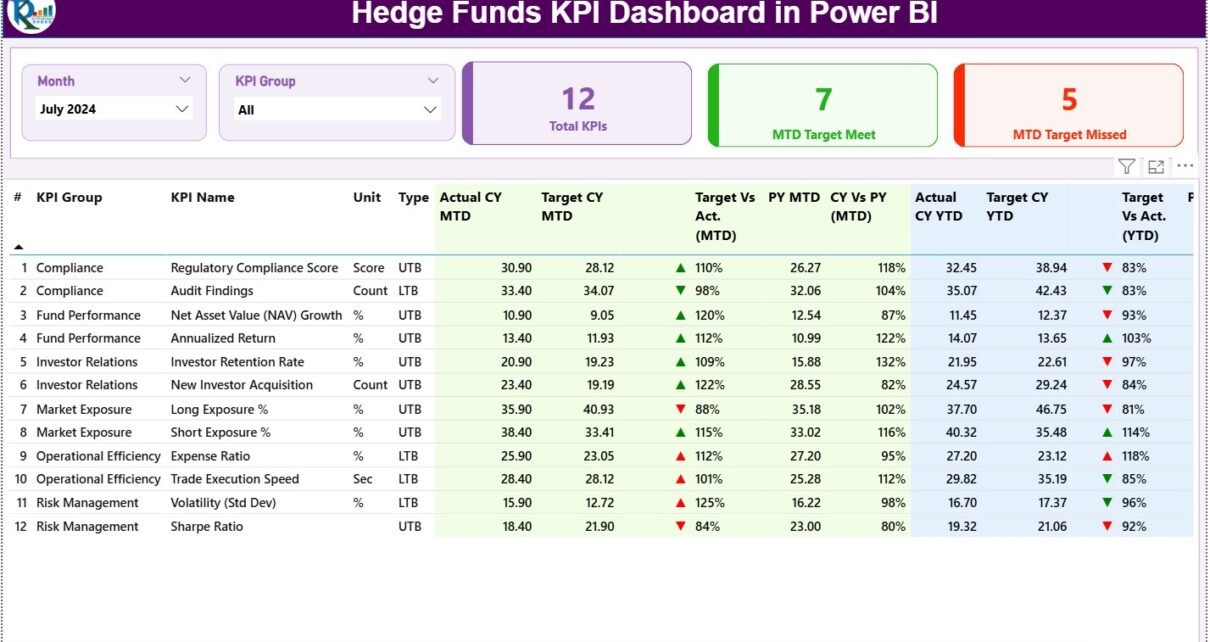
Hedge Funds KPI Dashboard in Power BI

November 17, 2025November 17, 2025 PKComments Off on Hedge Funds KPI Dashboard in Power BI
A Hedge Funds KPI Dashboard in Power BI is a ready-to-use, interactive reporting system designed to measure key investment performance indicators across multiple funds. It gives you a clear view
Read More
Templates

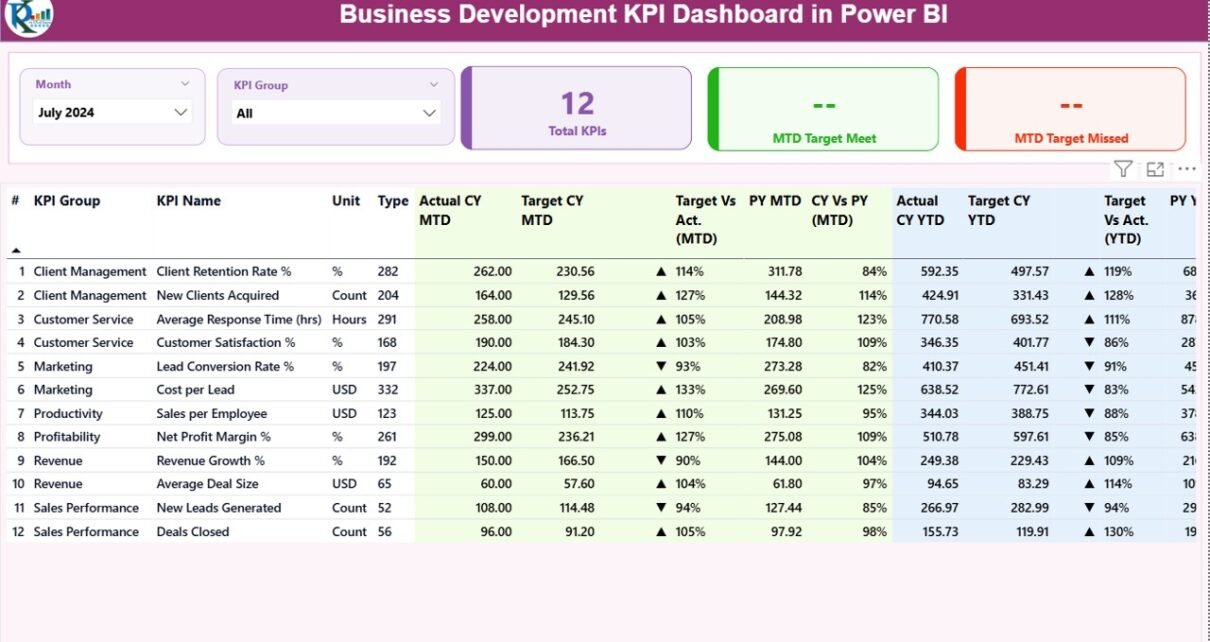
Business Development KPI Dashboard in Power BI

November 16, 2025November 16, 2025 PKComments Off on Business Development KPI Dashboard in Power BI
Business development teams work in a high-pressure environment where every lead, every opportunity, and every conversion matters. However, many organizations still track their KPIs through scattered spreadsheets, inconsistent reports, or
Read More

Posts pagination

Previous 1 … 30 31 32 … 83 Next
  • Learn Excel (Free Course)
    • 1. Shortcut Keys
    • 2. Fill & Flash Fill
    • 3. Find & Replace
    • 4. Sort & Filter
    • 5. Formulas & Functions
    • 6. Data Validation
    • 7. Conditional Formatting
    • 8. Basic Charts
    • 9. Advanced Charts
    • 10. Pivot Tables
    • 11. Excel Dashboards
    • 12. VBA Course
    • 13. Excel Formulas with AI
  • Templates
  • Tutorials
    • Charts and Visualization
    • VBA
    • Excel Tips and Tricks
    • Excel Dashboards
    • Power Pivot & DAX
  • Power BI
  • Template Store
    • Ready to Use Templates
  • Courses
  • Academy
    • Excel + AI Mastery: 100 Formulas
    • Excel Pivot Tables & Dashboards
  • About Us
  • Contact Us
Copyright © 2023 PK-AnExcelExpert.com - Privacy Policy