New: NextGenTemplates Academy - video courses on Excel formulas with AI and Pivot Tables & dashboards. Early-bird: 20% off with code EARLYBIRD20 - first 20 orders only. See the courses →
  • Learn Excel (Free Course)
    • 1. Shortcut Keys
    • 2. Fill & Flash Fill
    • 3. Find & Replace
    • 4. Sort & Filter
    • 5. Formulas & Functions
    • 6. Data Validation
    • 7. Conditional Formatting
    • 8. Basic Charts
    • 9. Advanced Charts
    • 10. Pivot Tables
    • 11. Excel Dashboards
    • 12. VBA Course
    • 13. Excel Formulas with AI
  • Templates
  • Tutorials
    • Charts and Visualization
    • VBA
    • Excel Tips and Tricks
    • Excel Dashboards
    • Power Pivot & DAX
  • Power BI
  • Template Store
    • Ready to Use Templates
  • Courses
  • Academy
    • Excel + AI Mastery: 100 Formulas
    • Excel Pivot Tables & Dashboards
  • About Us
  • Contact Us

PK: An Excel Expert

Transforming Data into Decisions

Tag: KPI Dashboard

Templates

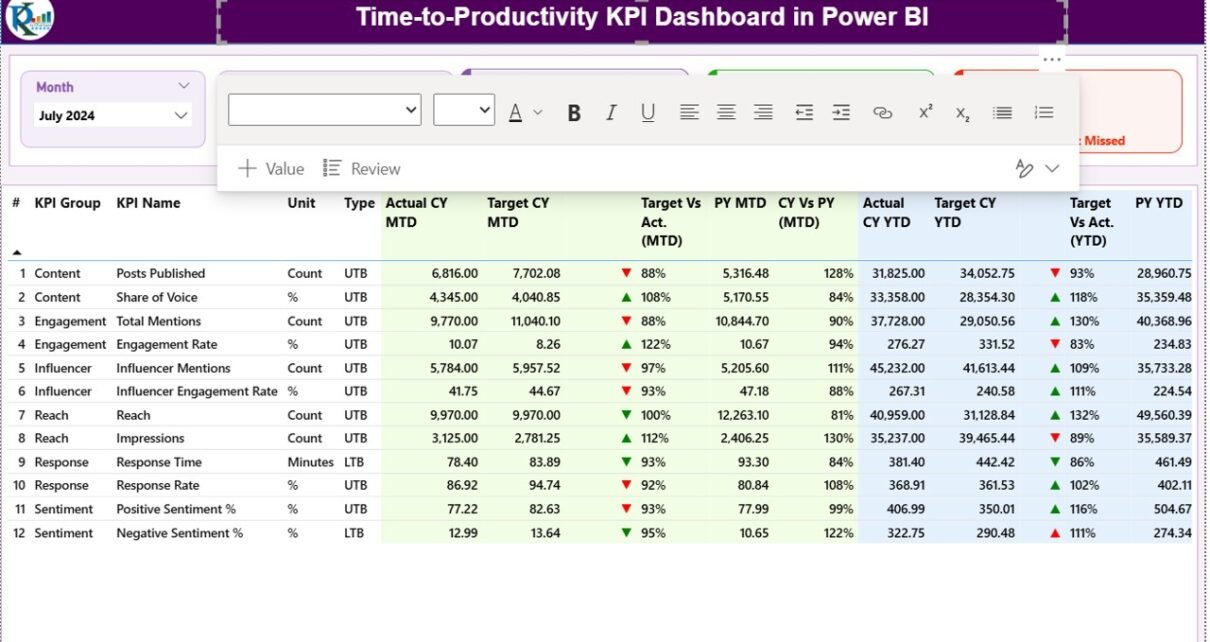
Time-to-Productivity KPI Dashboard in Power BI

November 1, 2025November 1, 2025 PKComments Off on Time-to-Productivity KPI Dashboard in Power BI
In the fast-paced business world, organizations invest heavily in hiring, onboarding, and training new employees. However, one of the biggest challenges companies face is understanding how long it takes for
Read More
Dashboard

Agri Tech Startups KPI Dashboard in Excel

November 1, 2025November 1, 2025 PKComments Off on Agri Tech Startups KPI Dashboard in Excel
In the fast-evolving world of agriculture, data-driven innovation has become the foundation of success. With the rise of Agri Tech startups, farmers, agronomists, and agribusiness professionals are adopting digital tools
Read More
Dashboard Power BI

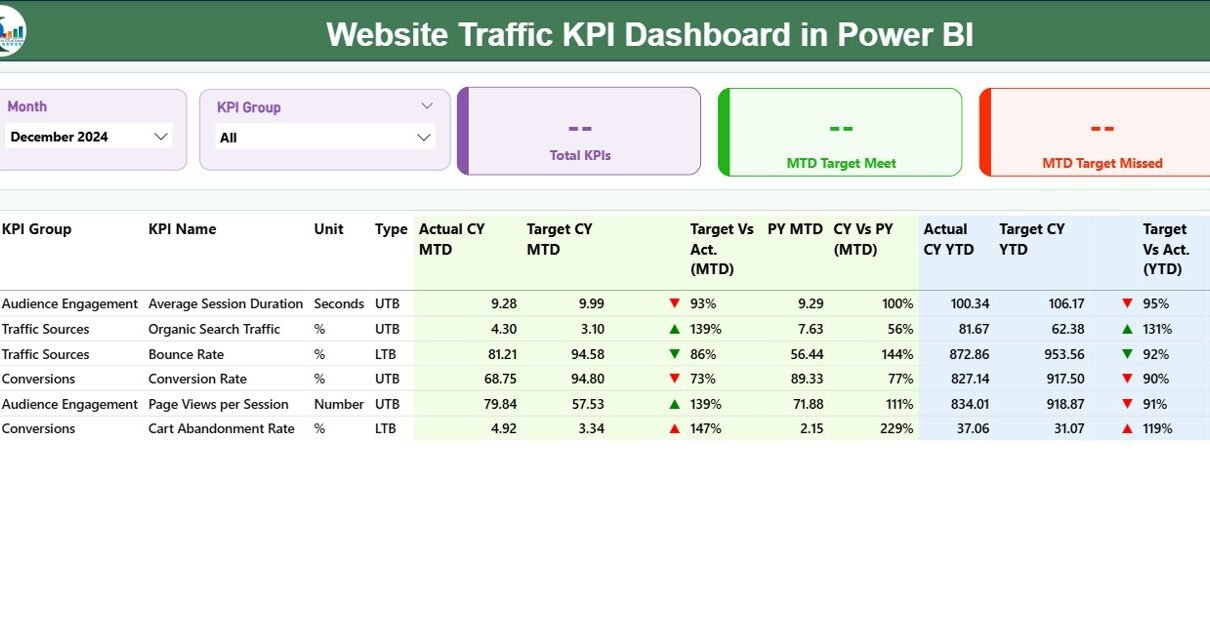
Website Traffic KPI Dashboard in Power BI

November 1, 2025November 1, 2025 PKComments Off on Website Traffic KPI Dashboard in Power BI
In today’s digital age, a business’s success depends heavily on its website traffic performance. Whether you manage an e-commerce store, a content platform, or a corporate site, understanding how visitors
Read More
Dashboard

Payment Gateways Dashboard in Excel

October 31, 2025October 31, 2025 PKComments Off on Payment Gateways Dashboard in Excel
In today’s digital world, businesses rely heavily on online payments. From e-commerce platforms to subscription services, payment gateways are the lifeline of revenue operations. However, managing multiple gateways, monitoring transaction
Read More
Dashboard Power BI

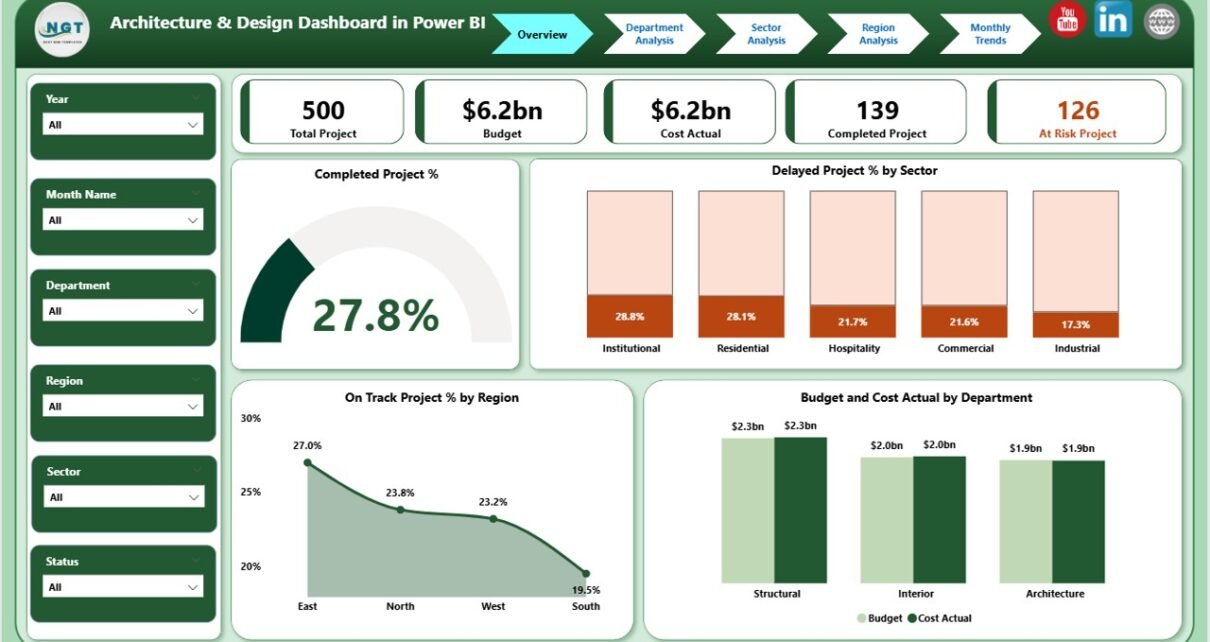
Architecture & Design Dashboard in Power BI

October 30, 2025October 30, 2025 PKComments Off on Architecture & Design Dashboard in Power BI
In today’s world, architecture and design firms handle dozens of projects simultaneously — each with unique budgets, deadlines, and design phases. Managing these projects manually or through scattered spreadsheets often
Read More
Dashboard Power BI

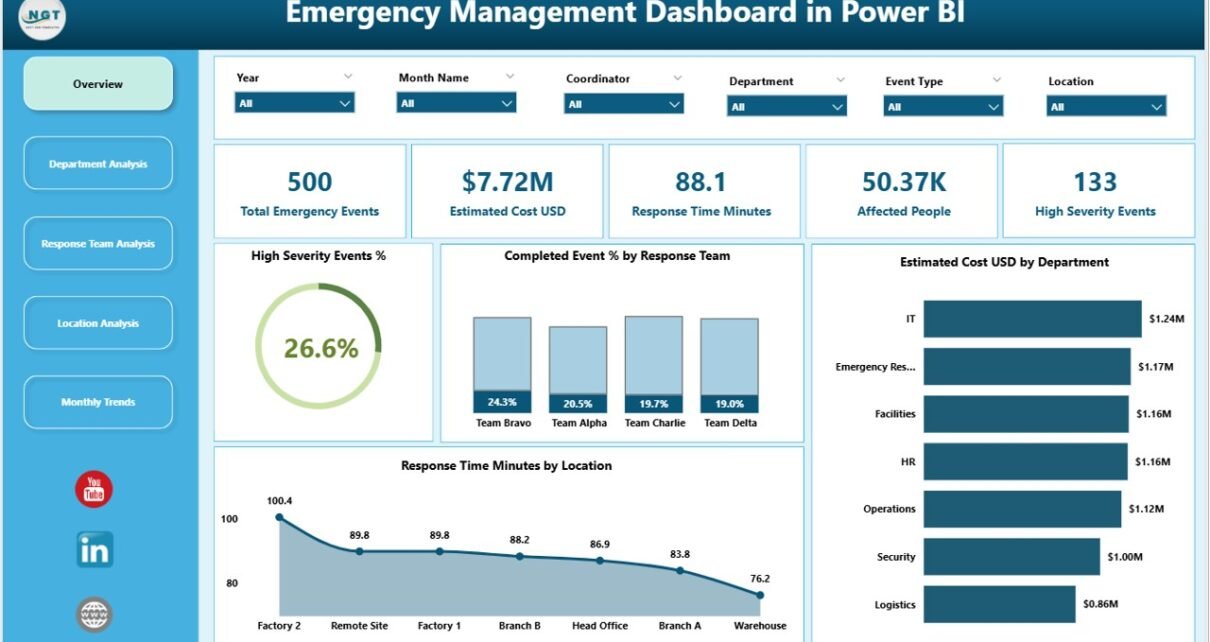
Emergency Management Dashboard in Power BI

October 30, 2025October 30, 2025 PKComments Off on Emergency Management Dashboard in Power BI
In today’s unpredictable world, organizations face many emergencies—natural disasters, workplace accidents, public health crises, or system failures. Managing these incidents efficiently requires real-time data visibility, coordinated decision-making, and fast response
Read More
Dashboard

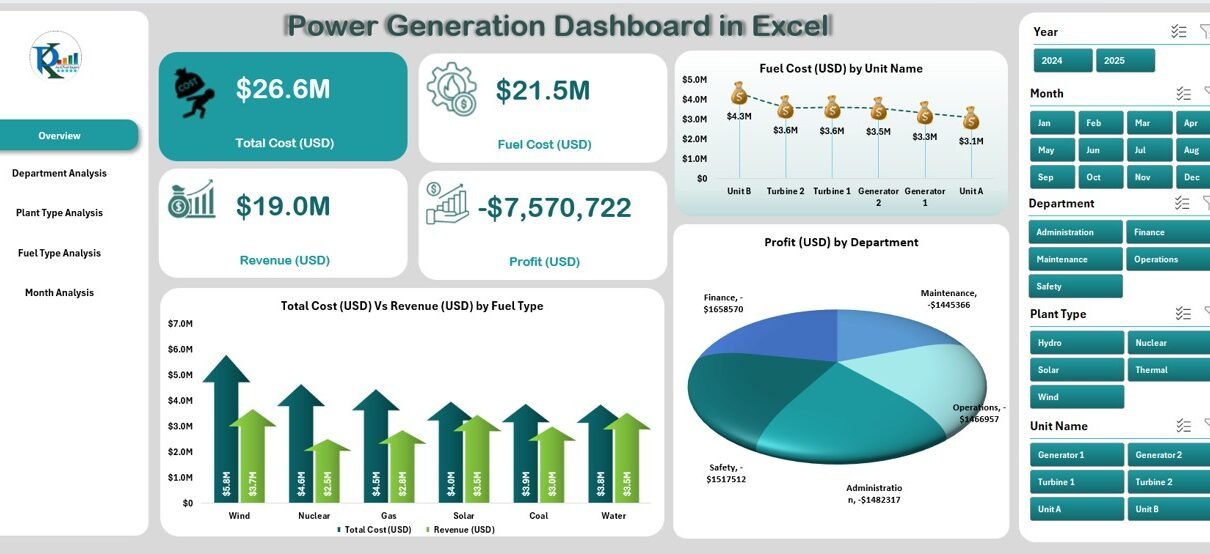
Power Generation Dashboard in Excel

October 30, 2025October 30, 2025 PKComments Off on Power Generation Dashboard in Excel
In today’s energy-driven economy, power generation companies handle complex data daily. From fuel costs and plant types to energy output and profitability, every metric plays a role in operational efficiency
Read More
Templates

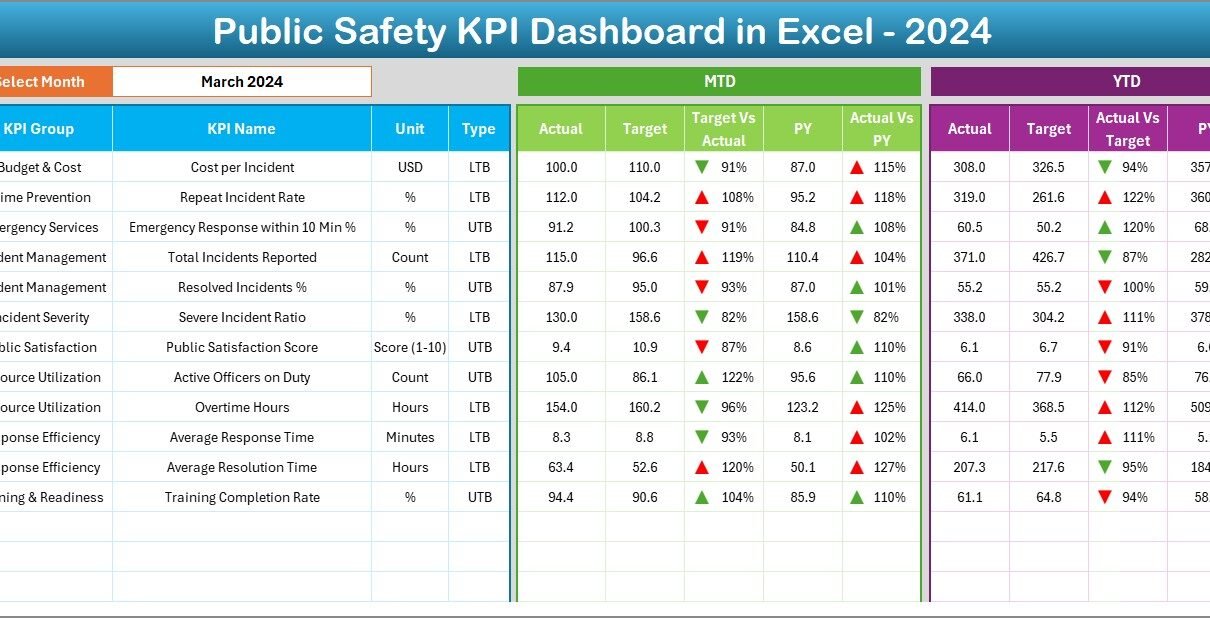
Public Safety KPI Dashboard in Excel

October 29, 2025October 29, 2025 PKComments Off on Public Safety KPI Dashboard in Excel
Ensuring public safety is one of the most critical responsibilities of any government, municipality, or community organization. Whether managing emergency services, monitoring crime rates, or ensuring disaster readiness, public safety
Read More
Templates

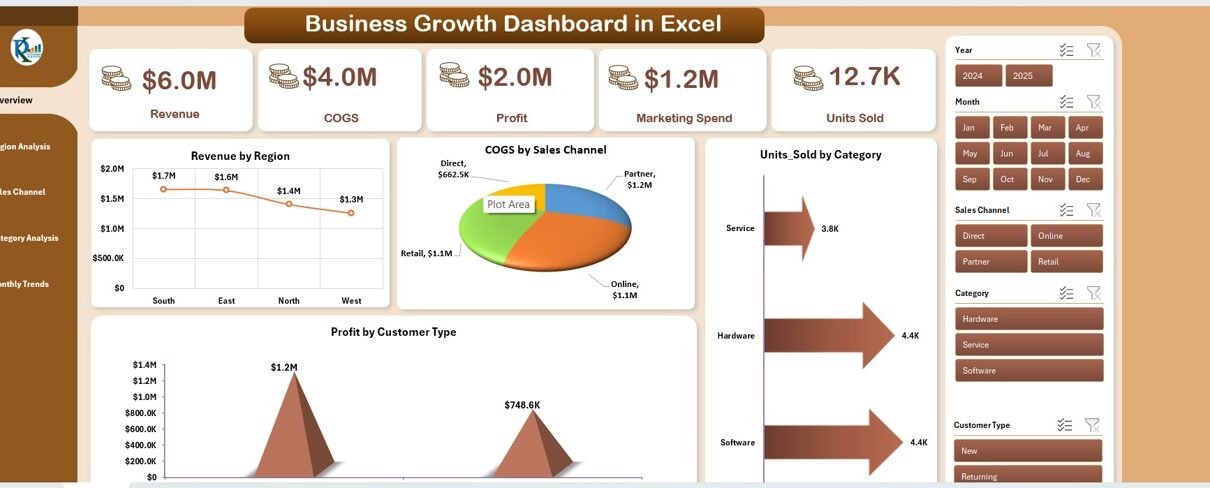
Business Growth Dashboard in Excel

October 28, 2025October 28, 2025 PKComments Off on Business Growth Dashboard in Excel
Every business dreams of growth, but managing that growth efficiently requires accurate insights, timely data, and actionable performance metrics. This is where the Business Growth Dashboard in Excel becomes a
Read More
Templates

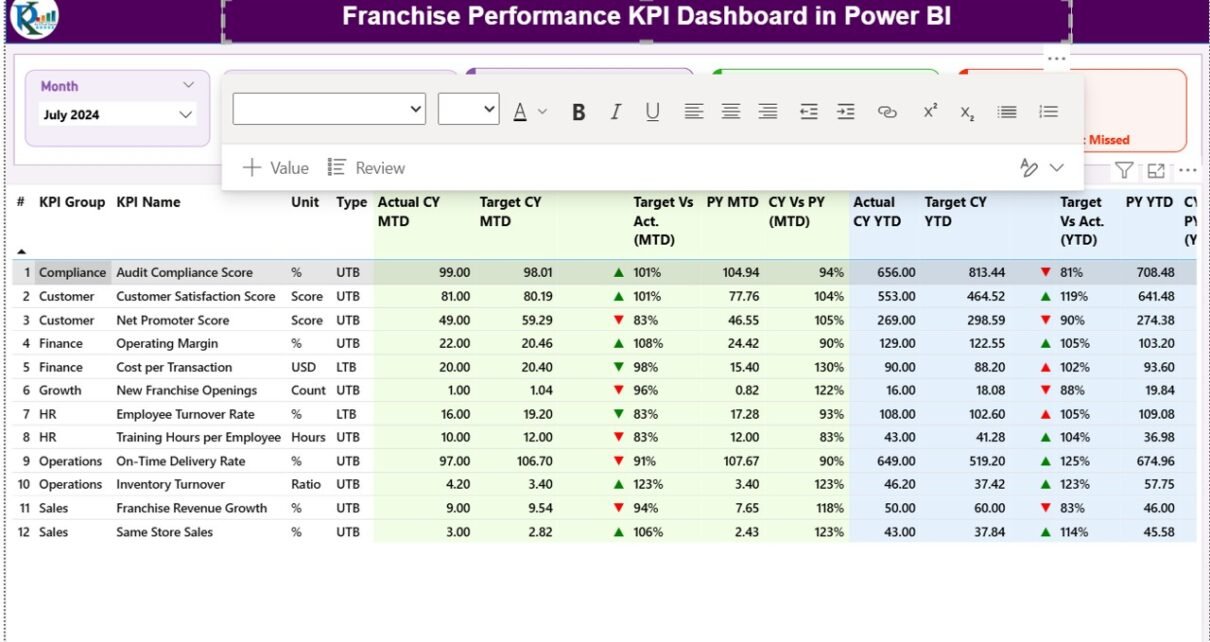
Franchise Performance KPI Dashboard in Power BI

October 27, 2025October 27, 2025 PKComments Off on Franchise Performance KPI Dashboard in Power BI
In today’s competitive franchise industry, monitoring performance across multiple branches or outlets is crucial. Whether you manage a global restaurant chain, a fitness brand, or a retail network, having clear
Read More

Posts pagination

Previous 1 … 33 34 35 … 83 Next
  • Learn Excel (Free Course)
    • 1. Shortcut Keys
    • 2. Fill & Flash Fill
    • 3. Find & Replace
    • 4. Sort & Filter
    • 5. Formulas & Functions
    • 6. Data Validation
    • 7. Conditional Formatting
    • 8. Basic Charts
    • 9. Advanced Charts
    • 10. Pivot Tables
    • 11. Excel Dashboards
    • 12. VBA Course
    • 13. Excel Formulas with AI
  • Templates
  • Tutorials
    • Charts and Visualization
    • VBA
    • Excel Tips and Tricks
    • Excel Dashboards
    • Power Pivot & DAX
  • Power BI
  • Template Store
    • Ready to Use Templates
  • Courses
  • Academy
    • Excel + AI Mastery: 100 Formulas
    • Excel Pivot Tables & Dashboards
  • About Us
  • Contact Us
Copyright © 2023 PK-AnExcelExpert.com - Privacy Policy