New: NextGenTemplates Academy - video courses on Excel formulas with AI and Pivot Tables & dashboards. Early-bird: 20% off with code EARLYBIRD20 - first 20 orders only. See the courses →
  • Learn Excel (Free Course)
    • 1. Shortcut Keys
    • 2. Fill & Flash Fill
    • 3. Find & Replace
    • 4. Sort & Filter
    • 5. Formulas & Functions
    • 6. Data Validation
    • 7. Conditional Formatting
    • 8. Basic Charts
    • 9. Advanced Charts
    • 10. Pivot Tables
    • 11. Excel Dashboards
    • 12. VBA Course
    • 13. Excel Formulas with AI
  • Templates
  • Tutorials
    • Charts and Visualization
    • VBA
    • Excel Tips and Tricks
    • Excel Dashboards
    • Power Pivot & DAX
  • Power BI
  • Template Store
    • Ready to Use Templates
  • Courses
  • Academy
    • Excel + AI Mastery: 100 Formulas
    • Excel Pivot Tables & Dashboards
  • About Us
  • Contact Us

PK: An Excel Expert

Transforming Data into Decisions

Tag: KPI Dashboard

Dashboard

Waste Reduction KPI Dashboard in Excel

February 16, 2025March 18, 2025 PKComments Off on Waste Reduction KPI Dashboard in Excel
In today's business environment, sustainability is more than just a buzzword—it is an essential practice for companies looking to optimize operations and minimize waste. Measuring waste reduction is crucial for
Read More
Dashboard

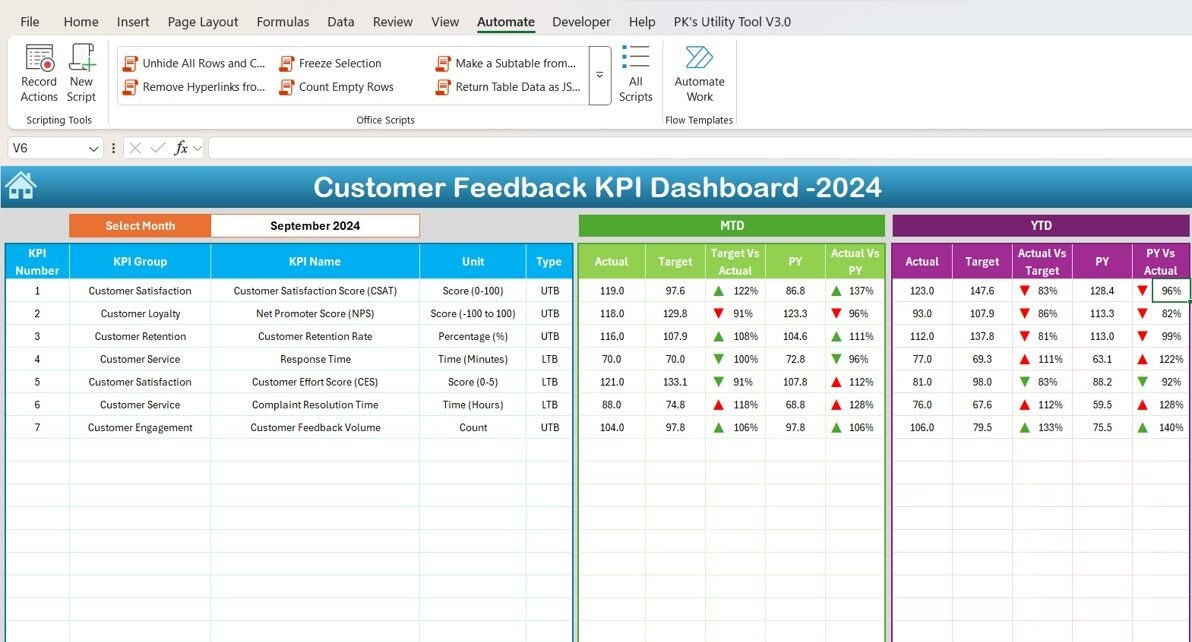
Customer Feedback KPI Dashboard in Excel

February 15, 2025March 19, 2025 PKComments Off on Customer Feedback KPI Dashboard in Excel
In today’s customer-centric business environment, tracking and improving customer feedback is more important than ever. A Customer Feedback KPI Dashboard is a powerful tool that helps businesses monitor and analyze
Read More
Dashboard

Cross-Selling KPI Dashboard in Excel

February 15, 2025April 6, 2025 PKComments Off on Cross-Selling KPI Dashboard in Excel
In today’s fast-paced business environment, companies are continuously looking for ways to optimize their sales strategies. One of the most effective ways to do this is through cross-selling. Cross-selling allows
Read More
Dashboard

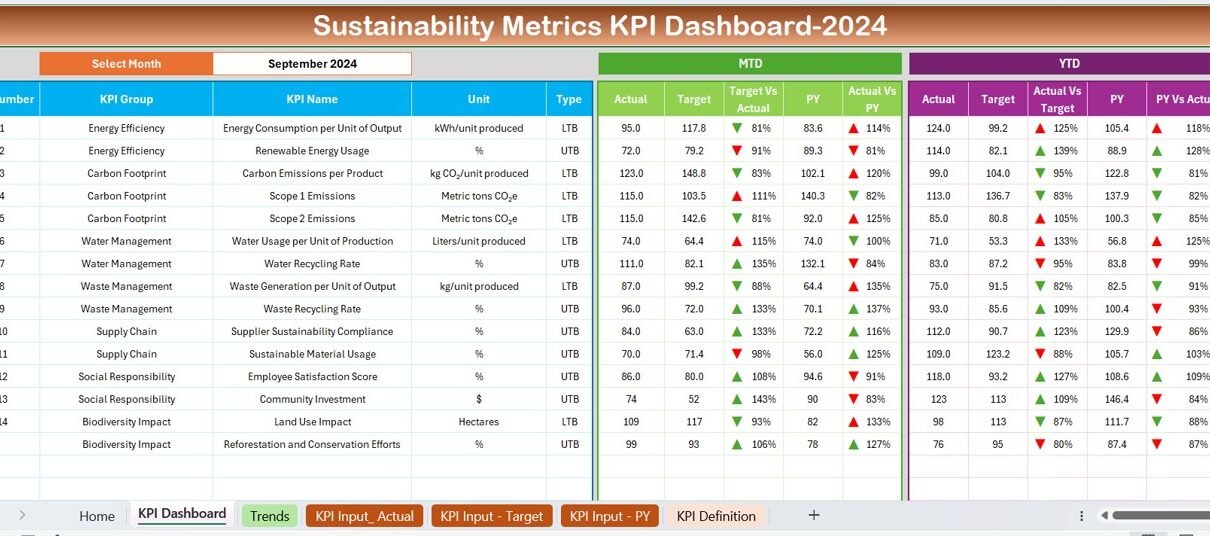
Sustainability Metrics KPI Dashboard in Excel

February 14, 2025March 19, 2025 PKComments Off on Sustainability Metrics KPI Dashboard in Excel
Sustainability is more than just a trend; it has become an essential part of business operations. Companies across industries are increasingly focusing on sustainability initiatives to reduce their environmental impact
Read More
Dashboard

Business Intelligence KPI Dashboard in Excel

February 14, 2025March 19, 2025 PKComments Off on Business Intelligence KPI Dashboard in Excel
In today's fast-paced business world, tracking performance is more important than ever. A Business Intelligence KPI Dashboard in Excel helps businesses monitor key performance indicators (KPIs) efficiently. It provides real-time
Read More
Dashboard

Google Analytics KPI Dashboard in Excel

February 14, 2025March 18, 2025 PKComments Off on Google Analytics KPI Dashboard in Excel
In today's digital world, tracking website performance is essential. Google Analytics provides tons of useful data, but it can sometimes feel overwhelming. That’s where Excel dashboards come in handy. With
Read More
Power BI

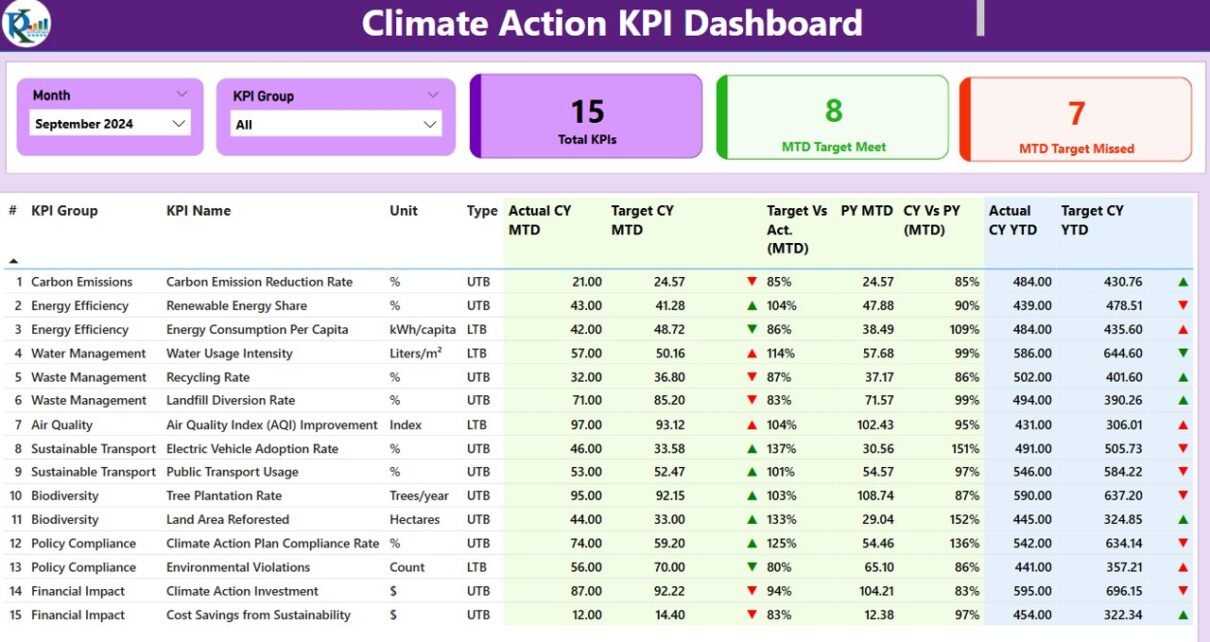
Climate Action KPI Dashboard in Power BI

February 13, 2025March 19, 2025 PKComments Off on Climate Action KPI Dashboard in Power BI
Climate change is one of the most pressing challenges of our time. Organizations and governments worldwide are striving to monitor and manage their environmental impact effectively. One of the best
Read More
Dashboard

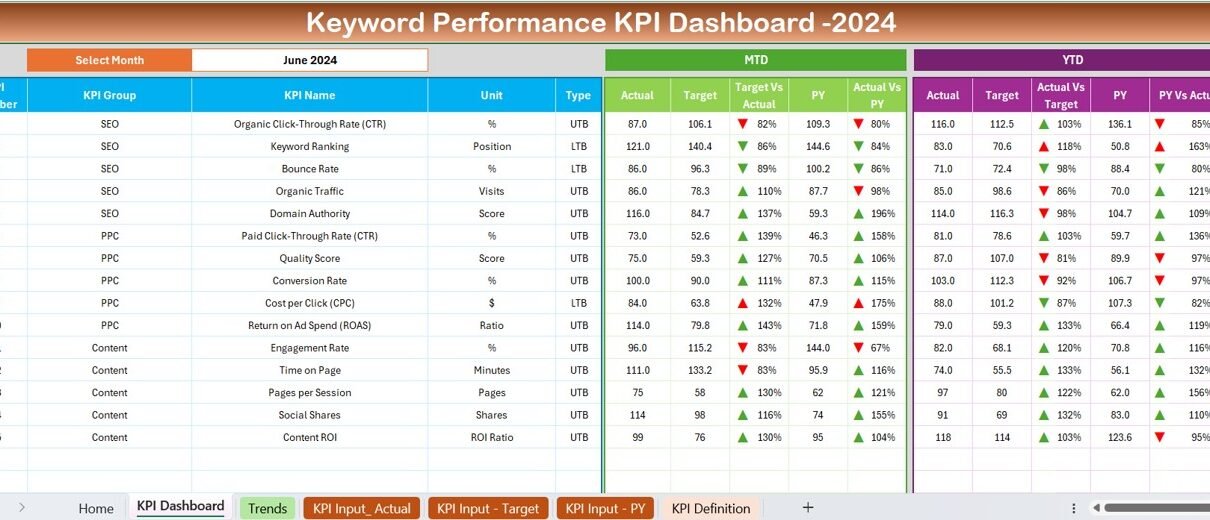
Keyword Performance KPI Dashboard in Excel

February 13, 2025March 19, 2025 PKComments Off on Keyword Performance KPI Dashboard in Excel
In the competitive world of digital marketing, tracking keyword performance is essential for measuring the effectiveness of your SEO strategy. A Keyword Performance KPI Dashboard in Excel helps you monitor
Read More
Dashboard

Customer Churn KPI Dashboard in Excel

February 13, 2025March 19, 2025 PKComments Off on Customer Churn KPI Dashboard in Excel
Customer churn is one of the most critical metrics for businesses today. A high churn rate can indicate poor customer satisfaction, ineffective services, or even product flaws. Tracking this metric,
Read More
Dashboard

A/B Testing KPI Dashboard in Excel

February 13, 2025March 19, 2025 PKComments Off on A/B Testing KPI Dashboard in Excel
In the world of data-driven decision-making, A/B testing plays a crucial role in optimizing performance and improving outcomes. However, managing and analyzing A/B test results can be challenging without a
Read More

Posts pagination

Previous 1 … 56 57 58 … 83 Next
  • Learn Excel (Free Course)
    • 1. Shortcut Keys
    • 2. Fill & Flash Fill
    • 3. Find & Replace
    • 4. Sort & Filter
    • 5. Formulas & Functions
    • 6. Data Validation
    • 7. Conditional Formatting
    • 8. Basic Charts
    • 9. Advanced Charts
    • 10. Pivot Tables
    • 11. Excel Dashboards
    • 12. VBA Course
    • 13. Excel Formulas with AI
  • Templates
  • Tutorials
    • Charts and Visualization
    • VBA
    • Excel Tips and Tricks
    • Excel Dashboards
    • Power Pivot & DAX
  • Power BI
  • Template Store
    • Ready to Use Templates
  • Courses
  • Academy
    • Excel + AI Mastery: 100 Formulas
    • Excel Pivot Tables & Dashboards
  • About Us
  • Contact Us
Copyright © 2023 PK-AnExcelExpert.com - Privacy Policy