New: NextGenTemplates Academy - video courses on Excel formulas with AI and Pivot Tables & dashboards. Early-bird: 20% off with code EARLYBIRD20 - first 20 orders only. See the courses →
  • Learn Excel (Free Course)
    • 1. Shortcut Keys
    • 2. Fill & Flash Fill
    • 3. Find & Replace
    • 4. Sort & Filter
    • 5. Formulas & Functions
    • 6. Data Validation
    • 7. Conditional Formatting
    • 8. Basic Charts
    • 9. Advanced Charts
    • 10. Pivot Tables
    • 11. Excel Dashboards
    • 12. VBA Course
    • 13. Excel Formulas with AI
  • Templates
  • Tutorials
    • Charts and Visualization
    • VBA
    • Excel Tips and Tricks
    • Excel Dashboards
    • Power Pivot & DAX
  • Power BI
  • Template Store
    • Ready to Use Templates
  • Courses
  • Academy
    • Excel + AI Mastery: 100 Formulas
    • Excel Pivot Tables & Dashboards
  • About Us
  • Contact Us

PK: An Excel Expert

Transforming Data into Decisions

Tag: KPI Dashboard

Dashboard

Knowledge Base KPI Dashboard in Excel

February 13, 2025March 19, 2025 PKComments Off on Knowledge Base KPI Dashboard in Excel
In the world of data-driven decision-making, Key Performance Indicators (KPIs) play a crucial role in measuring success and guiding business strategies. A Knowledge Base KPI Dashboard is a powerful tool
Read More
Dashboard

Lead Nurturing KPI Dashboard in Excel

February 12, 2025March 20, 2025 PKComments Off on Lead Nurturing KPI Dashboard in Excel
Tracking and optimizing lead nurturing efforts is essential for businesses aiming to improve their conversion rates. A Lead Nurturing KPI Dashboard in Excel helps marketers and sales teams analyze performance,
Read More
Dashboard

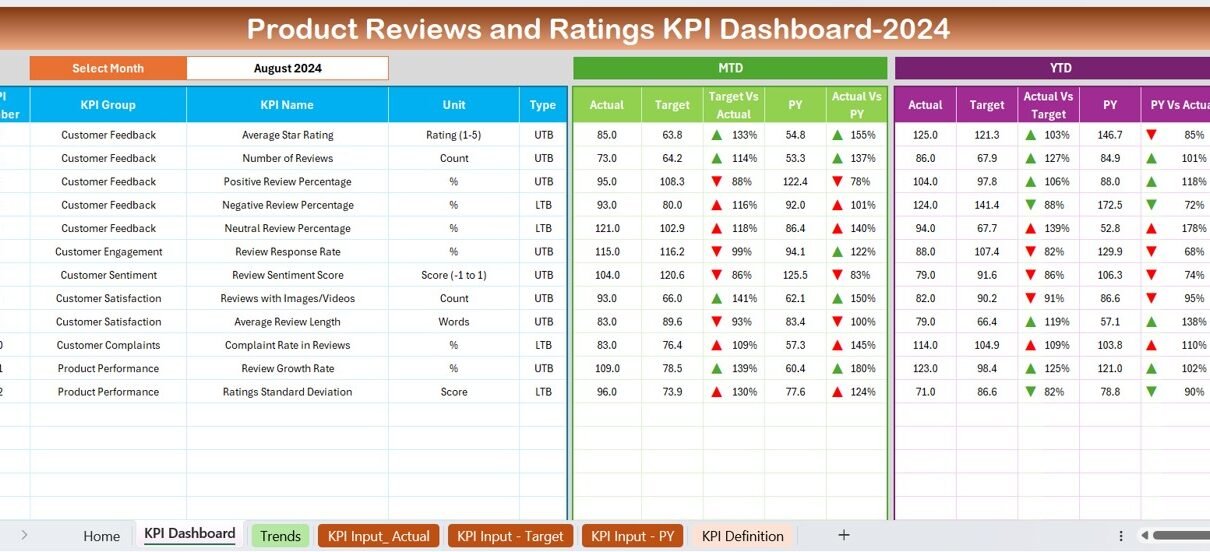
Product Reviews and Ratings KPI Dashboard in Excel

February 12, 2025April 7, 2025 PKComments Off on Product Reviews and Ratings KPI Dashboard in Excel
In the digital age, customer feedback plays a critical role in determining a product's success. Businesses rely on Product Reviews and Ratings KPI Dashboards to analyze and improve their offerings
Read More
Power BI

Public Health KPI Dashboard in Power BI

February 12, 2025March 22, 2025 PKComments Off on Public Health KPI Dashboard in Power BI
Tracking and improving public health metrics is more important than ever. With the right tools, healthcare professionals, policymakers, and administrators can make data-driven decisions that positively impact communities. A Public
Read More
Dashboard

Customer Journey Mapping KPI Dashboard in Excel

February 11, 2025March 20, 2025 PKComments Off on Customer Journey Mapping KPI Dashboard in Excel
Tracking and improving customer experience is critical for business success. However, understanding customer behavior at different touchpoints can be overwhelming. That’s where a Customer Journey Mapping KPI Dashboard in Excel
Read More
Power BI

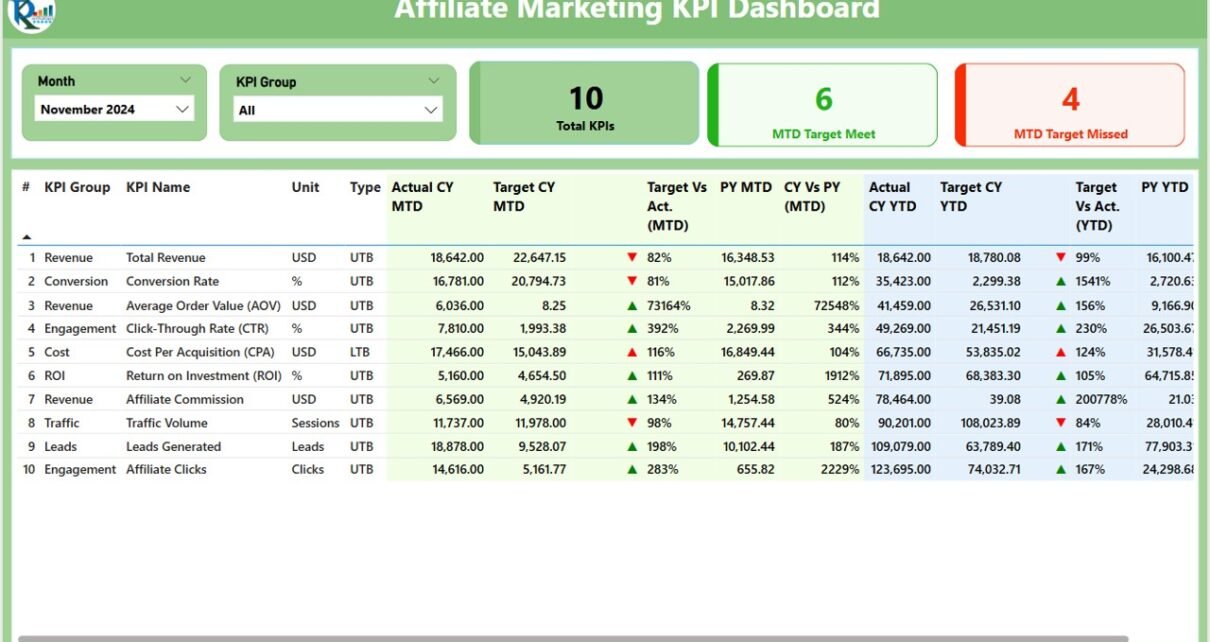
Affiliate Marketing KPI Dashboard in Power BI

February 10, 2025April 7, 2025 PKComments Off on Affiliate Marketing KPI Dashboard in Power BI
Affiliate marketing has emerged as one of the most effective digital marketing strategies. With its performance-based model, it offers flexibility, scalability, and the potential for significant returns. However, like any
Read More
Dashboard

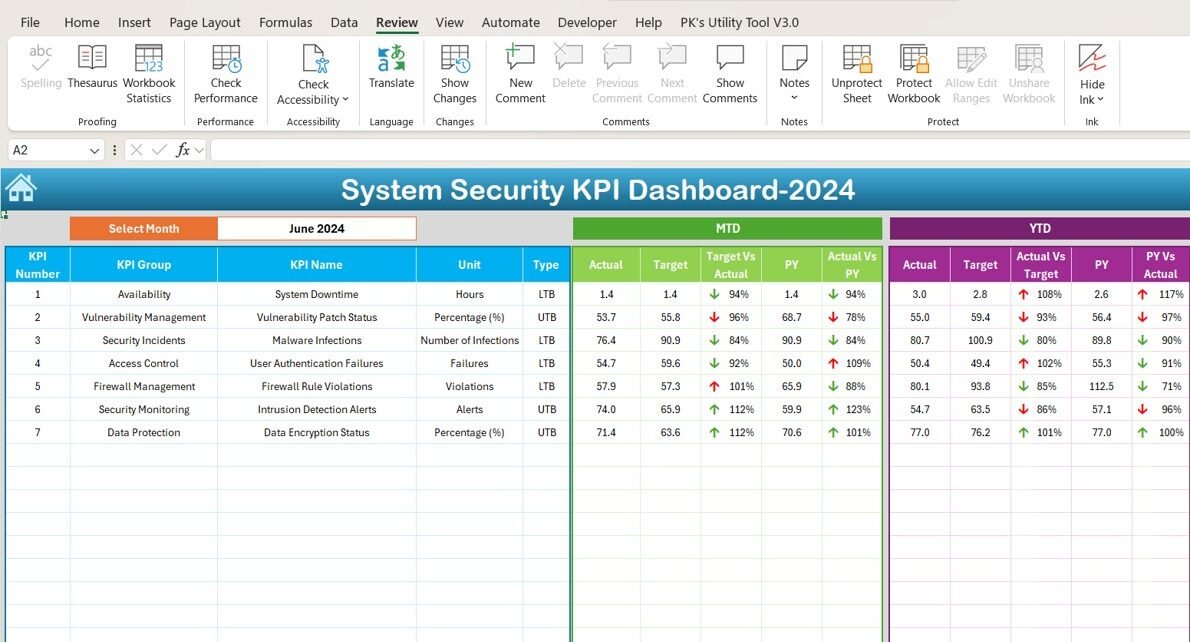
System Security KPI Dashboard in Excel

February 10, 2025March 23, 2025 PKComments Off on System Security KPI Dashboard in Excel
In an era where cybersecurity is at the forefront of business operations, understanding and managing security performance is critical. The System Security KPI Dashboard is a powerful tool that allows
Read More
Dashboard

Network Performance KPI Dashboard in Excel

February 10, 2025March 30, 2025 PKComments Off on Network Performance KPI Dashboard in Excel
In today’s data-driven world, businesses are increasingly relying on Key Performance Indicators (KPIs) to measure the performance of their networks. The Network Performance KPI Dashboard is an essential tool to
Read More
Dashboard

Claim Settlement KPI Dashboard in Excel

February 9, 2025March 19, 2025 PKComments Off on Claim Settlement KPI Dashboard in Excel
In the fast-moving world of insurance, keeping track of claim settlements is essential. A Claim Settlement KPI Dashboard in Excel provides an efficient way to monitor key performance indicators (KPIs)
Read More
Dashboard

IT Operations KPI Dashboard in Excel

February 9, 2025March 30, 2025 PKComments Off on IT Operations KPI Dashboard in Excel
In today's rapidly evolving IT landscape, effective IT operations management plays a crucial role in ensuring that technology services run smoothly, meet business objectives, and support organizational growth. One of
Read More

Posts pagination

Previous 1 … 57 58 59 … 83 Next
  • Learn Excel (Free Course)
    • 1. Shortcut Keys
    • 2. Fill & Flash Fill
    • 3. Find & Replace
    • 4. Sort & Filter
    • 5. Formulas & Functions
    • 6. Data Validation
    • 7. Conditional Formatting
    • 8. Basic Charts
    • 9. Advanced Charts
    • 10. Pivot Tables
    • 11. Excel Dashboards
    • 12. VBA Course
    • 13. Excel Formulas with AI
  • Templates
  • Tutorials
    • Charts and Visualization
    • VBA
    • Excel Tips and Tricks
    • Excel Dashboards
    • Power Pivot & DAX
  • Power BI
  • Template Store
    • Ready to Use Templates
  • Courses
  • Academy
    • Excel + AI Mastery: 100 Formulas
    • Excel Pivot Tables & Dashboards
  • About Us
  • Contact Us
Copyright © 2023 PK-AnExcelExpert.com - Privacy Policy