New: NextGenTemplates Academy - video courses on Excel formulas with AI and Pivot Tables & dashboards. Early-bird: 20% off with code EARLYBIRD20 - first 20 orders only. See the courses →
  • Learn Excel (Free Course)
    • 1. Shortcut Keys
    • 2. Fill & Flash Fill
    • 3. Find & Replace
    • 4. Sort & Filter
    • 5. Formulas & Functions
    • 6. Data Validation
    • 7. Conditional Formatting
    • 8. Basic Charts
    • 9. Advanced Charts
    • 10. Pivot Tables
    • 11. Excel Dashboards
    • 12. VBA Course
    • 13. Excel Formulas with AI
  • Templates
  • Tutorials
    • Charts and Visualization
    • VBA
    • Excel Tips and Tricks
    • Excel Dashboards
    • Power Pivot & DAX
  • Power BI
  • Template Store
    • Ready to Use Templates
  • Courses
  • Academy
    • Excel + AI Mastery: 100 Formulas
    • Excel Pivot Tables & Dashboards
  • About Us
  • Contact Us

PK: An Excel Expert

Transforming Data into Decisions

Tag: KPI Dashboard

Dashboard

Code Quality KPI Dashboard in Excel

February 9, 2025April 3, 2025 PKComments Off on Code Quality KPI Dashboard in Excel
In today's fast-paced tech environment, ensuring high-quality code is essential to meet user expectations and stay competitive. With the increasing complexity of software applications, managing code quality becomes a challenging
Read More
Power BI

Shared Services KPI Dashboard in Power BI

February 9, 2025March 22, 2025 PKComments Off on Shared Services KPI Dashboard in Power BI
In today’s data-driven world, organizations rely on Key Performance Indicators (KPIs) to measure performance and efficiency. The Shared Services KPI Dashboard in Power BI is a powerful tool that provides
Read More
Dashboard

Pension Fund KPI Dashboard in Excel

February 8, 2025March 20, 2025 PKComments Off on Pension Fund KPI Dashboard in Excel
Managing pension funds efficiently requires robust tracking of key performance indicators (KPIs). A Pension Fund KPI Dashboard in Excel is a powerful tool that provides real-time insights into fund performance,
Read More
Dashboard

Wealth Management KPI Dashboard in Excel

February 8, 2025March 20, 2025 PKComments Off on Wealth Management KPI Dashboard in Excel
In today's fast-paced financial world, effective wealth management requires robust Key Performance Indicators (KPIs) to track, analyze, and improve financial performance. A Wealth Management KPI Dashboard in Excel provides an
Read More
Dashboard

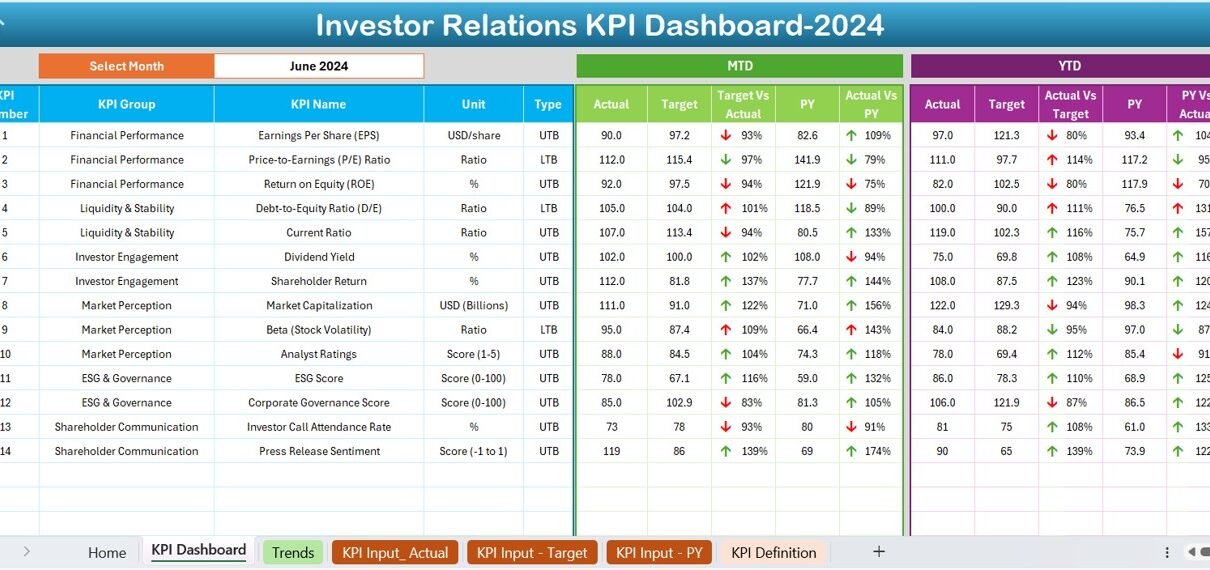
Investor Relations KPI Dashboard in Excel

February 7, 2025March 20, 2025 PKComments Off on Investor Relations KPI Dashboard in Excel
Investor relations (IR) play a crucial role in maintaining transparency and building trust with stakeholders. A well-structured Investor Relations KPI Dashboard in Excel helps track key financial metrics, measure performance,
Read More
Dashboard

Accounts Payable KPI Dashboard in Excel

February 7, 2025March 22, 2025 PKComments Off on Accounts Payable KPI Dashboard in Excel
Managing accounts payable efficiently is crucial for any business. It ensures timely payments, maintains healthy supplier relationships, and optimizes cash flow. To streamline this process, a well-structured Accounts Payable KPI
Read More
Dashboard

Financial Risk KPI Dashboard in Excel

February 7, 2025March 22, 2025 PKComments Off on Financial Risk KPI Dashboard in Excel
Managing financial risks is crucial for any business. Tracking key performance indicators (KPIs) helps organizations stay on top of potential risks and make informed decisions. The Financial Risk KPI Dashboard
Read More
Power BI

Circular Economy KPI Dashboard in Power BI

February 7, 2025March 23, 2025 PKComments Off on Circular Economy KPI Dashboard in Power BI
The circular economy is a critical concept in today’s world, aiming to reduce waste and make the most of available resources. Tracking the effectiveness of various sustainability efforts through Key
Read More
Dashboard

Budget Adherence KPI Dashboard in Excel

February 6, 2025March 20, 2025 PKComments Off on Budget Adherence KPI Dashboard in Excel
Managing a budget effectively is crucial for businesses of all sizes. A Budget Adherence KPI Dashboard in Excel helps monitor financial performance, compare actual spending with allocated budgets, and ensure
Read More
Dashboard

Debt-to-Equity Ratio KPI Dashboard in Excel

February 6, 2025March 20, 2025 PKComments Off on Debt-to-Equity Ratio KPI Dashboard in Excel
Managing financial health is crucial for any business. With the Debt-to-Equity Ratio (D/E Ratio) KPI Dashboard in Excel, tracking and analyzing financial stability becomes effortless. This user-friendly template is designed
Read More

Posts pagination

Previous 1 … 58 59 60 … 83 Next
  • Learn Excel (Free Course)
    • 1. Shortcut Keys
    • 2. Fill & Flash Fill
    • 3. Find & Replace
    • 4. Sort & Filter
    • 5. Formulas & Functions
    • 6. Data Validation
    • 7. Conditional Formatting
    • 8. Basic Charts
    • 9. Advanced Charts
    • 10. Pivot Tables
    • 11. Excel Dashboards
    • 12. VBA Course
    • 13. Excel Formulas with AI
  • Templates
  • Tutorials
    • Charts and Visualization
    • VBA
    • Excel Tips and Tricks
    • Excel Dashboards
    • Power Pivot & DAX
  • Power BI
  • Template Store
    • Ready to Use Templates
  • Courses
  • Academy
    • Excel + AI Mastery: 100 Formulas
    • Excel Pivot Tables & Dashboards
  • About Us
  • Contact Us
Copyright © 2023 PK-AnExcelExpert.com - Privacy Policy