New: NextGenTemplates Academy - video courses on Excel formulas with AI and Pivot Tables & dashboards. Early-bird: 20% off with code EARLYBIRD20 - first 20 orders only. See the courses →
  • Learn Excel (Free Course)
    • 1. Shortcut Keys
    • 2. Fill & Flash Fill
    • 3. Find & Replace
    • 4. Sort & Filter
    • 5. Formulas & Functions
    • 6. Data Validation
    • 7. Conditional Formatting
    • 8. Basic Charts
    • 9. Advanced Charts
    • 10. Pivot Tables
    • 11. Excel Dashboards
    • 12. VBA Course
    • 13. Excel Formulas with AI
  • Templates
  • Tutorials
    • Charts and Visualization
    • VBA
    • Excel Tips and Tricks
    • Excel Dashboards
    • Power Pivot & DAX
  • Power BI
  • Template Store
    • Ready to Use Templates
  • Courses
  • Academy
    • Excel + AI Mastery: 100 Formulas
    • Excel Pivot Tables & Dashboards
  • About Us
  • Contact Us

PK: An Excel Expert

Transforming Data into Decisions

Tag: KPI trend analysis

Dashboard

Renewable Infrastructure Projects KPI Dashboard in Excel

November 18, 2025November 18, 2025 PKComments Off on Renewable Infrastructure Projects KPI Dashboard in Excel
Renewable infrastructure projects grow every year as the world moves toward clean energy, sustainability, and climate-friendly development. However, these projects also involve high investment, long timelines, and strict performance requirements.
Read More
Dashboard

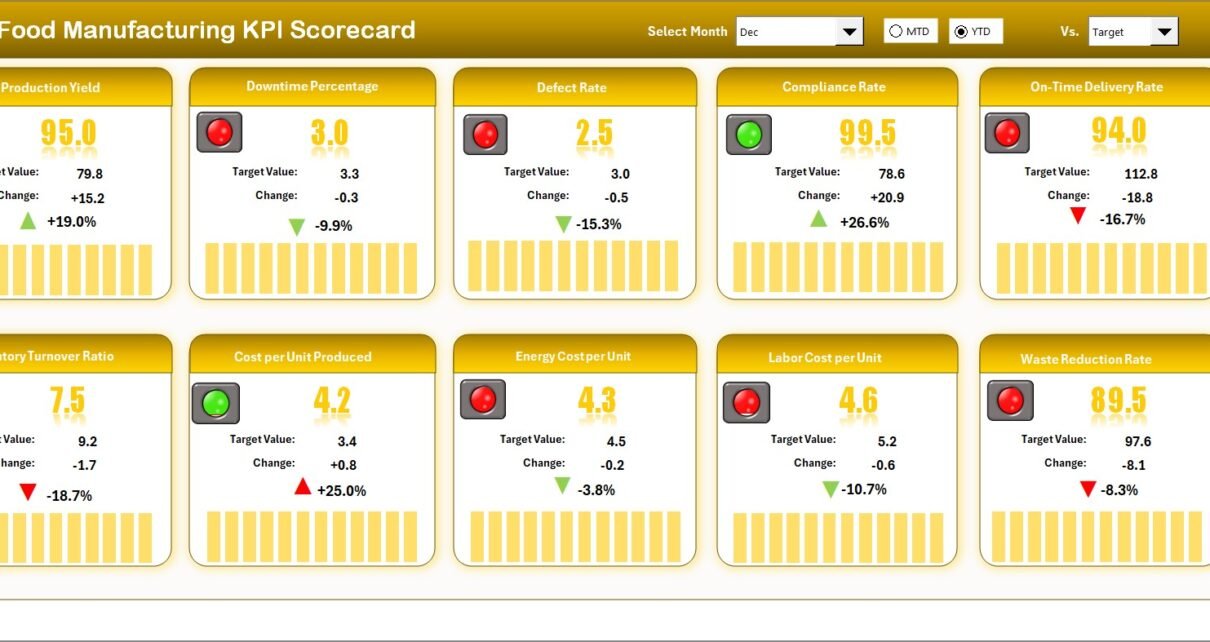
Food Manufacturing KPI Scorecard in Excel

November 12, 2025November 12, 2025 PKComments Off on Food Manufacturing KPI Scorecard in Excel
In today’s fast-moving food industry, maintaining consistent quality, productivity, and profitability requires more than just experience—it demands data-driven decision-making. Whether you manage a large-scale production plant or a small processing
Read More
Templates

Public Sector KPI Scorecard in Excel

October 12, 2025October 12, 2025 PKComments Off on Public Sector KPI Scorecard in Excel
In today’s data-driven world, public sector organizations face increasing pressure to demonstrate accountability, efficiency, and performance transparency. To meet these demands, leaders must rely on accurate and easy-to-interpret performance metrics.
Read More
Templates

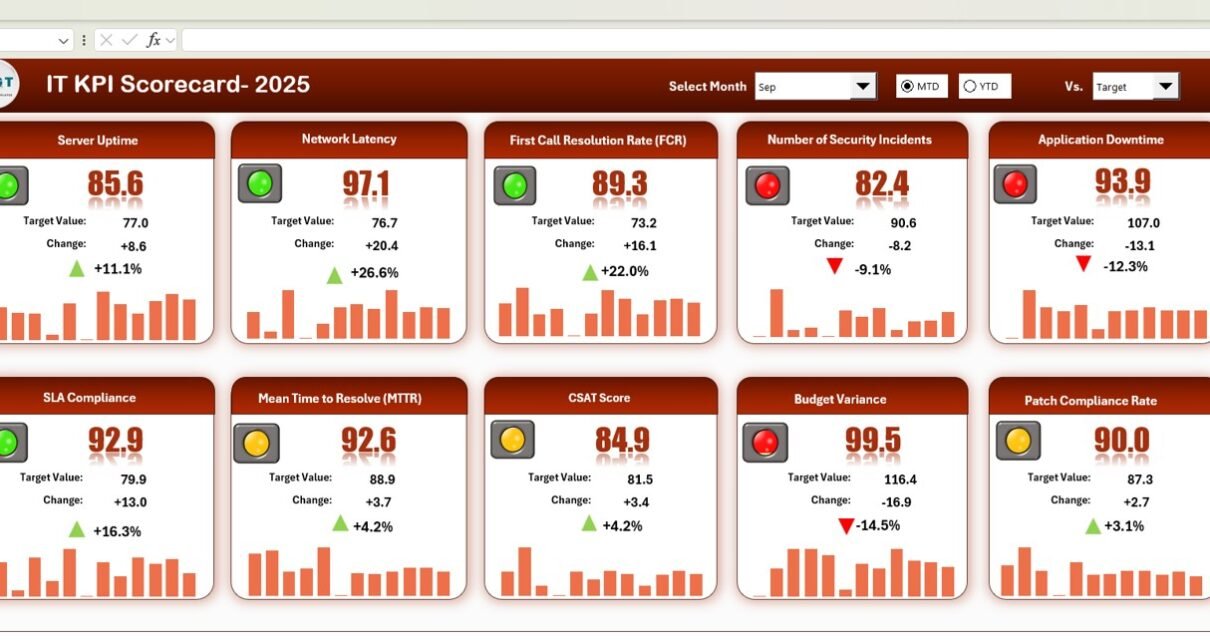
IT KPI Scorecard in Excel

October 2, 2025October 2, 2025 PKComments Off on IT KPI Scorecard in Excel
Measuring IT performance is essential for ensuring that technology supports business objectives effectively. The IT KPI Scorecard in Excel provides a ready-to-use solution to track, analyze, and visualize the performance
Read More
Power BI

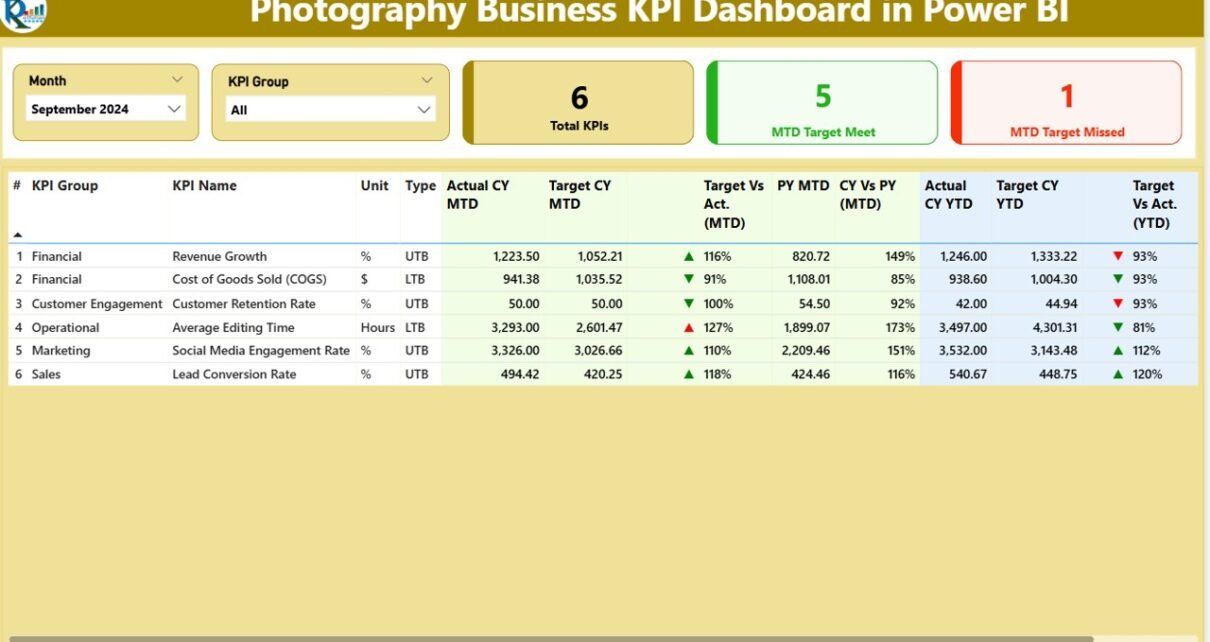
Photography Business KPI Dashboard in Power BI

October 2, 2025October 2, 2025 PKComments Off on Photography Business KPI Dashboard in Power BI
Running a photography business involves managing multiple aspects—from client acquisition and session bookings to revenue tracking and project completion. The Photography Business KPI Dashboard in Power BI provides a ready-to-use
Read More
Templates

Retail Profit Margin KPI Dashboard in Excel

September 29, 2025September 29, 2025 PKComments Off on Retail Profit Margin KPI Dashboard in Excel
Managing profitability is one of the most important goals in the retail industry. Businesses must constantly monitor sales, expenses, and overall efficiency to stay competitive. A Retail Profit Margin KPI
Read More
Templates

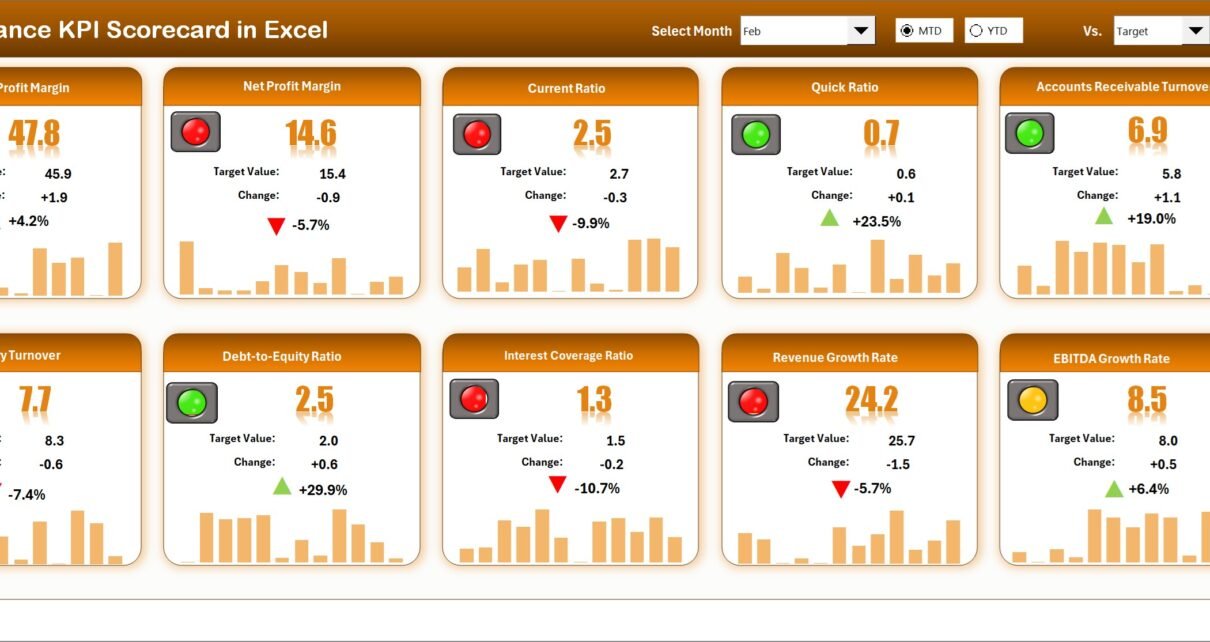
Finance KPI Scorecard in Excel

September 28, 2025September 28, 2025 PKComments Off on Finance KPI Scorecard in Excel
Effective financial management is essential for the success of any organization. A Finance KPI Scorecard in Excel allows finance teams and executives to track key financial metrics, identify trends, and
Read More
Templates

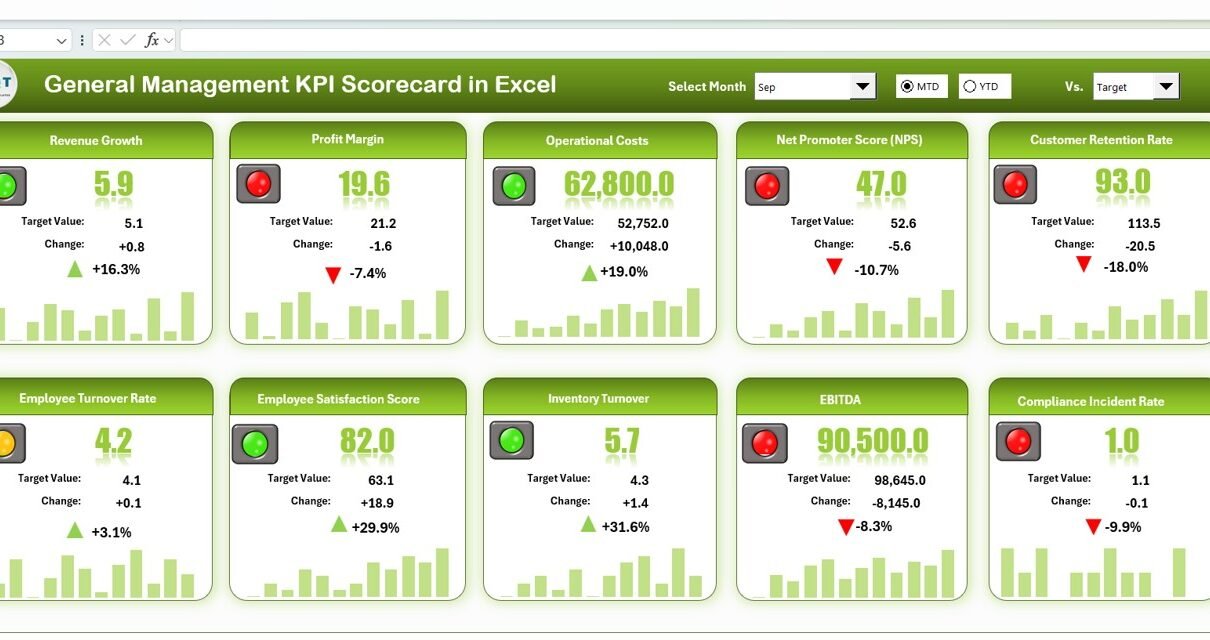
General Management KPI Scorecard in Excel

September 26, 2025September 26, 2025 PKComments Off on General Management KPI Scorecard in Excel
Managing business performance effectively requires a structured approach to monitor key metrics. The General Management KPI Scorecard in Excel is a ready-to-use tool designed to help managers track, analyze, and
Read More
Dashboard

Manufacturing Market Expansion KPI Dashboard in Excel

April 9, 2025April 9, 2025 PKComments Off on Manufacturing Market Expansion KPI Dashboard in Excel
In today’s highly competitive manufacturing world, tracking your performance and identifying areas for market growth is not just smart—it's essential. That’s exactly why having a Manufacturing Market Expansion KPI Dashboard
Read More
Dashboard

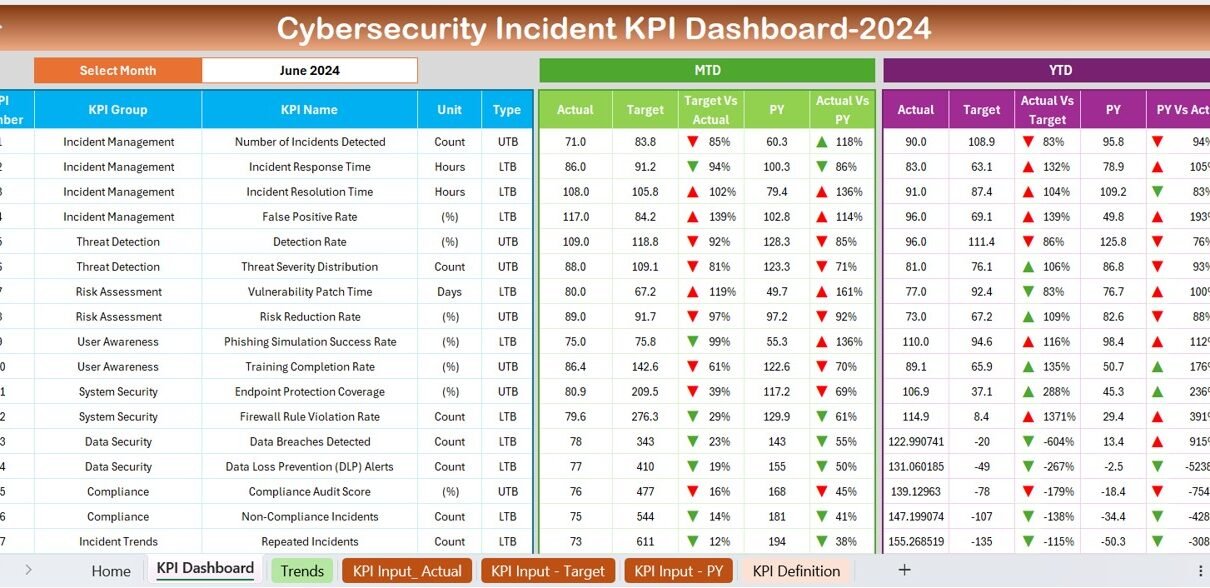
Cybersecurity Incident KPI Dashboard in Excel

January 28, 2025April 1, 2025 PKComments Off on Cybersecurity Incident KPI Dashboard in Excel
In today's fast-paced digital world, managing cybersecurity incidents effectively is critical for maintaining a secure IT infrastructure. Tracking the right Key Performance Indicators (KPIs) can help you monitor, analyze, and
Read More

Posts pagination

Previous 1 2 3 4 Next
  • Learn Excel (Free Course)
    • 1. Shortcut Keys
    • 2. Fill & Flash Fill
    • 3. Find & Replace
    • 4. Sort & Filter
    • 5. Formulas & Functions
    • 6. Data Validation
    • 7. Conditional Formatting
    • 8. Basic Charts
    • 9. Advanced Charts
    • 10. Pivot Tables
    • 11. Excel Dashboards
    • 12. VBA Course
    • 13. Excel Formulas with AI
  • Templates
  • Tutorials
    • Charts and Visualization
    • VBA
    • Excel Tips and Tricks
    • Excel Dashboards
    • Power Pivot & DAX
  • Power BI
  • Template Store
    • Ready to Use Templates
  • Courses
  • Academy
    • Excel + AI Mastery: 100 Formulas
    • Excel Pivot Tables & Dashboards
  • About Us
  • Contact Us
Copyright © 2023 PK-AnExcelExpert.com - Privacy Policy