New: NextGenTemplates Academy - video courses on Excel formulas with AI and Pivot Tables & dashboards. Early-bird: 20% off with code EARLYBIRD20 - first 20 orders only. See the courses →
  • Learn Excel (Free Course)
    • 1. Shortcut Keys
    • 2. Fill & Flash Fill
    • 3. Find & Replace
    • 4. Sort & Filter
    • 5. Formulas & Functions
    • 6. Data Validation
    • 7. Conditional Formatting
    • 8. Basic Charts
    • 9. Advanced Charts
    • 10. Pivot Tables
    • 11. Excel Dashboards
    • 12. VBA Course
    • 13. Excel Formulas with AI
  • Templates
  • Tutorials
    • Charts and Visualization
    • VBA
    • Excel Tips and Tricks
    • Excel Dashboards
    • Power Pivot & DAX
  • Power BI
  • Template Store
    • Ready to Use Templates
  • Courses
  • Academy
    • Excel + AI Mastery: 100 Formulas
    • Excel Pivot Tables & Dashboards
  • About Us
  • Contact Us

PK: An Excel Expert

Transforming Data into Decisions

Tag: KPI

Templates

Customer Retention KPI Scorecard in Excel

March 15, 2026March 15, 2026 PKComments Off on Customer Retention KPI Scorecard in Excel
Customer Retention KPI Scorecard Introduction: Customer Retention KPI Scorecard The Customer Retention KPI Scorecard is a ready-to-use Excel scorecard template designed to help teams measure, visualize, and improve customer retention
Read More
Templates

Knowledge Management KPI Scorecard in Excel

March 14, 2026March 14, 2026 PKComments Off on Knowledge Management KPI Scorecard in Excel
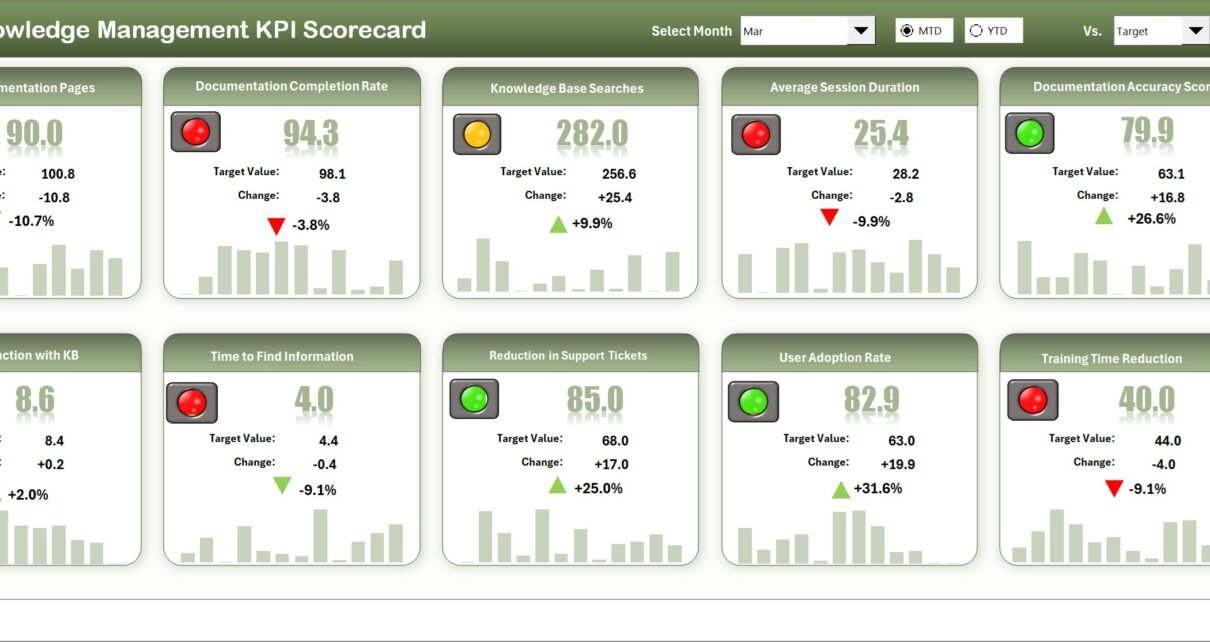
Knowledge Management KPI Scorecard - Introduction The Knowledge Management KPI Scorecard is a ready-to-use Excel template designed to help teams measure, visualize, and improve knowledge management (KM) performance. This post
Read More
Blogs Dashboard

Incubators and Accelerators KPI Dashboard in Excel

March 14, 2026March 14, 2026 PKComments Off on Incubators and Accelerators KPI Dashboard in Excel
Incubators and Accelerators KPI Dashboard Introduction Click to Purchases Incubators and Accelerators KPI Dashboard in Excel The Incubators & Accelerators KPI Dashboard is a ready-to-use Excel template designed to help
Read More
Blogs Templates

Diversity and Inclusion KPI Scorecard in Excel

March 12, 2026March 12, 2026 PKComments Off on Diversity and Inclusion KPI Scorecard in Excel
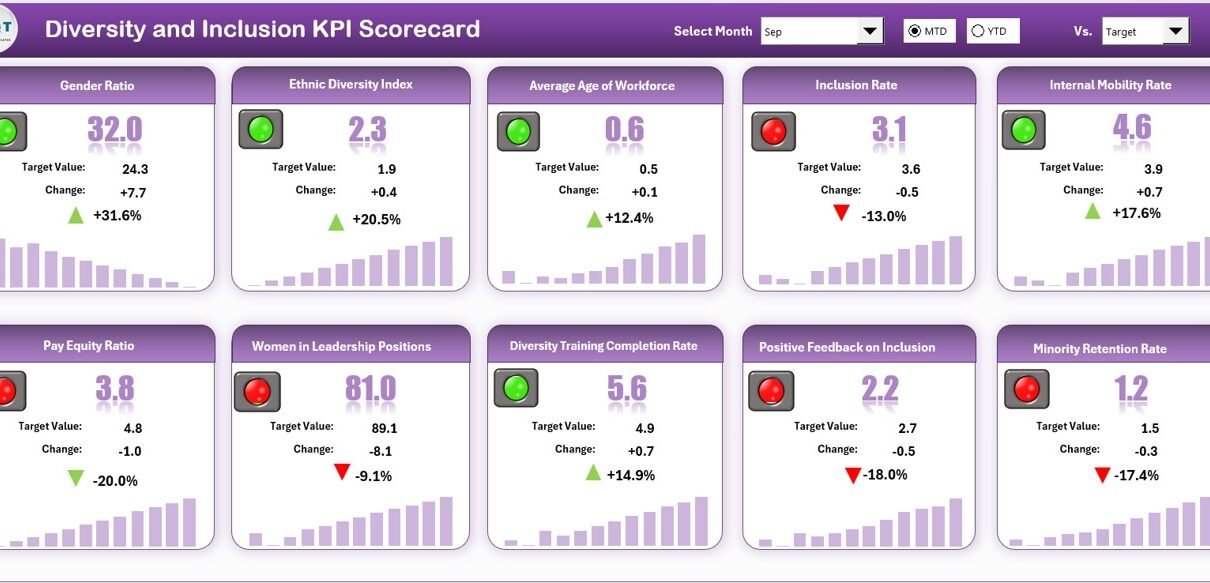
Introduction Diversity and Inclusion are vital components of a progressive workplace. To track and improve these efforts effectively, organizations require a robust measurement tool. This is where the Diversity and
Read More
Templates

Recruitment KPI Scorecard in Excel

March 11, 2026March 11, 2026 PKComments Off on Recruitment KPI Scorecard in Excel
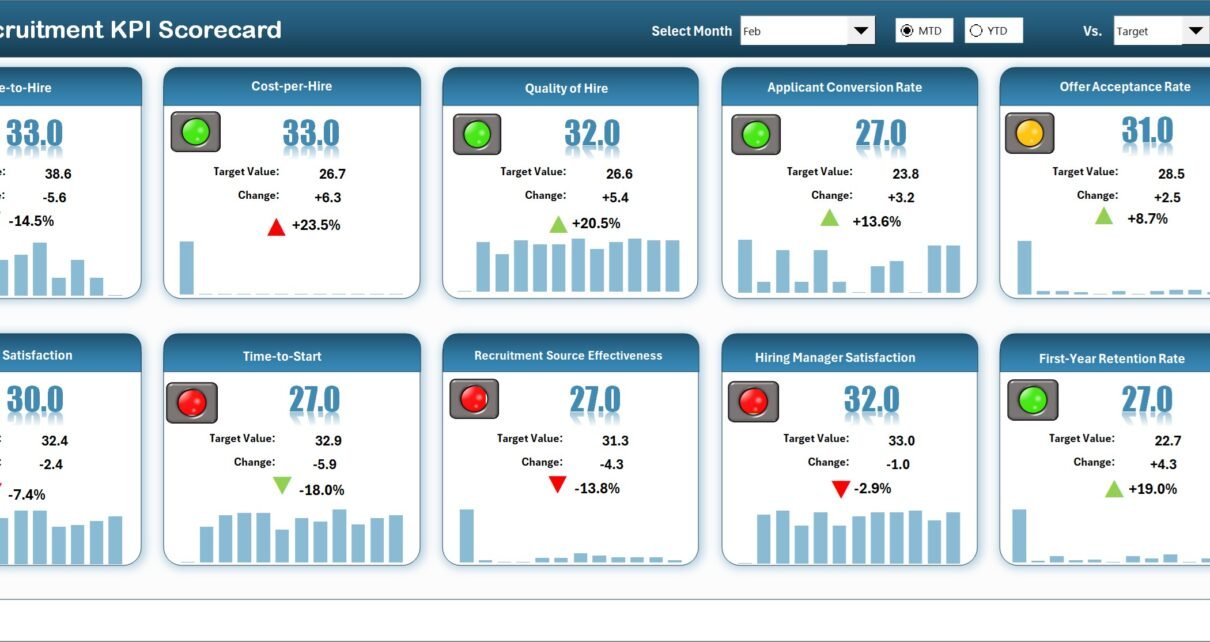
Introduction The Recruitment KPI Scorecard is an essential tool designed to help organizations track and optimize their hiring processes effectively. This ready-to-use scorecard template empowers HR teams and recruitment managers
Read More
Power BI

Robotics Industry KPI Dashboard in Power BI

January 31, 2025April 3, 2025 PKComments Off on Robotics Industry KPI Dashboard in Power BI
In the ever-evolving robotics industry, having access to real-time data is essential for businesses looking to maintain a competitive edge. The Robotics Industry KPI Dashboard in Power BI is designed
Read More
Dashboard

Employee Retention KPI Dashboard in Excel

January 28, 2025April 7, 2025 PKComments Off on Employee Retention KPI Dashboard in Excel
Employee retention is one of the most significant challenges facing businesses today. A high turnover rate can be costly and disruptive to an organization. One of the best ways to
Read More
Dashboard

SEO Content Performance KPI Dashboard in Excel

January 28, 2025April 9, 2025 PKComments Off on SEO Content Performance KPI Dashboard in Excel
In today's digital marketing landscape, the success of SEO strategies and content performance relies on data and metrics. An SEO Content Performance KPI Dashboard provides a clear view of how
Read More
Credit Rating Meter Chart in Excel
Charts and Visualization

Credit Rating Meter Chart in Excel

June 23, 2024October 10, 2026 PKComments Off on Credit Rating Meter Chart in Excel
In this article, we will create a visually appealing Credit Rating Meter Chart in Excel. You can display a credit score, a Civil score, or any other key performance indicator
Read More

Posts pagination

Previous 1 2
  • Learn Excel (Free Course)
    • 1. Shortcut Keys
    • 2. Fill & Flash Fill
    • 3. Find & Replace
    • 4. Sort & Filter
    • 5. Formulas & Functions
    • 6. Data Validation
    • 7. Conditional Formatting
    • 8. Basic Charts
    • 9. Advanced Charts
    • 10. Pivot Tables
    • 11. Excel Dashboards
    • 12. VBA Course
    • 13. Excel Formulas with AI
  • Templates
  • Tutorials
    • Charts and Visualization
    • VBA
    • Excel Tips and Tricks
    • Excel Dashboards
    • Power Pivot & DAX
  • Power BI
  • Template Store
    • Ready to Use Templates
  • Courses
  • Academy
    • Excel + AI Mastery: 100 Formulas
    • Excel Pivot Tables & Dashboards
  • About Us
  • Contact Us
Copyright © 2023 PK-AnExcelExpert.com - Privacy Policy