New: NextGenTemplates Academy - video courses on Excel formulas with AI and Pivot Tables & dashboards. Early-bird: 20% off with code EARLYBIRD20 - first 20 orders only. See the courses →
  • Learn Excel (Free Course)
    • 1. Shortcut Keys
    • 2. Fill & Flash Fill
    • 3. Find & Replace
    • 4. Sort & Filter
    • 5. Formulas & Functions
    • 6. Data Validation
    • 7. Conditional Formatting
    • 8. Basic Charts
    • 9. Advanced Charts
    • 10. Pivot Tables
    • 11. Excel Dashboards
    • 12. VBA Course
    • 13. Excel Formulas with AI
  • Templates
  • Tutorials
    • Charts and Visualization
    • VBA
    • Excel Tips and Tricks
    • Excel Dashboards
    • Power Pivot & DAX
  • Power BI
  • Template Store
    • Ready to Use Templates
  • Courses
  • Academy
    • Excel + AI Mastery: 100 Formulas
    • Excel Pivot Tables & Dashboards
  • About Us
  • Contact Us

PK: An Excel Expert

Transforming Data into Decisions

Tag: operational KPIs

Dashboard

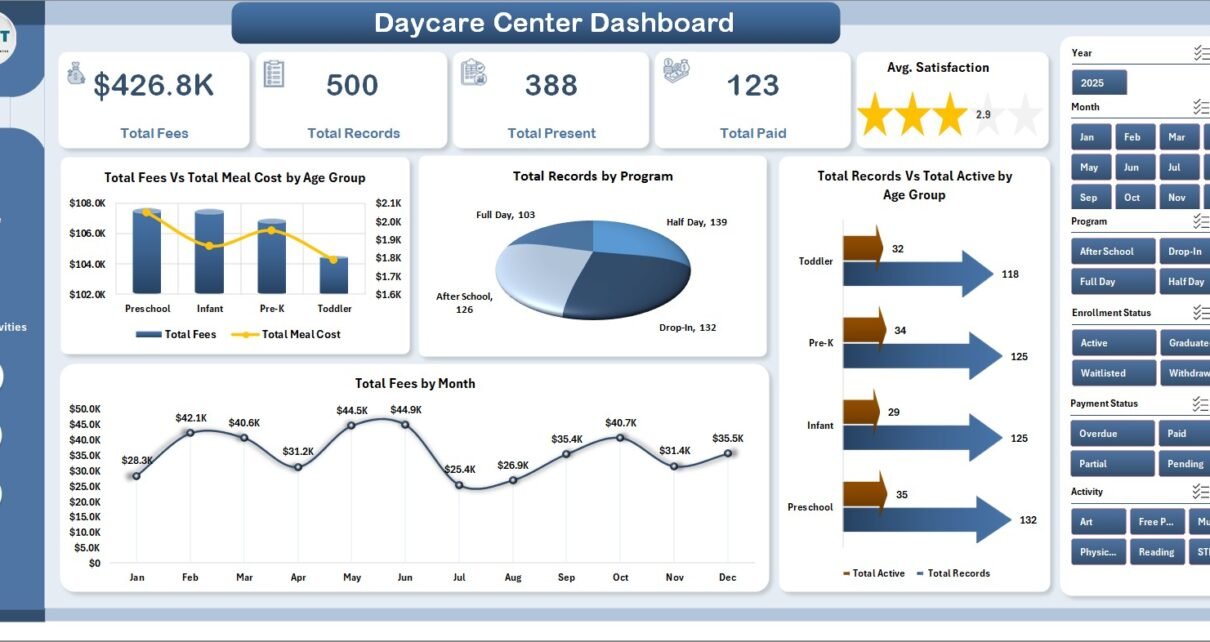
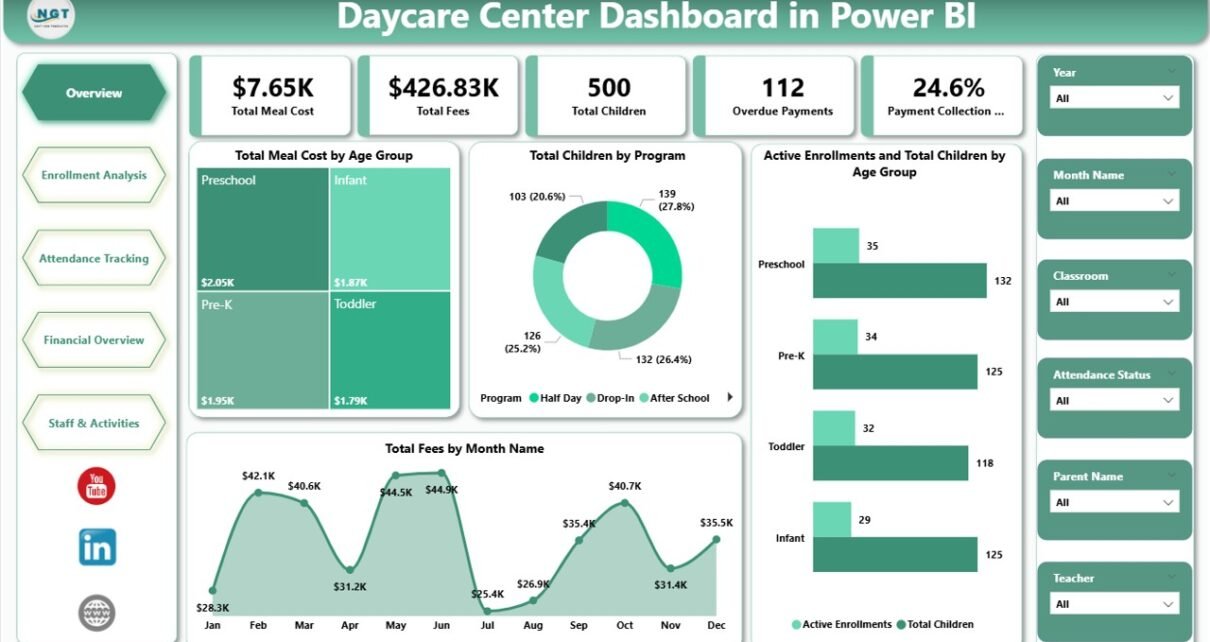
Daycare Center Dashboard in Power BI

May 17, 2026May 17, 2026 PKComments Off on Daycare Center Dashboard in Power BI
Running a daycare center is a daily juggling act. Owners and managers must track enrollment, attendance, fees, meal costs, teacher workload, and parent satisfaction — yet most centers still rely
Read More
Dashboard

Daycare Center Dashboard in Excel

May 17, 2026May 17, 2026 PKComments Off on Daycare Center Dashboard in Excel
Running a daycare center is a daily juggling act. Owners and managers must track enrollment, attendance, fees, meal costs, teacher workload, and parent satisfaction — yet most centers still rely
Read More
Dashboard Power BI

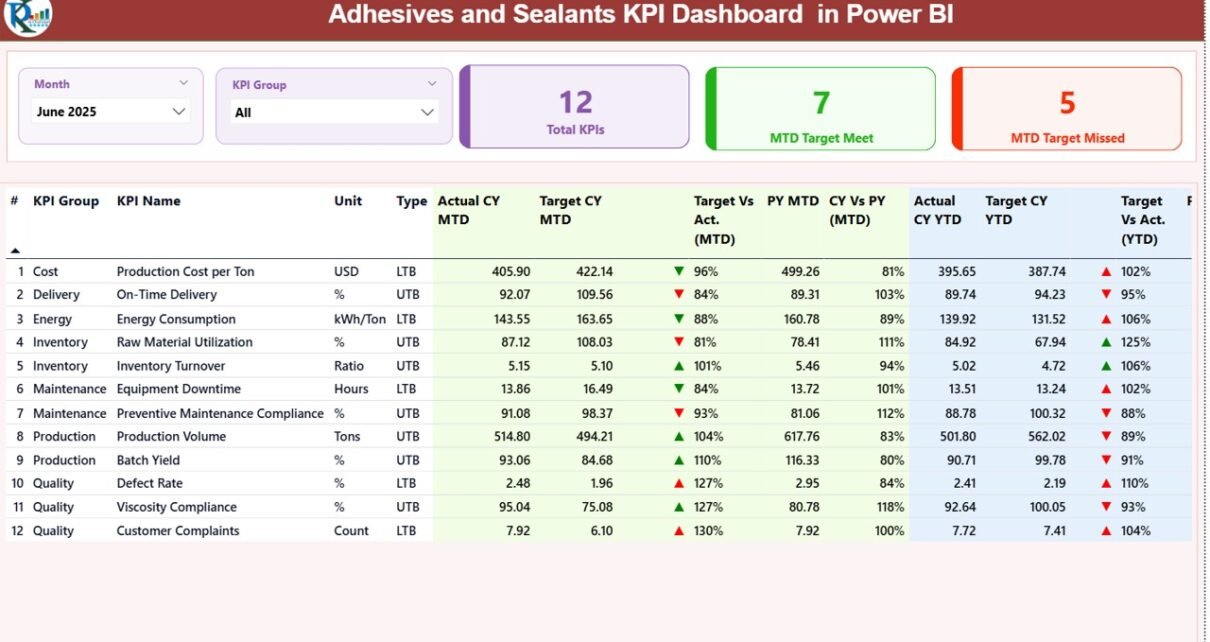
Adhesives and Sealants KPI Dashboard in Power BI

February 27, 2026February 27, 2026 PKComments Off on Adhesives and Sealants KPI Dashboard in Power BI
In today’s fast-moving manufacturing environment, companies must monitor performance continuously to stay competitive. The adhesives and sealants industry operates with complex production processes, strict quality standards, and cost-sensitive operations. Therefore,
Read More
Dashboard

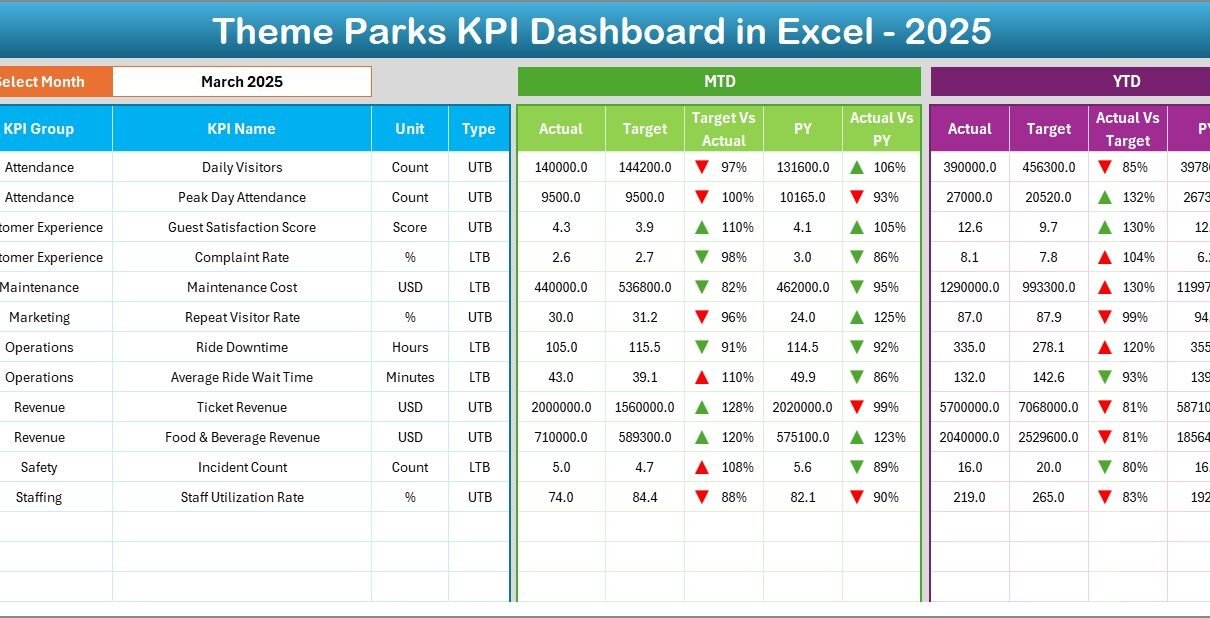
Theme Parks KPI Dashboard in Excel

January 23, 2026January 23, 2026 PKComments Off on Theme Parks KPI Dashboard in Excel
Managing a theme park involves hundreds of moving parts every single day. From visitor footfall and ride availability to revenue, safety, and customer satisfaction, everything needs close monitoring. However, when
Read More
Dashboard

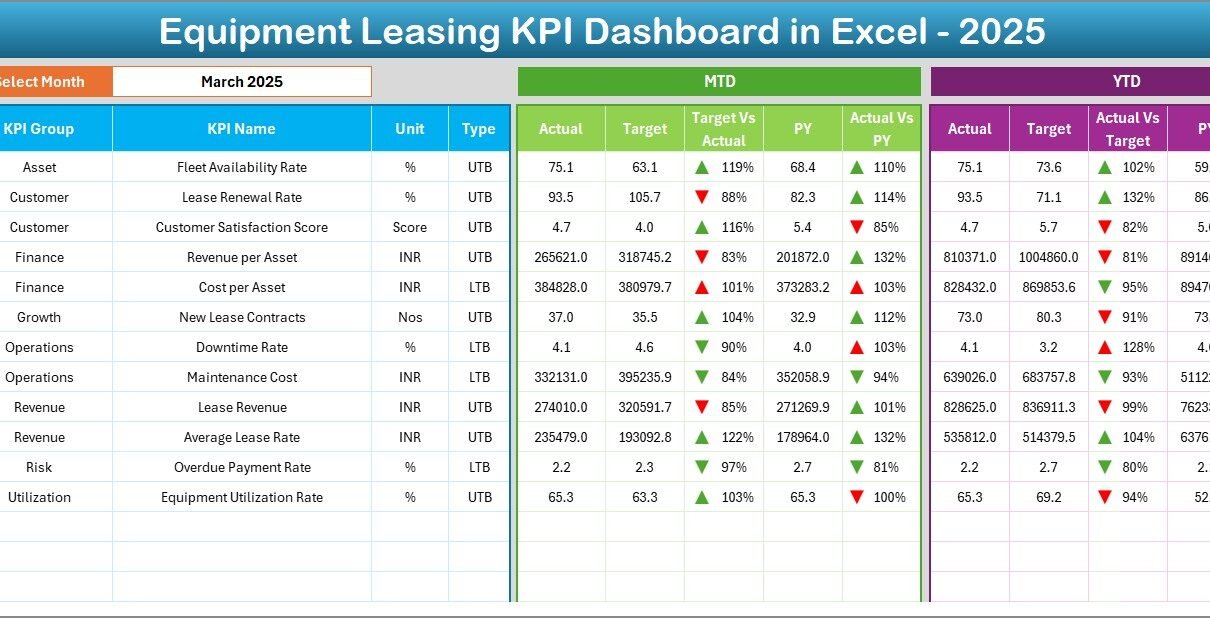
Equipment Leasing KPI Dashboard in Excel

January 18, 2026January 18, 2026 PKComments Off on Equipment Leasing KPI Dashboard in Excel
Managing an equipment leasing business involves constant tracking of assets, revenue, utilization, costs, and profitability. However, many leasing companies still rely on scattered Excel sheets, manual reports, and delayed summaries.
Read More
Dashboard

Facilities Management KPI Dashboard in Excel

January 15, 2026January 15, 2026 PKComments Off on Facilities Management KPI Dashboard in Excel
In today’s fast-moving business environment, facilities play a critical role in productivity, safety, and operational efficiency. Offices, factories, hospitals, campuses, malls, and commercial buildings generate massive amounts of operational data
Read More
Dashboard

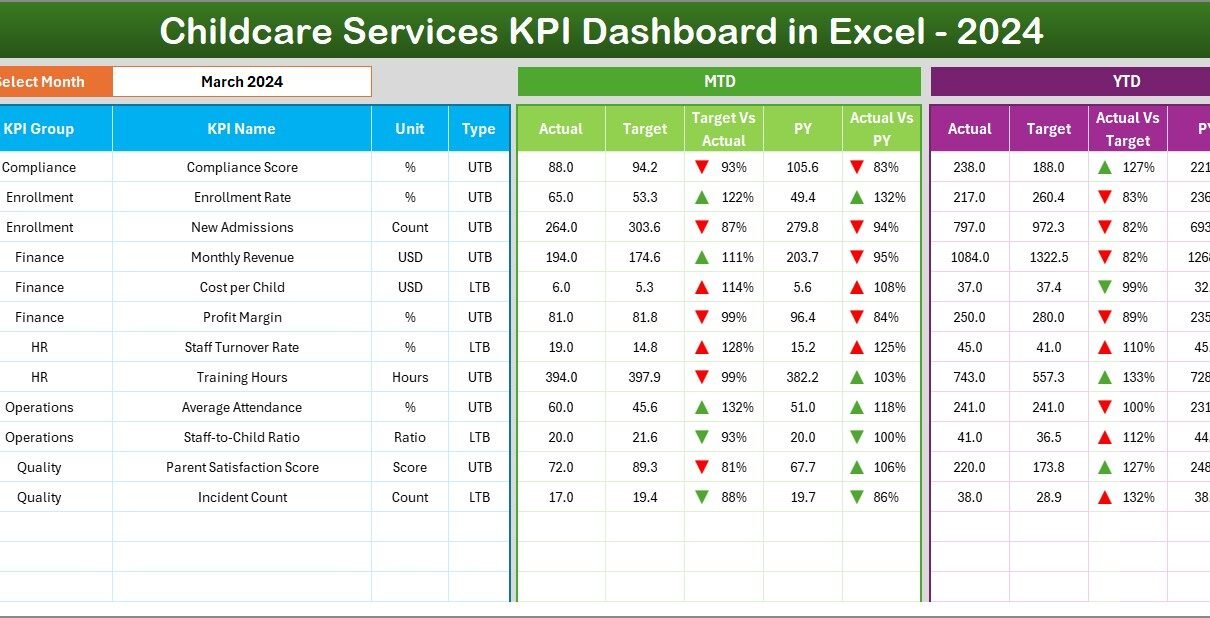
Childcare Services KPI Dashboard in Excel

January 12, 2026January 12, 2026 PKComments Off on Childcare Services KPI Dashboard in Excel
Managing a childcare or daycare service involves much more than daily operations and parent communication. You must track enrollments, attendance, staff efficiency, safety, finances, and service quality regularly. However, many
Read More
Dashboard Power BI

Refinery Dashboard in Power BI

January 3, 2026January 3, 2026 PKComments Off on Refinery Dashboard in Power BI
Managing a refinery involves thousands of daily decisions. Leaders must control costs, reduce downtime, optimize energy usage, and increase output at the same time. However, when teams rely on scattered
Read More
Power BI

Convenience Stores KPI Dashboard in Power BI

December 9, 2025December 9, 2025 PKComments Off on Convenience Stores KPI Dashboard in Power BI
Running a convenience store business requires fast decisions, accurate insights, and complete visibility into daily operations. However, when sales, margins, inventory, and operational data stay scattered across multiple reports, decision-making
Read More
Dashboard

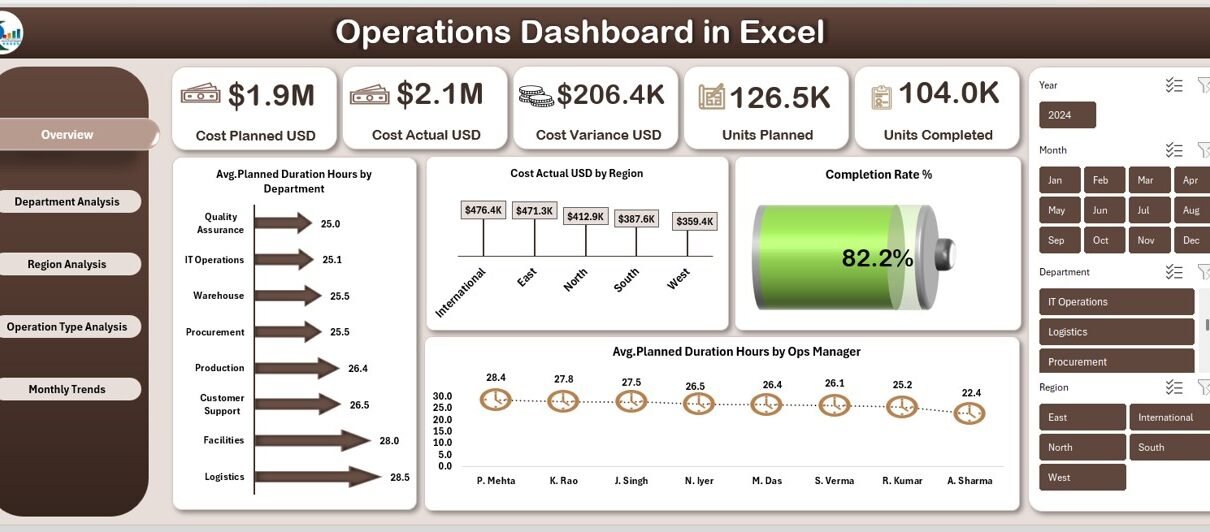
Operations Dashboard in Excel

December 7, 2025December 7, 2025 PKComments Off on Operations Dashboard in Excel
In today’s fast-paced business environment, organizations handle multiple operations across departments, regions, and managers. However, without a structured monitoring system, operational performance often becomes unclear. Numbers remain scattered across files,
Read More

Posts pagination

1 2 Next
  • Learn Excel (Free Course)
    • 1. Shortcut Keys
    • 2. Fill & Flash Fill
    • 3. Find & Replace
    • 4. Sort & Filter
    • 5. Formulas & Functions
    • 6. Data Validation
    • 7. Conditional Formatting
    • 8. Basic Charts
    • 9. Advanced Charts
    • 10. Pivot Tables
    • 11. Excel Dashboards
    • 12. VBA Course
    • 13. Excel Formulas with AI
  • Templates
  • Tutorials
    • Charts and Visualization
    • VBA
    • Excel Tips and Tricks
    • Excel Dashboards
    • Power Pivot & DAX
  • Power BI
  • Template Store
    • Ready to Use Templates
  • Courses
  • Academy
    • Excel + AI Mastery: 100 Formulas
    • Excel Pivot Tables & Dashboards
  • About Us
  • Contact Us
Copyright © 2023 PK-AnExcelExpert.com - Privacy Policy