New: NextGenTemplates Academy - video courses on Excel formulas with AI and Pivot Tables & dashboards. Early-bird: 20% off with code EARLYBIRD20 - first 20 orders only. See the courses →
  • Learn Excel (Free Course)
    • 1. Shortcut Keys
    • 2. Fill & Flash Fill
    • 3. Find & Replace
    • 4. Sort & Filter
    • 5. Formulas & Functions
    • 6. Data Validation
    • 7. Conditional Formatting
    • 8. Basic Charts
    • 9. Advanced Charts
    • 10. Pivot Tables
    • 11. Excel Dashboards
    • 12. VBA Course
    • 13. Excel Formulas with AI
  • Templates
  • Tutorials
    • Charts and Visualization
    • VBA
    • Excel Tips and Tricks
    • Excel Dashboards
    • Power Pivot & DAX
  • Power BI
  • Template Store
    • Ready to Use Templates
  • Courses
  • Academy
    • Excel + AI Mastery: 100 Formulas
    • Excel Pivot Tables & Dashboards
  • About Us
  • Contact Us

PK: An Excel Expert

Transforming Data into Decisions

Tag: Performance Management Dashboard

Power BI Templates

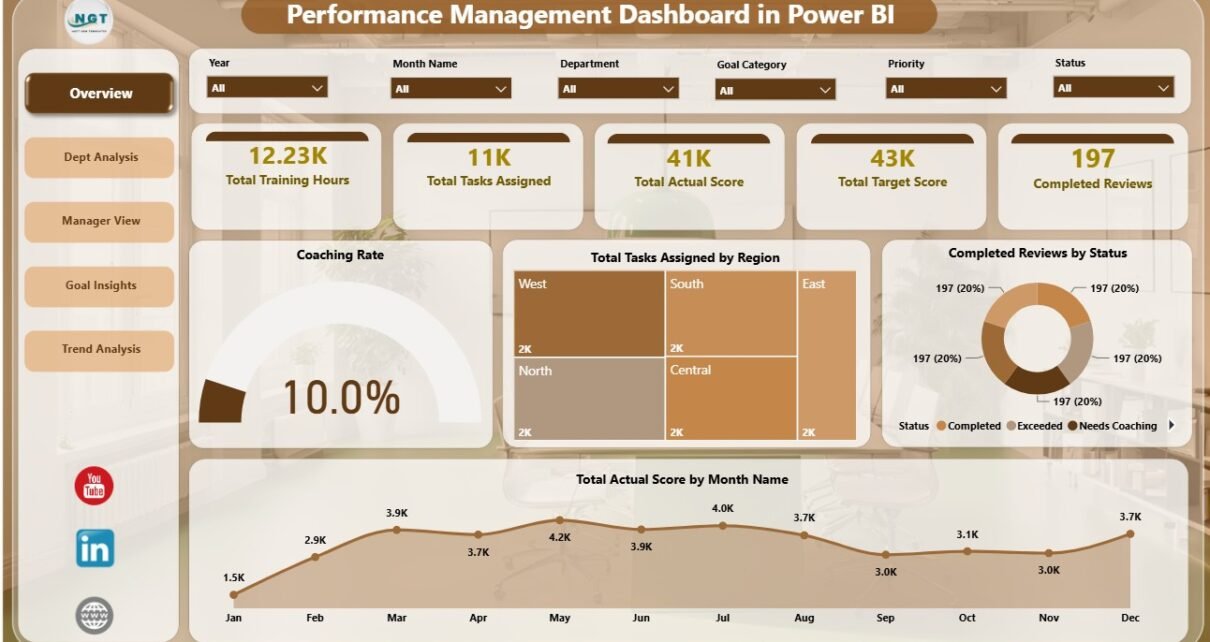
Performance Management Dashboard in Power BI

July 23, 2026July 23, 2026 PKComments Off on Performance Management Dashboard in Power BI
Performance Management Dashboard in Power BI is a ready-to-use Power BI dashboard template for HR managers, department heads, people analytics teams, business owners, and consultants who want to turn review
Read More
Power BI Templates

Executive Coaching Dashboard in Power BI

June 10, 2026June 10, 2026 PKComments Off on Executive Coaching Dashboard in Power BI
Executive coaching is now a measurable business investment, not only a leadership development activity. Coaching teams need to understand session fees, program costs, completion rates, engagement status, client ratings, coach
Read More
Dashboard Power BI

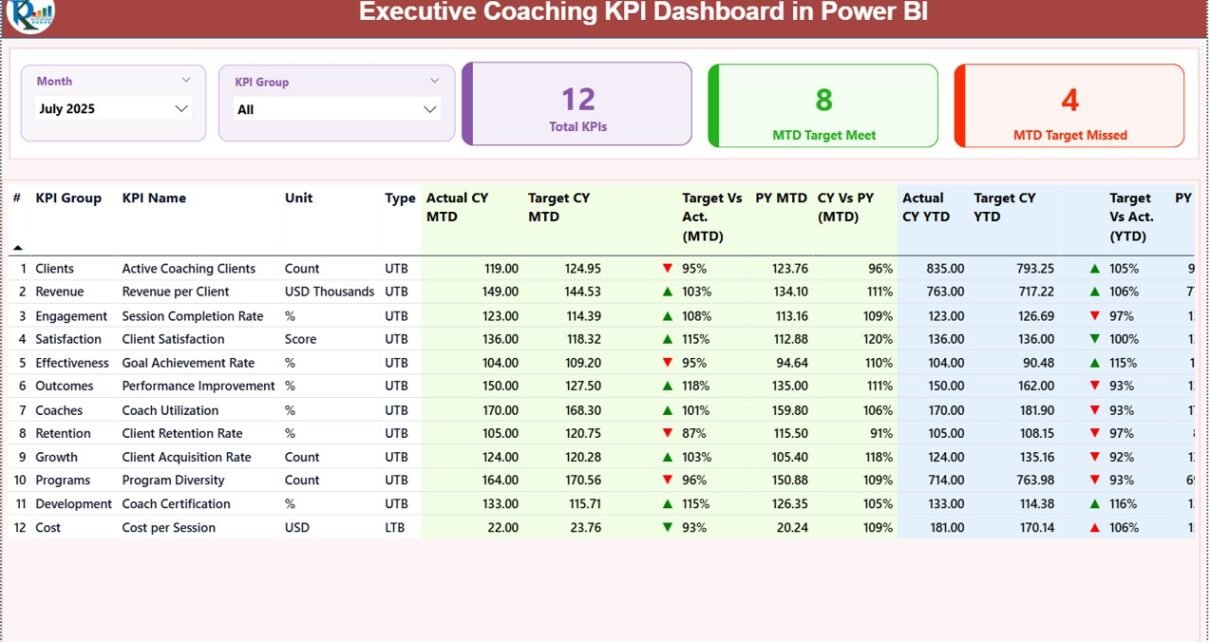
Executive Coaching KPI Dashboard in Power BI

March 12, 2026March 12, 2026 PKComments Off on Executive Coaching KPI Dashboard in Power BI
Executive coaching has become an essential investment for organizations that want to develop strong leaders, improve management effectiveness, and drive long-term business growth. However, measuring the impact of executive coaching
Read More
Dashboard

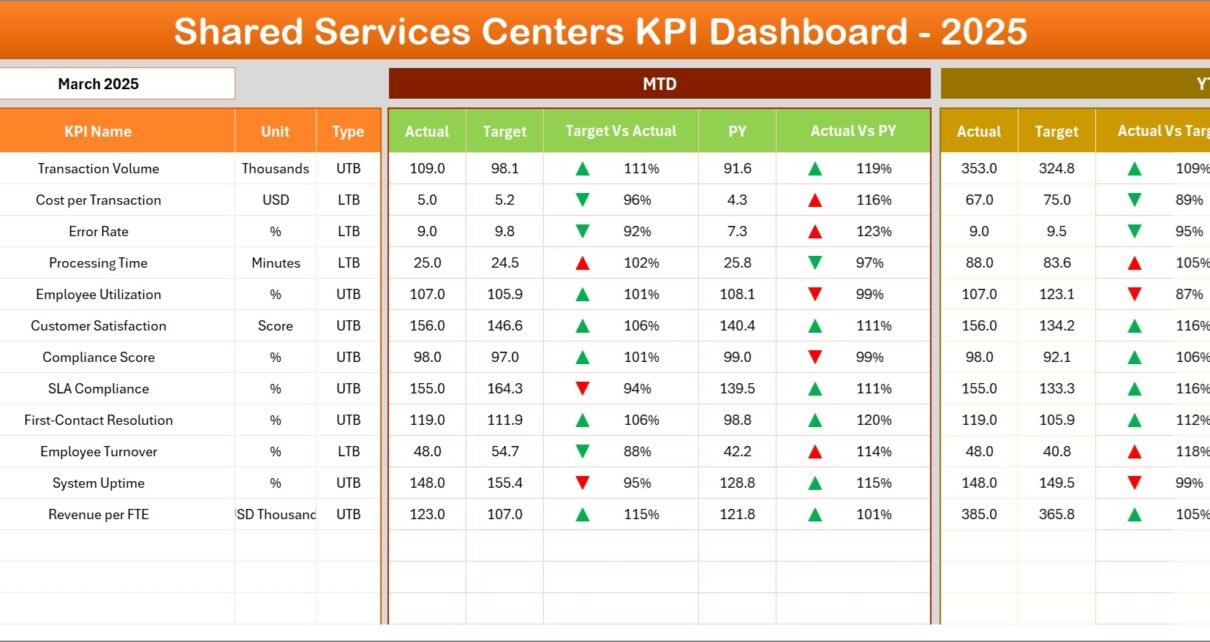
Shared Services Centers KPI Dashboard in Excel

March 10, 2026March 10, 2026 PKComments Off on Shared Services Centers KPI Dashboard in Excel
Shared Services Centers (SSC) play a critical role in modern organizations. Companies centralize functions such as finance, HR, procurement, IT services, payroll, and customer support into shared service centers to
Read More
Dashboard Power BI

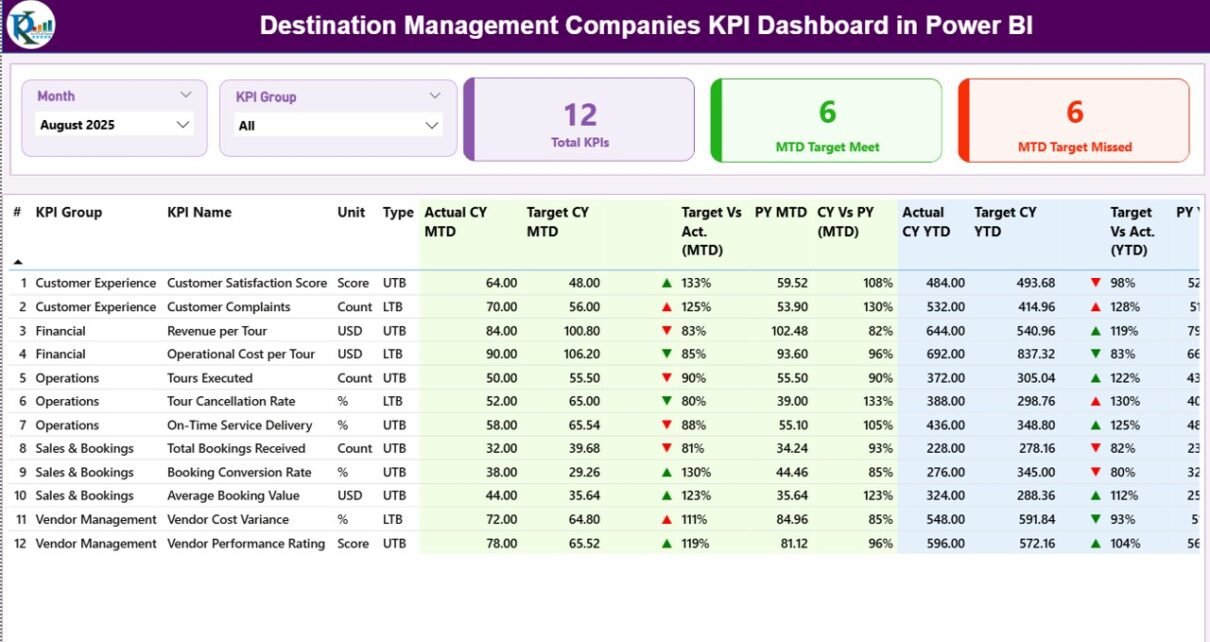
Destination Management Companies KPI Dashboard in Power BI

February 2, 2026February 2, 2026 PKComments Off on Destination Management Companies KPI Dashboard in Power BI
Destination Management Companies (DMCs) operate in a fast-moving, service-driven environment. They manage tours, events, transportation, hotels, vendors, and client expectations—all at the same time. Because of this complexity, DMCs need
Read More
Dashboard Power BI

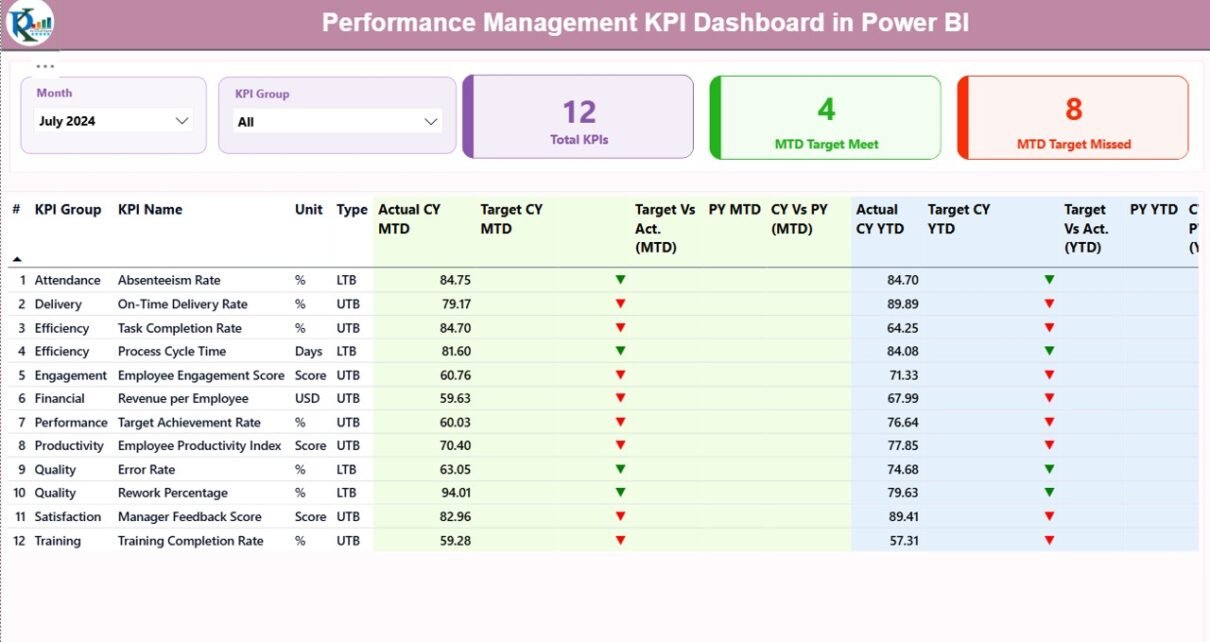
Performance Management KPI Dashboard in Power BI

January 26, 2026January 26, 2026 PKComments Off on Performance Management KPI Dashboard in Power BI
Managing performance across departments, teams, and business units requires clarity, consistency, and speed. However, many organizations still depend on manual Excel reports, static MIS files, or delayed presentations. As a
Read More
Dashboard Power BI

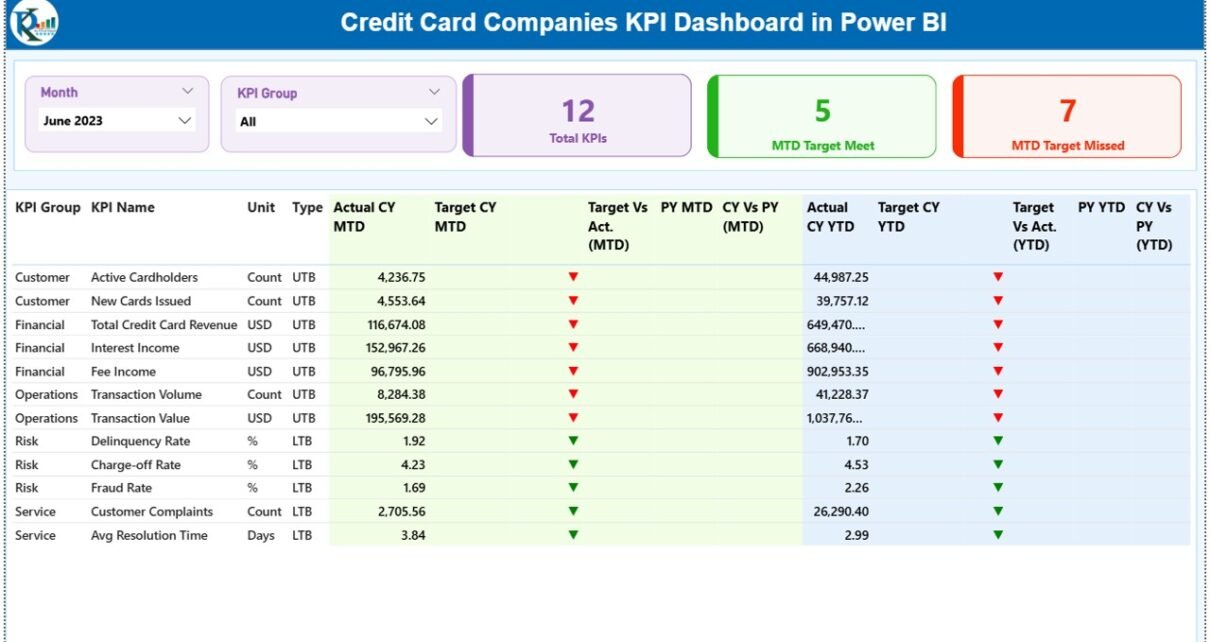
Credit Card Companies KPI Dashboard in Power BI

January 9, 2026January 9, 2026 PKComments Off on Credit Card Companies KPI Dashboard in Power BI
Credit card companies operate in a fast-paced and highly competitive financial environment. Every day, they manage millions of transactions, customer interactions, risk assessments, and revenue decisions. Therefore, they need clear
Read More
Dashboard

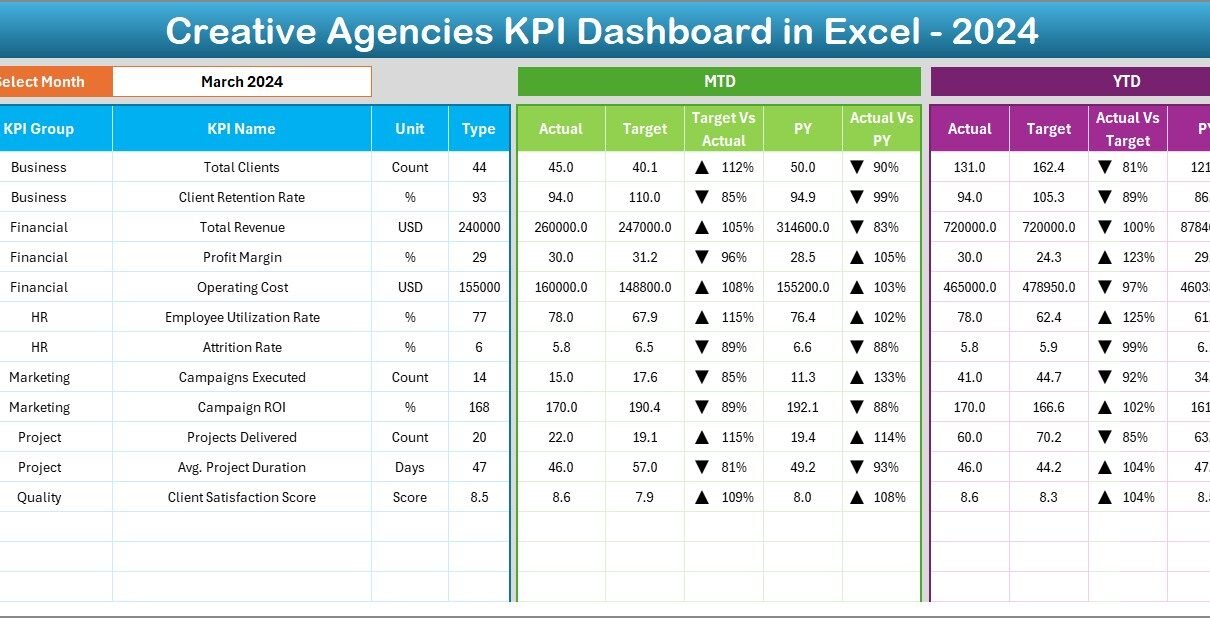
Creative Agencies KPI Dashboard in Excel

January 9, 2026January 9, 2026 PKComments Off on Creative Agencies KPI Dashboard in Excel
Creative agencies work in a fast-moving and highly competitive environment. Therefore, agencies must track performance carefully to stay profitable, productive, and client-focused. However, when data remains scattered across multiple Excel
Read More
Dashboard Power BI

Skill Development Missions KPI Dashboard in Power BI

January 7, 2026January 7, 2026 PKComments Off on Skill Development Missions KPI Dashboard in Power BI
Skill development missions play a vital role in building a future-ready workforce. Governments, training institutions, and development agencies invest heavily in upskilling initiatives. However, without clear performance tracking, even the
Read More
Power BI

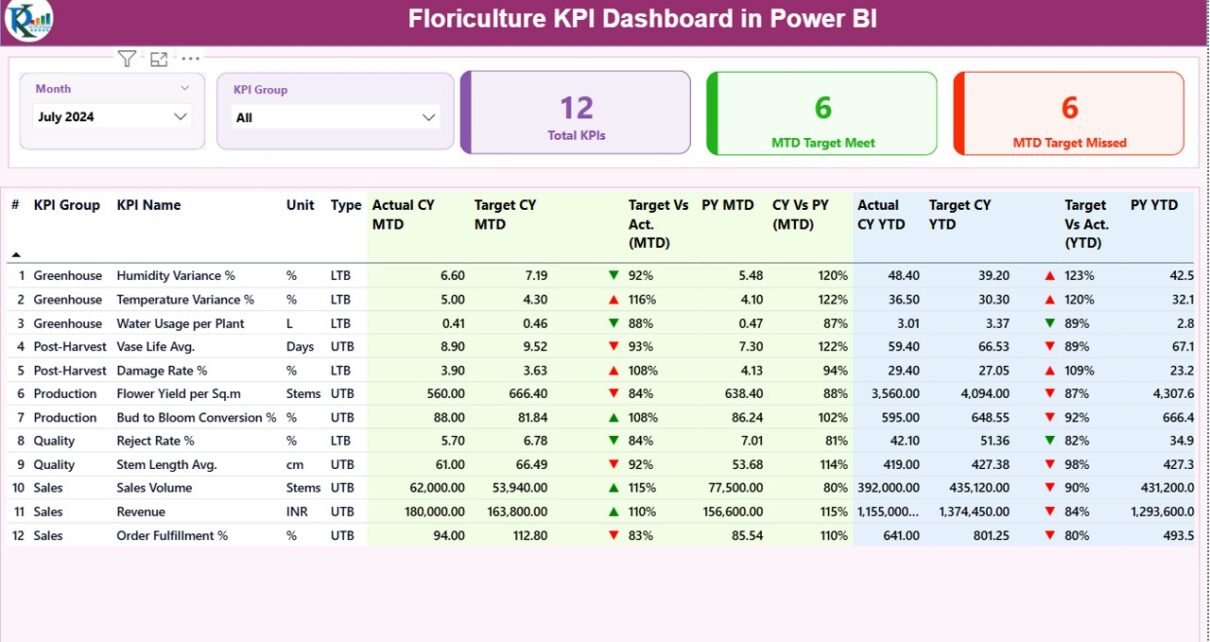
Floriculture KPI Dashboard in Power BI

December 15, 2025December 15, 2025 PKComments Off on Floriculture KPI Dashboard in Power BI
The floriculture industry operates in a highly dynamic environment where demand patterns change quickly, perishability remains high, and margins depend heavily on efficiency and timing. Therefore, floriculture businesses must track
Read More

Posts pagination

1 2 Next
  • Learn Excel (Free Course)
    • 1. Shortcut Keys
    • 2. Fill & Flash Fill
    • 3. Find & Replace
    • 4. Sort & Filter
    • 5. Formulas & Functions
    • 6. Data Validation
    • 7. Conditional Formatting
    • 8. Basic Charts
    • 9. Advanced Charts
    • 10. Pivot Tables
    • 11. Excel Dashboards
    • 12. VBA Course
    • 13. Excel Formulas with AI
  • Templates
  • Tutorials
    • Charts and Visualization
    • VBA
    • Excel Tips and Tricks
    • Excel Dashboards
    • Power Pivot & DAX
  • Power BI
  • Template Store
    • Ready to Use Templates
  • Courses
  • Academy
    • Excel + AI Mastery: 100 Formulas
    • Excel Pivot Tables & Dashboards
  • About Us
  • Contact Us
Copyright © 2023 PK-AnExcelExpert.com - Privacy Policy