Executive coaching is now a measurable business investment, not only a leadership development activity. Coaching teams need to understand session fees, program costs, completion rates, engagement status, client ratings, coach contribution, program mix, and outcome patterns in one place. The Executive Coaching Dashboard in Power BI is designed for that exact reporting need, with 5 interactive report pages, 5 high-level cards, and more than 13 visual analysis views.
Instead of preparing separate reports for finance, HR, coaching operations, and leadership reviews, this Power BI dashboard brings the main indicators into a single reporting file. Users can apply slicers, review performance by coach or program type, and identify where coaching revenue, cost, and outcomes are moving in the right direction.
Click here to purchase Executive Coaching Dashboard in Power BI
Key Features of Executive Coaching Dashboard in Power BI
- 5 Power BI pages for Overview, Coach Analysis, Program Mix, Revenue Trend, and Client Outcomes.
- Cards for Total Session Fee, Total Program Cost, Completion Rate, Total Engagements, and Total Sessions.
- Coach-level comparison by completion rate, total session fee, and average client rating.
- Program analysis by program type, industry, and client level.
- Revenue trend reporting by month, quarter, and year.
- Client outcome analysis by industry, status, and region.
- Multiple slicers to filter the dashboard quickly during review meetings.
Dashboard Pages Explanation
1. Overview Page
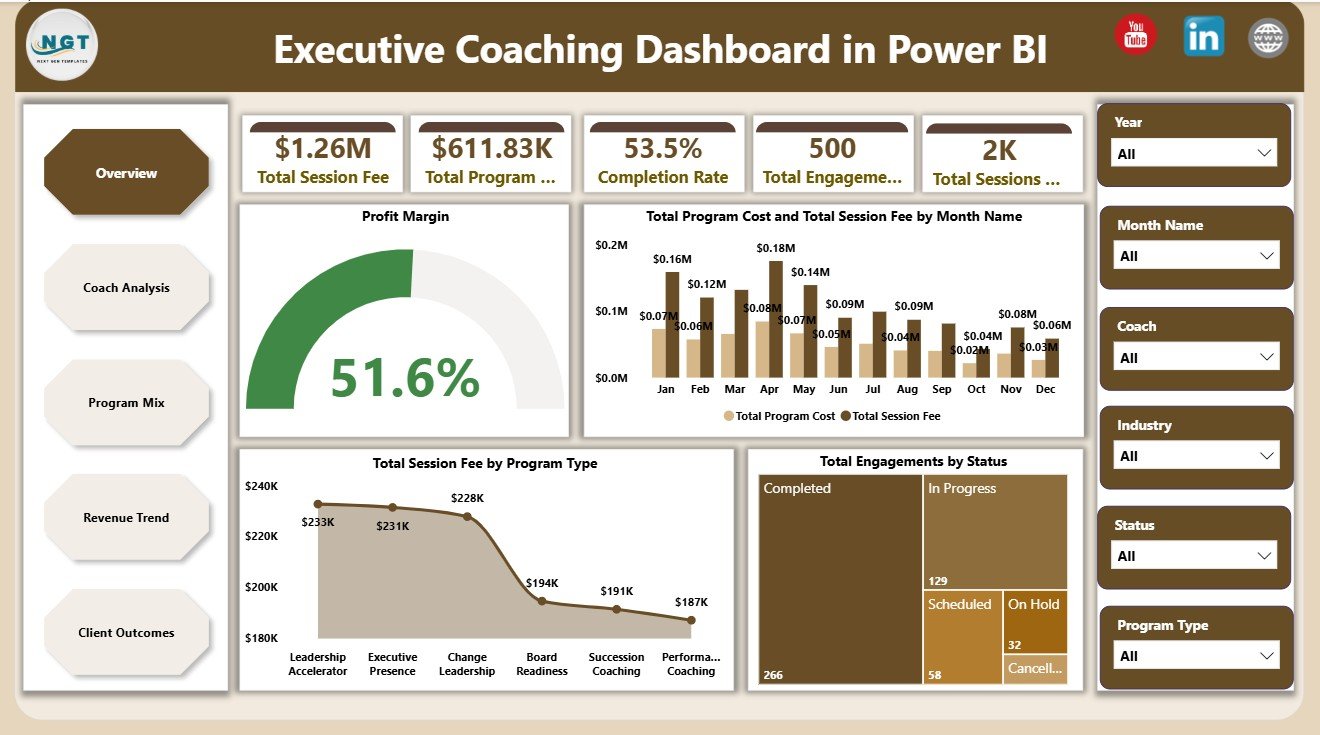
The Overview Page gives leaders a fast summary of coaching portfolio performance. The top card section shows Total Session Fee, Total Program Cost, Completion Rate, Total Engagements, and Total Sessions, so users can understand the size and health of the coaching operation immediately.
Profit Margin by Overall Coaching Portfolio: This chart explains whether the coaching portfolio is profitable after comparing revenue and program cost. It helps leaders focus on financial efficiency instead of only tracking activity volume.
Total Program Cost and Total Session Fee by Month Name: This chart compares monthly fees and costs side by side. It helps identify seasonal demand, cost-heavy periods, and months where margin may need closer review.
Total Session Fee by Program Type: This visual shows which program types contribute the most session fee revenue. It helps coaching teams prioritize high-value offerings and review underperforming program categories.
Total Engagements by Status: This chart separates coaching engagements by status. It helps users understand how many engagements are active, completed, delayed, or pending without reviewing raw records.
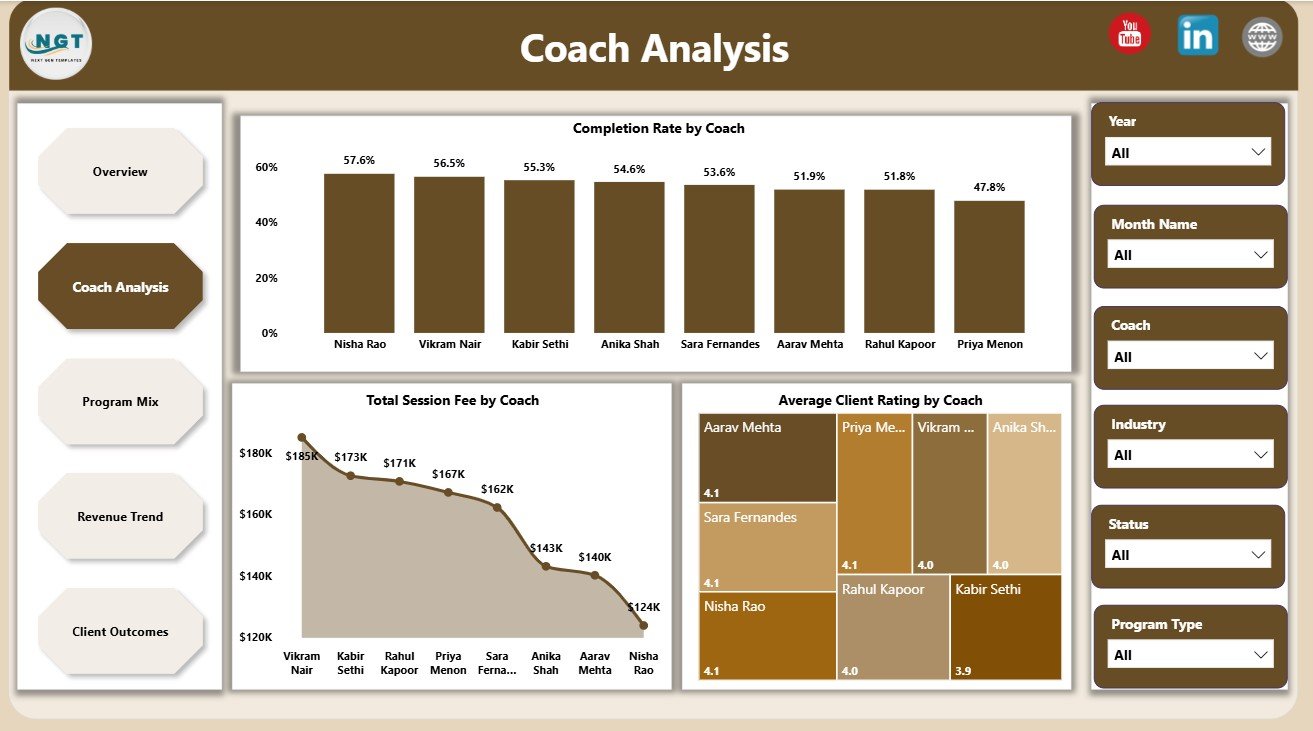
2. Coach Analysis
The Coach Analysis page focuses on individual coach contribution and delivery quality. Completion Rate by Coach shows whether coaches are completing engagements successfully, Total Session Fee by Coach highlights revenue contribution, and Average Client Rating by Coach gives a quality signal from client feedback.
3. Program Mix
The Program Mix page shows how different coaching programs, industries, and client levels contribute to revenue and cost. Total Program Cost and Total Session Fee by Program Type helps compare investment and income, Total Session Fee by Industry shows where demand is strongest, and Net Coaching Revenue by Client Level explains which client segments are creating value.

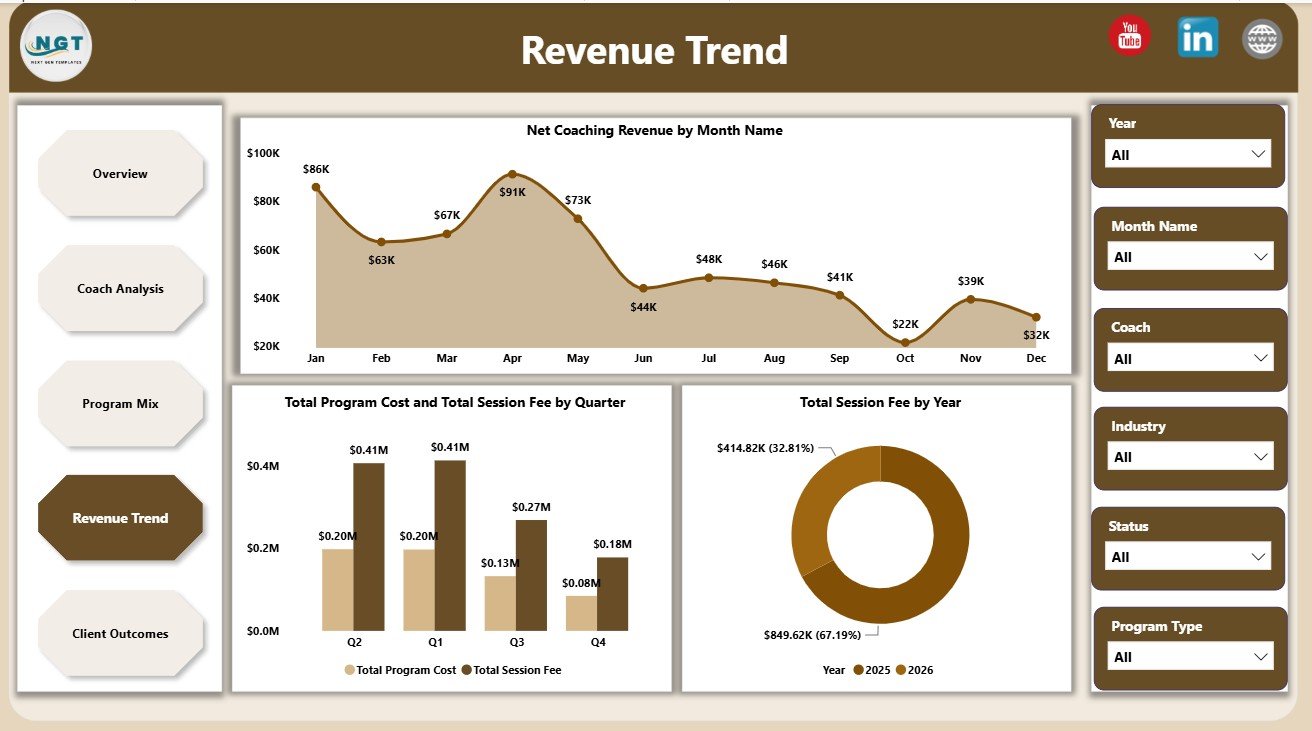
4. Revenue Trend
The Revenue Trend page helps users understand movement over time. Net Coaching Revenue by Month Name shows month-to-month performance, Total Program Cost and Total Session Fee by Quarter supports quarterly review, and Total Session Fee by Year gives a longer-term revenue perspective.
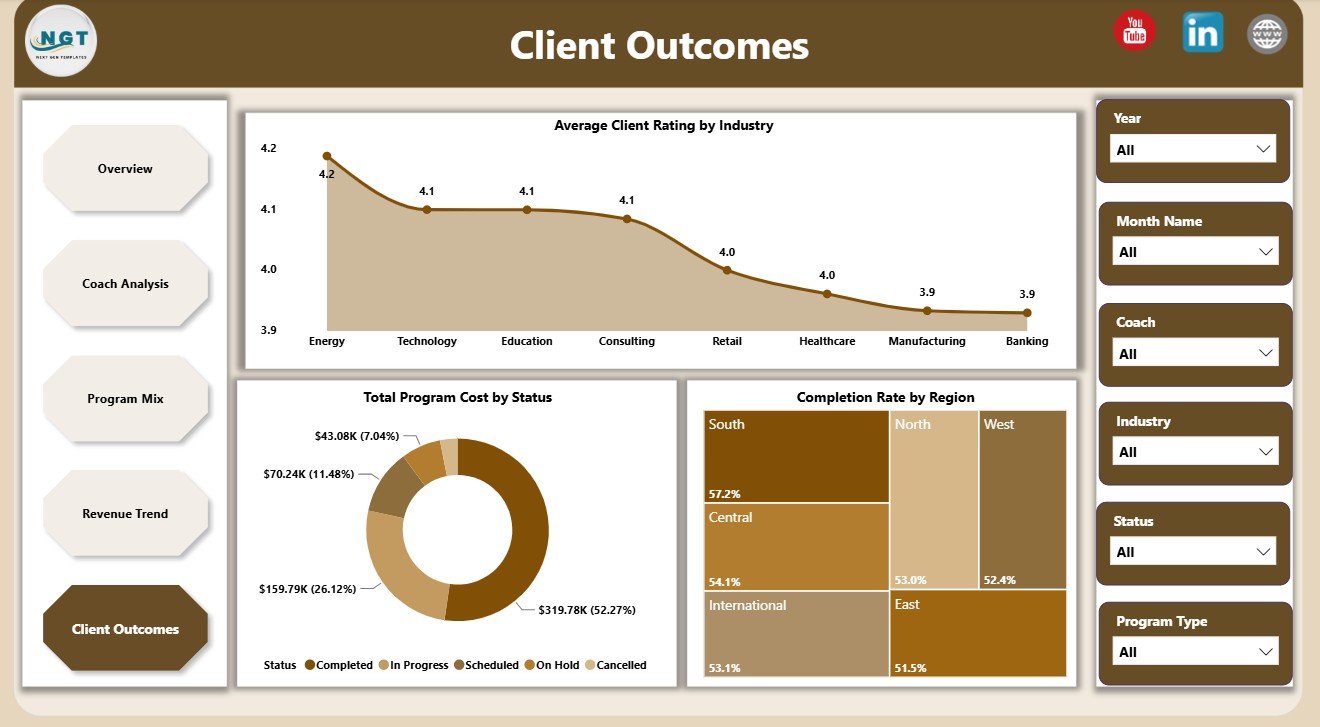
5. Client Outcomes
The Client Outcomes page connects coaching delivery with satisfaction and regional results. Average Client Rating by Industry helps identify strong or weak experience patterns, Total Program Cost by Status shows where money is tied up, and Completion Rate by Region highlights where delivery performance varies.
Executive Coaching Dashboard in Power BI vs. Tableau vs. Paid CRM/SaaS – Feature Comparison
| Feature | This Power BI Dashboard | Tableau Alternative | Paid Coaching CRM/SaaS |
|---|---|---|---|
| Cost | $17.99 one-time | License or development cost | Monthly or annual subscription |
| Platform | Power BI Desktop | Tableau Desktop or Cloud | Vendor cloud platform |
| Setup time | Replace data and refresh | Build or adapt workbook | Onboarding and configuration |
| Collaboration | Available through Power BI Service | Available through Tableau Cloud | Usually built in |
| Custom fields | Editable model and visuals | Editable if you own workbook | Limited by plan |
| Coaching revenue analysis | Included across multiple pages | Requires setup | Depends on vendor |
| Year-1 cost at 5 users | $17.99 plus Microsoft licensing if used | Potential license and build cost | Often hundreds or thousands |
Who Should Use This Template
This dashboard is useful for executive coaches, coaching firms, HR leaders, talent development managers, leadership development consultants, L&D analysts, and business analysts who manage coaching programs. It is especially helpful when users need to present performance clearly in management meetings, client reviews, or internal coaching strategy discussions.
It is not meant to replace appointment booking, invoicing, client login portals, or HR systems. It is best used as a reporting layer for structured coaching data.
Real-World Use Cases
HR director: A talent leader uses the Overview and Client Outcomes pages before quarterly leadership meetings to explain total sessions, total fees, program costs, and completion rate by region.
Coaching firm owner: A firm owner uses Coach Analysis to compare coach revenue contribution and client ratings before assigning new engagements.
L&D analyst: An analyst uses Program Mix and Revenue Trend to identify which programs, industries, and client levels are contributing the strongest net coaching revenue.
Advantages of Executive Coaching Dashboard in Power BI
Power BI makes the dashboard interactive and easier to filter than static reports. Users can move between portfolio, coach, program, revenue, and outcome analysis without creating separate files for every stakeholder.
Power BI Desktop is also flexible for customization. Users can update visuals, add measures, adjust fields, connect a different data source, or publish to Power BI Service when sharing is required. Microsoft provides official guidance for Power BI report building and publishing on Microsoft Learn Power BI documentation.
Opportunities for Improvement
Organizations can extend the dashboard by adding behavioral assessment scores, leadership competency data, post-session survey details, coach utilization targets, or HR system integration. Advanced teams may also connect the report to SharePoint, SQL, or cloud data sources for a more automated reporting process.
Best Practices
- Keep coach, program type, industry, region, and status names consistent.
- Review completion rate and client rating together, not separately.
- Compare session fee with program cost before making profitability decisions.
- Use slicers during meetings to answer stakeholder questions quickly.
- Refresh and validate the report before sharing it with executives or clients.
Explore Relevant Templates
- Executive Coaching Dashboard in Power BI
- Executive Coaching Dashboard in Excel
- Executive Coaching KPI Dashboard in Power BI
- Power BI Dashboard Templates
Frequently Asked Questions
What is the Executive Coaching Dashboard in Power BI?
It is a Power BI report template for analyzing coaching fees, program costs, completion rate, engagements, coach performance, program mix, revenue trends, and client outcomes.
What pages are included?
The dashboard includes Overview, Coach Analysis, Program Mix, Revenue Trend, and Client Outcomes pages.
Can I use my own coaching data?
Yes. Replace the sample data with your own structured coaching records and refresh the Power BI report.
Do I need Power BI Desktop?
Yes. Open and edit the .pbix file in Power BI Desktop. Publishing online requires Power BI Service access.
Can the dashboard be customized?
Yes. You can edit visuals, add fields, change colors, adjust calculations, and connect different data sources.
About the Author
Built by PK – Microsoft Certified Professional with 15+ years of Excel, Google Sheets, and Power BI experience. Founder of NextGenTemplates, reaching 300K+ subscribers across YouTube channels. Every template is hand-built and tested before release.
Conclusion
The Executive Coaching Dashboard in Power BI helps coaching teams move from scattered spreadsheets to clear, interactive analytics. With pages for overview, coach performance, program mix, revenue trends, and client outcomes, users can review both financial and delivery performance in one reporting file.
Click here to purchase Executive Coaching Dashboard in Power BI
Visit our YouTube channel to learn step-by-step Excel and Power BI tutorials.