New: NextGenTemplates Academy - video courses on Excel formulas with AI and Pivot Tables & dashboards. Early-bird: 20% off with code EARLYBIRD20 - first 20 orders only. See the courses →
  • Learn Excel (Free Course)
    • 1. Shortcut Keys
    • 2. Fill & Flash Fill
    • 3. Find & Replace
    • 4. Sort & Filter
    • 5. Formulas & Functions
    • 6. Data Validation
    • 7. Conditional Formatting
    • 8. Basic Charts
    • 9. Advanced Charts
    • 10. Pivot Tables
    • 11. Excel Dashboards
    • 12. VBA Course
    • 13. Excel Formulas with AI
  • Templates
  • Tutorials
    • Charts and Visualization
    • VBA
    • Excel Tips and Tricks
    • Excel Dashboards
    • Power Pivot & DAX
  • Power BI
  • Template Store
    • Ready to Use Templates
  • Courses
  • Academy
    • Excel + AI Mastery: 100 Formulas
    • Excel Pivot Tables & Dashboards
  • About Us
  • Contact Us

PK: An Excel Expert

Transforming Data into Decisions

Tag: Performance Metrics

Dashboard

Supply Chain and Logistics Financial Health KPI Dashboard in Excel

May 15, 2025May 15, 2025 PKComments Off on Supply Chain and Logistics Financial Health KPI Dashboard in Excel
In the fast-moving world of supply chain and logistics, financial clarity is no longer optional—it's essential. From tracking transportation costs to measuring inventory turnover, businesses need real-time, visual insights to
Read More
Power BI

HR Performance Dashboard in Power BI

May 8, 2025May 8, 2025 PKComments Off on HR Performance Dashboard in Power BI
In today's rapidly evolving business environment, keeping track of employee performance is crucial for HR departments to ensure the growth and success of the organization. Power BI offers a robust
Read More
Dashboard

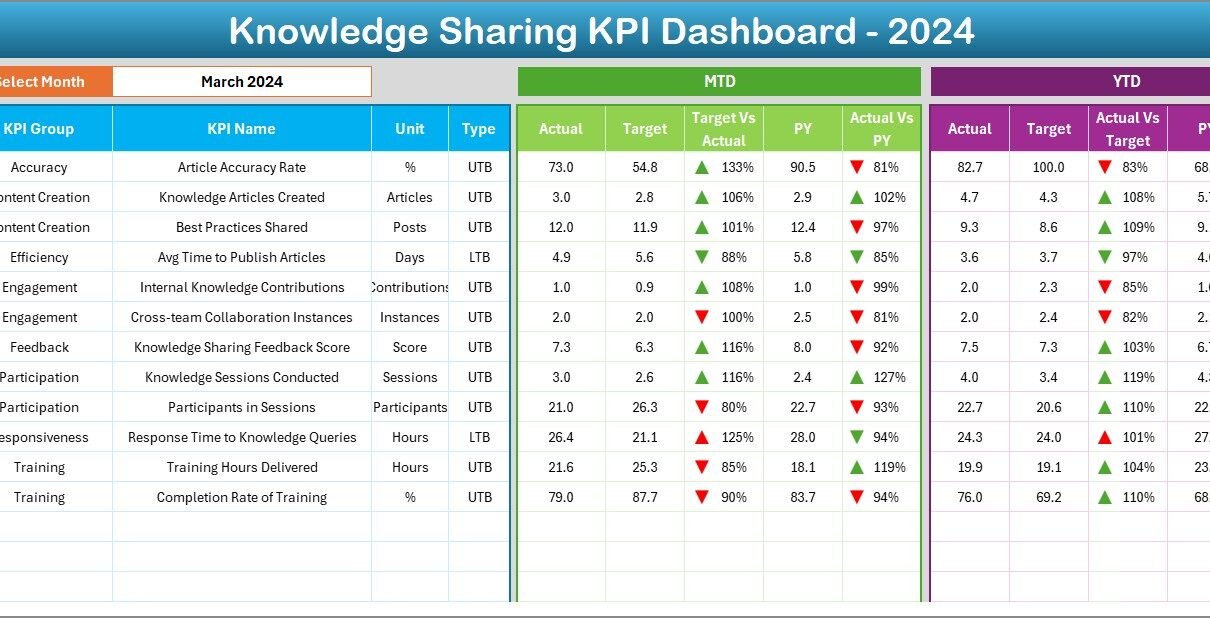
Knowledge Sharing KPI Dashboard in Excel

May 7, 2025May 7, 2025 PKComments Off on Knowledge Sharing KPI Dashboard in Excel
Effective knowledge sharing within an organization is critical for fostering innovation, improving collaboration, and enhancing productivity. A Knowledge Sharing KPI Dashboard in Excel helps track the key metrics associated with
Read More
Dashboard

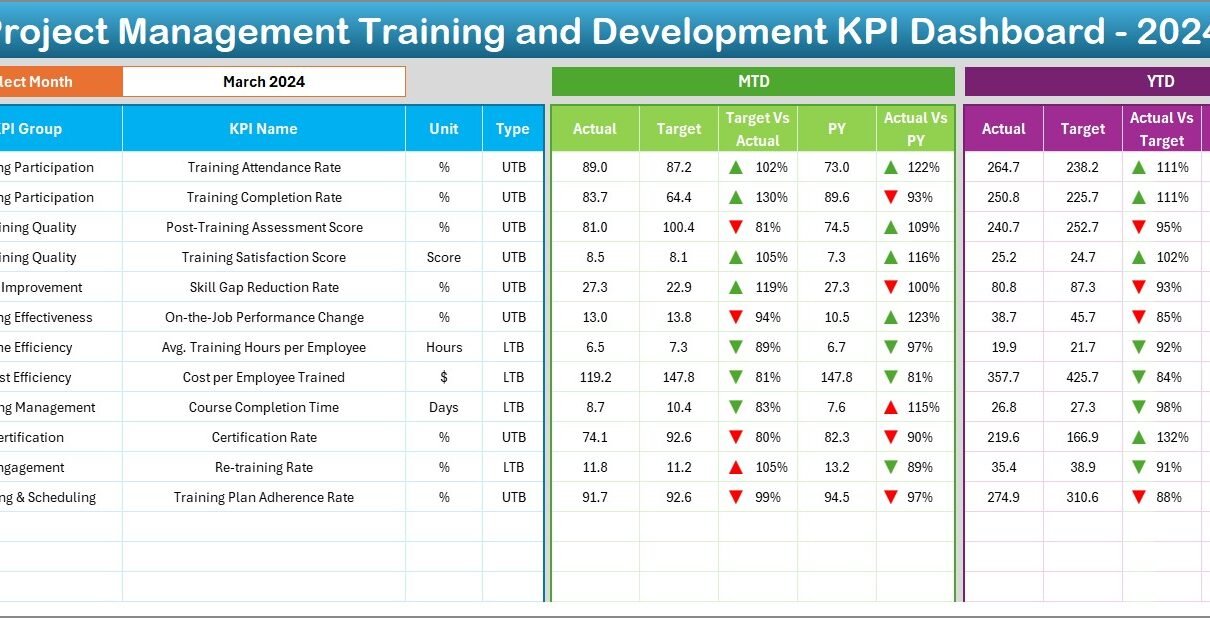
Project Management Training and Development KPI Dashboard in Excel

May 5, 2025May 5, 2025 PKComments Off on Project Management Training and Development KPI Dashboard in Excel
In today's rapidly evolving business environment, effective project management training and development play a crucial role. However, tracking and measuring the success of these training programs can often become overwhelming.
Read More
Dashboard

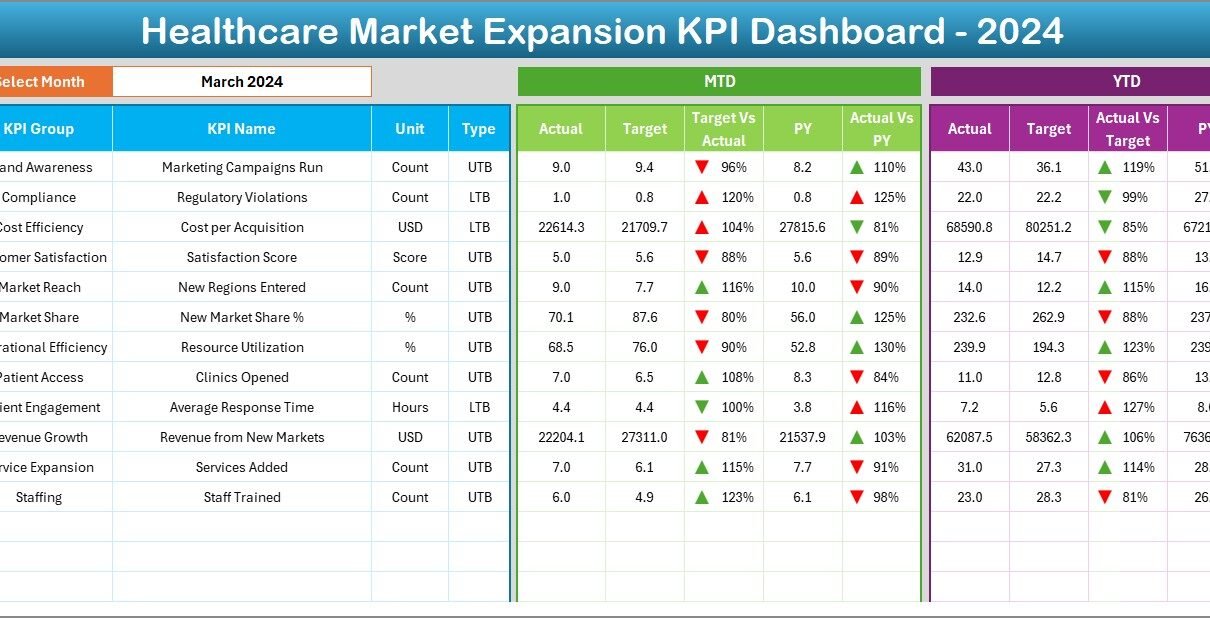
Healthcare Market Expansion KPI Dashboard in Excel

May 3, 2025May 3, 2025 PKComments Off on Healthcare Market Expansion KPI Dashboard in Excel
In today’s rapidly evolving healthcare industry, expanding into new markets isn’t just about launching services—it’s about making smart, data-driven decisions. That’s where a Healthcare Market Expansion KPI Dashboard in Excel
Read More
Dashboard

Healthcare Performance KPI Dashboard in Excel

April 30, 2025April 30, 2025 PKComments Off on Healthcare Performance KPI Dashboard in Excel
In today's fast-paced medical environment, healthcare organizations must track performance precisely and efficiently. That’s why a Healthcare Performance KPI Dashboard in Excel becomes a powerful tool. It not only centralizes important metrics
Read More
Dashboard

Landing Page Performance KPI Dashboard in Excel

April 17, 2025April 17, 2025 PKComments Off on Landing Page Performance KPI Dashboard in Excel
In the world of digital marketing, understanding how your landing pages perform is crucial to making informed decisions that drive business growth. Landing pages are often the first interaction point
Read More
Dashboard

Sales and Marketing Training and Development KPI Dashboard in Excel

April 14, 2025April 14, 2025 PKComments Off on Sales and Marketing Training and Development KPI Dashboard in Excel
In today’s competitive business landscape, the growth of a sales and marketing team depends heavily on continuous learning and development. However, tracking progress, evaluating performance, and identifying areas of improvement
Read More
Dashboard

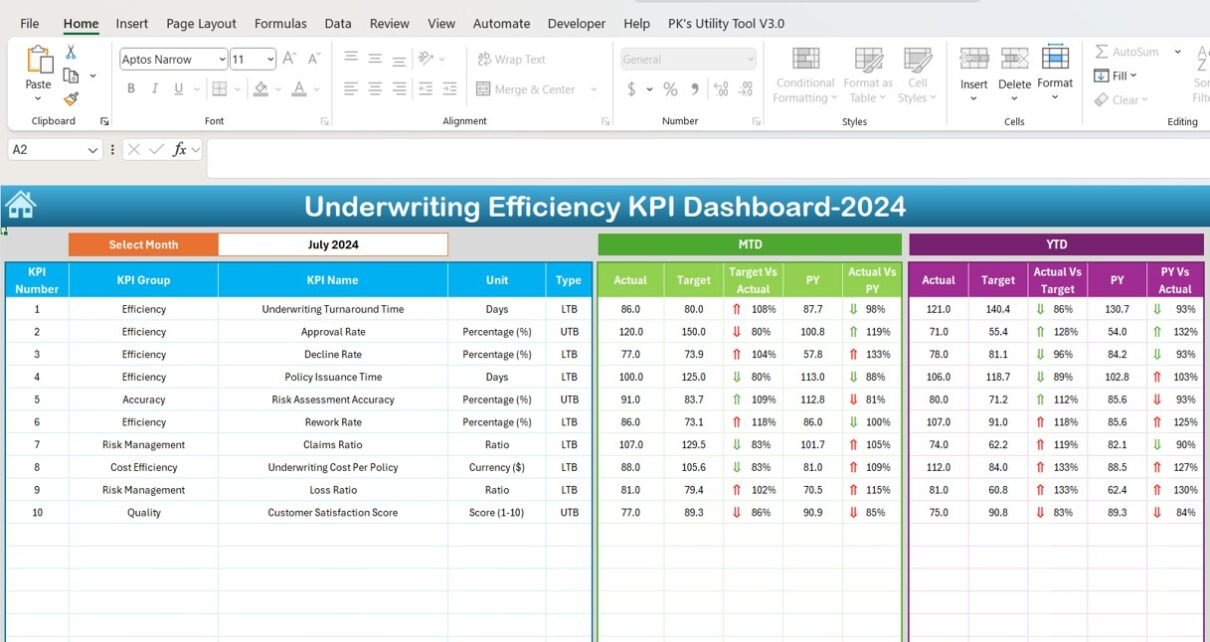
Underwriting Efficiency KPI Dashboard in Excel

March 27, 2025March 27, 2025 PKComments Off on Underwriting Efficiency KPI Dashboard in Excel
In the fast-paced world of underwriting, measuring efficiency is crucial. The Underwriting Efficiency KPI Dashboard in Excel provides a comprehensive tool for monitoring and optimizing underwriting performance. This article will
Read More
Dashboard

Workload Balance KPI Dashboard in Excel

March 22, 2025March 22, 2025 PKComments Off on Workload Balance KPI Dashboard in Excel
In today’s fast-paced business world, balancing workload across teams and departments is more crucial than ever. Uneven task distribution, overwhelmed employees, or under-utilized resources can lead to missed deadlines, low
Read More

Posts pagination

Previous 1 … 3 4 5 … 11 Next
  • Learn Excel (Free Course)
    • 1. Shortcut Keys
    • 2. Fill & Flash Fill
    • 3. Find & Replace
    • 4. Sort & Filter
    • 5. Formulas & Functions
    • 6. Data Validation
    • 7. Conditional Formatting
    • 8. Basic Charts
    • 9. Advanced Charts
    • 10. Pivot Tables
    • 11. Excel Dashboards
    • 12. VBA Course
    • 13. Excel Formulas with AI
  • Templates
  • Tutorials
    • Charts and Visualization
    • VBA
    • Excel Tips and Tricks
    • Excel Dashboards
    • Power Pivot & DAX
  • Power BI
  • Template Store
    • Ready to Use Templates
  • Courses
  • Academy
    • Excel + AI Mastery: 100 Formulas
    • Excel Pivot Tables & Dashboards
  • About Us
  • Contact Us
Copyright © 2023 PK-AnExcelExpert.com - Privacy Policy