In today’s fast-paced medical environment, healthcare organizations must track performance precisely and efficiently. That’s why a Healthcare Performance KPI Dashboard in Excel becomes a powerful tool. It not only centralizes important metrics but also gives hospital administrators, healthcare providers, and analysts a clear picture of what’s working and what needs attention.
This comprehensive article will walk you through everything you need to know about using an Excel-based Healthcare KPI Dashboard, its features, benefits, best practices, and frequently asked questions.
Click to Purchases Healthcare Performance KPI Dashboard in Excel
What is a Healthcare Performance KPI Dashboard in Excel?
A Healthcare KPI Dashboard is a visual representation of key performance indicators specifically tailored to track healthcare services, quality, patient care, resource usage, and operational efficiency. When built in Excel, it becomes a flexible, cost-effective, and easy-to-use solution.
Instead of juggling multiple reports or software, stakeholders can monitor performance using a single dashboard and make informed decisions instantly.
Key Features of the Healthcare KPI Dashboard in Excel
This Excel-based dashboard template includes 7 well-structured worksheets to streamline performance tracking and analysis.
Home Sheet

- Serves as the dashboard’s landing page.
- Includes 6 clickable buttons to navigate directly to other sheets.
- Clean layout that acts as the control center of the tool.
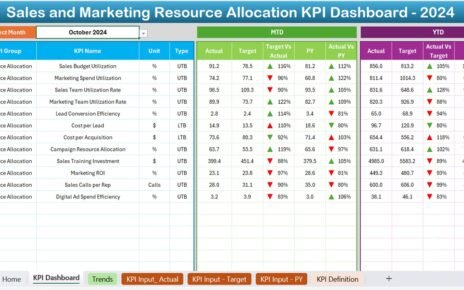
Dashboard Sheet

- Main visual display of all KPIs.
- Allows users to select a specific month via a drop-down (cell D3).
- Automatically updates:
- MTD (Month-to-Date) Actual, Target, and Previous Year
- YTD (Year-to-Date) Actual, Target, and Previous Year
- Features conditional formatting with arrows to show progress or decline.
KPI Trend Sheet

- View trends for each KPI over time.
- Drop-down selection in cell C3 to choose a KPI.
- Displays:
- KPI Group
- KPI Unit
- KPI Type (LTB or UTB)
- Formula and Definition
- Line charts to show trends of MTD, YTD, Target, and Previous Year.
Actual Numbers Input Sheet

- Input actual data monthly.
- Change the reporting start month from cell E1.
- Helps maintain consistency for MTD and YTD calculations.
Target Sheet

- Input monthly and yearly target values for each KPI.
- Used as the benchmark for comparing actual performance.
Previous Year Number Sheet

- Enter last year’s data.
- Helps with year-on-year comparison and trend analysis.
KPI Definition Sheet

- Maintain a structured list of:
- KPI Name
- KPI Group
- Unit of Measurement
- Formula
- Short definition
- Critical for team understanding and standardization.
Click to Purchases Healthcare Performance KPI Dashboard in Excel
Advantages of Using a Healthcare KPI Dashboard in Excel
📊 Easy to Customize
You can adjust the layout, formulas, or visuals without specialized software knowledge.
📚 Centralized Data Management
No need to switch between platforms. Everything sits in one file and updates dynamically.
📈 Real-Time Monitoring
With monthly input and auto-refreshing dashboards, you get up-to-date insights for decision-making.
🚀 Improved Operational Efficiency
You quickly identify underperforming areas, speeding up response time and corrective action.
✅ Enhanced Accountability
Clear KPI definitions and regular updates make team members more accountable.
Best Practices for Using the Healthcare KPI Dashboard
Define Your KPIs Clearly
Each KPI should include:
- Name
- Definition
- Measurement Unit
- Goal or Target
- Keep It Simple
Avoid overcrowding the dashboard. Highlight only essential KPIs and keep navigation intuitive.
Update Data Consistently
Designate a day each month for data entry to keep the dashboard reliable.
Use Conditional Formatting Wisely
Visual cues (like arrows or color scales) make interpretation faster and more intuitive.
Review and Refine
Periodically review your KPIs and dashboard design to align with evolving goals or practices.
Why Excel for Healthcare KPI Tracking?
Excel remains a go-to tool for many professionals for good reasons:
- Accessible: Almost everyone in the organization can use it.
- Powerful Functions: Use of formulas, data validation, charts, and conditional formatting.
- Cost-Effective: No additional software or license required.
- Highly Compatible: Easily integrates with CSVs, reports, and other systems.
Use Case Examples for Healthcare KPI Dashboard
🏥 Hospital Performance Tracking
Monitor patient wait times, bed occupancy rates, infection rates, etc.
Patient Satisfaction
Track satisfaction survey scores, average discharge time, and response rates.
🏆 Staff Performance
Monitor staff-to-patient ratios, training compliance, and task completion efficiency.
Conclusion
If you’re in the healthcare sector, performance tracking isn’t just about numbers—it’s about delivering quality patient care, maximizing efficiency, and driving long-term improvements. With this ready-to-use Healthcare Performance KPI Dashboard in Excel, you can manage and monitor all key metrics in one place.
The dashboard combines simplicity, clarity, and data power in a single tool. Whether you run a hospital, clinic, or healthcare network, this Excel template offers a solid foundation for data-driven success.
Frequently Asked Questions (FAQs)
Who can use the Healthcare Performance KPI Dashboard in Excel?
This dashboard suits hospital administrators, clinic managers, health analysts, and quality assurance teams.
Is Excel a reliable tool for KPI tracking in healthcare?
Yes, Excel is widely trusted due to its flexibility, advanced functions, and accessibility.
Can I customize this dashboard for my organization?
Absolutely. You can change KPI names, formulas, visuals, and layouts to meet your unique needs.
How often should I update the dashboard?
Monthly updates are ideal to maintain relevance and track progress accurately.
What makes this dashboard better than online tools?
This Excel tool works offline, requires no subscription, and can be easily shared and modified.
Click to Purchases Healthcare Performance KPI Dashboard in Excel
Visit our YouTube channel to learn step-by-step video tutorials