In today’s competitive business world, retaining top talent has become just as important as hiring them. High employee turnover impacts productivity, morale, and the bottom line. That’s why HR professionals rely on Employee Retention KPI Dashboards to track and improve retention strategies. This article walks you through everything you need to know about creating and using a Human Resources Employee Retention KPI Dashboard in Excel, including its structure, benefits, best practices, and common FAQs.
🔍 What Is an Employee Retention KPI Dashboard?
Click to Purchases Human Resources Employee Retention KPI Dashboard in Excel
An Employee Retention KPI Dashboard is a visual management tool used by HR departments to monitor, analyze, and optimize key performance indicators related to employee retention. These dashboards allow HR managers to keep track of monthly and yearly trends, spot early signs of disengagement, and take corrective actions quickly.
Instead of flipping through scattered reports, Excel dashboards provide a single-screen view of performance metrics. With clearly defined KPIs, conditional formatting, and dropdown selectors, decision-making becomes faster and more data-driven.
📊 Overview of the Excel-Based Retention KPI Dashboard
We’ve built a ready-to-use Employee Retention KPI Dashboard in Excel that is both intuitive and powerful. It is designed to help HR departments track the health of employee engagement and retention efforts across months and years.
🗂 Key Worksheets in the Dashboard
Let’s walk through each tab included in this dashboard and what it offers:
⃣ Home Sheet (Navigation Panel)

This is the central index of your dashboard. It contains 6 clickable buttons that allow you to jump directly to other worksheets. This makes navigation faster and more user-friendly, especially for large HR teams.
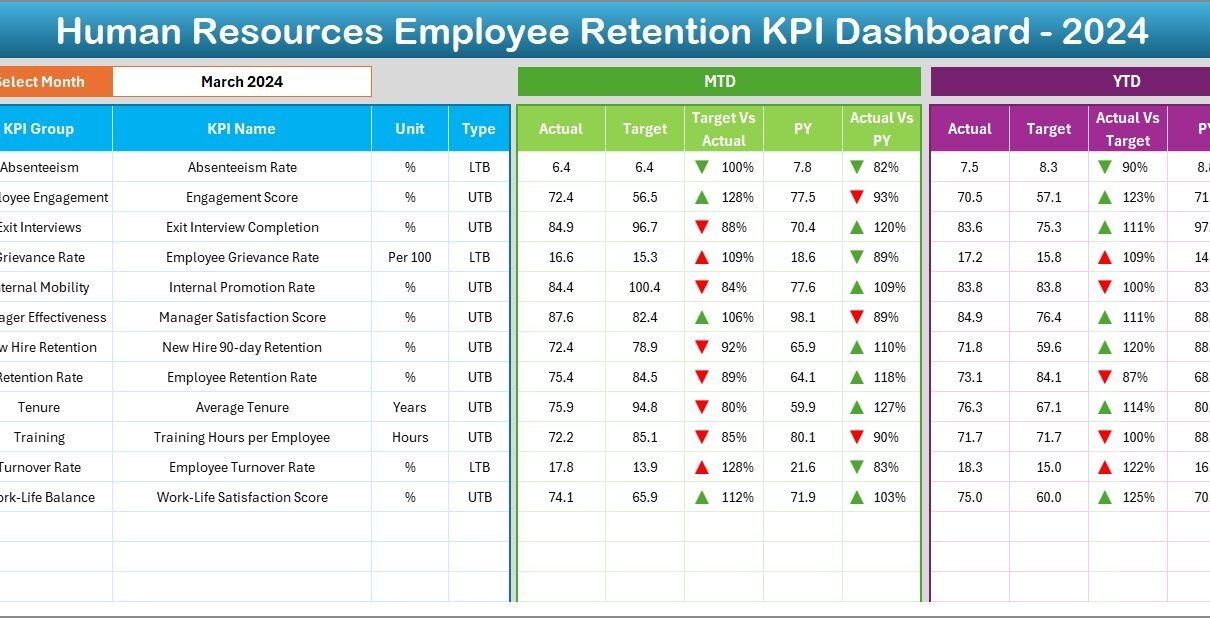
⃣ Dashboard Sheet (Core Visual Analytics)
This is the heart of the dashboard. Here’s what you get:

- Dropdown for Month Selection (Cell D3): Allows you to select any month and instantly refresh KPI data accordingly.
- MTD and YTD Data: Compare the Month-to-Date (MTD) and Year-to-Date (YTD) values for each KPI.
- Target vs. Actual: Track progress toward goals with visual cues.
- Previous Year Comparison: Evaluate performance growth or decline.
- Conditional Formatting: Up and down arrows show if you’re improving or falling behind.
⃣ KPI Trend Sheet

This sheet offers a detailed visual and data-based breakdown of each KPI.
- Drop-down (Cell C3): Choose the KPI you want to analyze.
- KPI Information Displayed: Group, Unit, Formula, Definition, and Type (UTB or LTB).
- Trend Charts: See how the selected KPI performs across the year for Actual, Target, and Previous Year.
⃣ Actual Numbers Input Sheet

All real-time HR data (MTD and YTD) goes here. Just enter the actual figures for each KPI every month. Use Cell E1 to select the starting month of your fiscal year to align all data accordingly.
⃣ Target Sheet

Set clear monthly and yearly goals. For each KPI, input both MTD and YTD targets for all months. These targets drive the visuals on your main dashboard.
Click to Purchases Human Resources Employee Retention KPI Dashboard in Excel
⃣ Previous Year Data Sheet
Add last year’s monthly performance numbers here. This comparison helps in understanding long-term trends and seasonality in employee retention.
7️⃣ KPI Definition Sheet
Maintain documentation of all KPIs here. Include:
- KPI Name
- KPI Group
- Unit
- Formula
- KPI Definition
This sheet acts as your reference and helps stakeholders understand each metric at a glance.
✅ Advantages of Using an Employee Retention KPI Dashboard
Why should HR teams adopt this Excel-based dashboard? Here’s why it’s a game-changer:
📈 1. Real-Time Monitoring
Instantly track if your team is meeting retention benchmarks every month.
💡 2. Better Decision Making
With monthly trends and comparisons, managers can make quick, informed decisions.
🧠 3. Improved Strategic Planning
Use long-term data and comparisons to create effective HR policies and improve employee engagement.
📉 4. Early Warning System
Spot retention issues early using conditional formatting and negative trends.
📊 5. Data-Driven Conversations
Enhance your boardroom discussions with clear visuals and up-to-date numbers.
⭐ Best Practices for Employee Retention KPI Dashboards
To get the most out of your dashboard, follow these best practices:
- Define Clear KPIs
Start by selecting KPIs that are measurable, actionable, and aligned with your HR goals.
- Keep It Updated Monthly
Ensure your actual numbers are entered every month to keep the dashboard relevant.
- Use Simple Visuals
Avoid clutter. Use clean charts, arrows, and color codes for quick data interpretation.
- Compare Past with Present
Always include previous year data to understand long-term shifts in performance.
- Use Conditional Formatting Smartly
Highlight trends using arrows, colors, or icons to improve user understanding.
- Align With Strategic Goals
Make sure your KPIs reflect the larger goals of the organization — not just numbers in isolation.
🧰 Who Should Use This Dashboard?
This dashboard is perfect for:
- HR Managers and Directors
- Recruitment Teams
- Talent Development Professionals
- CHROs (Chief Human Resource Officers)
- Business Leaders focusing on workforce planning
Whether you’re in a startup or an enterprise, tracking employee retention helps build a more stable and engaged workforce.
💼 Why Use Excel for Employee Retention KPIs?
While tools like Power BI or Tableau offer advanced capabilities, Excel still remains one of the most accessible and powerful tools for HR reporting. Here’s why:
- 📌 Easy to customize
- 📌 Widely available across organizations
- 📌 Supports automation using formulas and VBA
- 📌 No additional software required
- 📌 Simple sharing and version control
🧭 How to Get Started with the Dashboard
Follow these simple steps:
- Download the Template
Start with the ready-to-use Excel file with all sheets pre-designed. - Input Actual and Target Data
Use the “Actual Numbers” and “Target Sheet” to populate monthly values. - Customize KPI Names
Modify or add new KPIs in the KPI Definition Sheet to match your organization’s structure. - Use Dropdown to View Monthly Reports
Go to the Dashboard tab and select the month from the dropdown to get updated visuals. - Review Trends and Take Action
Analyze YTD and MTD trends, and compare them to targets and previous year to guide decisions.
📝 Conclusion
The Human Resources Employee Retention KPI Dashboard in Excel is more than just a spreadsheet—it’s your strategic partner in employee success. With visual trends, real-time insights, and customizable KPIs, this dashboard gives HR teams the clarity and control they need to reduce turnover, boost engagement, and foster a productive work environment.
If you’re serious about keeping your best talent, it’s time to stop guessing and start measuring with precision.
❓ Frequently Asked Questions (FAQs)
🔹 What is the most important KPI for employee retention?
The Employee Turnover Rate is often considered the most important as it directly shows how many employees are leaving over a period.
🔹 How often should I update the retention dashboard?
Update the actual numbers monthly to keep the dashboard accurate and relevant. For strategic meetings, use the YTD summaries.
🔹 Can I use this dashboard without any Excel expertise?
Yes! The dashboard is user-friendly. With drop-downs and simple input areas, no advanced Excel knowledge is required.
🔹 Can I add more KPIs to this dashboard?
Absolutely. Use the KPI Definition tab and extend rows across all sheets to include more KPIs as needed.
🔹 How is this better than using HR software?
While HR tools are useful, Excel dashboards offer more flexibility, no subscription costs, and instant customization.
🔹 What does MTD and YTD mean in this dashboard?
- MTD (Month-to-Date): Data for the selected month.
- YTD (Year-to-Date): Cumulative data from January to the selected month.
Click to Purchases Human Resources Employee Retention KPI Dashboard in Excel
Visit our YouTube channel to learn step-by-step video tutorials