New: NextGenTemplates Academy - video courses on Excel formulas with AI and Pivot Tables & dashboards. Early-bird: 20% off with code EARLYBIRD20 - first 20 orders only. See the courses →
  • Learn Excel (Free Course)
    • 1. Shortcut Keys
    • 2. Fill & Flash Fill
    • 3. Find & Replace
    • 4. Sort & Filter
    • 5. Formulas & Functions
    • 6. Data Validation
    • 7. Conditional Formatting
    • 8. Basic Charts
    • 9. Advanced Charts
    • 10. Pivot Tables
    • 11. Excel Dashboards
    • 12. VBA Course
    • 13. Excel Formulas with AI
  • Templates
  • Tutorials
    • Charts and Visualization
    • VBA
    • Excel Tips and Tricks
    • Excel Dashboards
    • Power Pivot & DAX
  • Power BI
  • Template Store
    • Ready to Use Templates
  • Courses
  • Academy
    • Excel + AI Mastery: 100 Formulas
    • Excel Pivot Tables & Dashboards
  • About Us
  • Contact Us

PK: An Excel Expert

Transforming Data into Decisions

Tag: pivot table dashboard

Dashboard

Energy Consumption Analysis Dashboard in Excel

April 13, 2026April 13, 2026 PKComments Off on Energy Consumption Analysis Dashboard in Excel
Energy Consumption Analysis Dashboard in Excel is a powerful, ready-to-use interactive analytics template designed for energy managers, facility operators, sustainability officers, and operations teams who need a centralized solution to
Read More
Dashboard

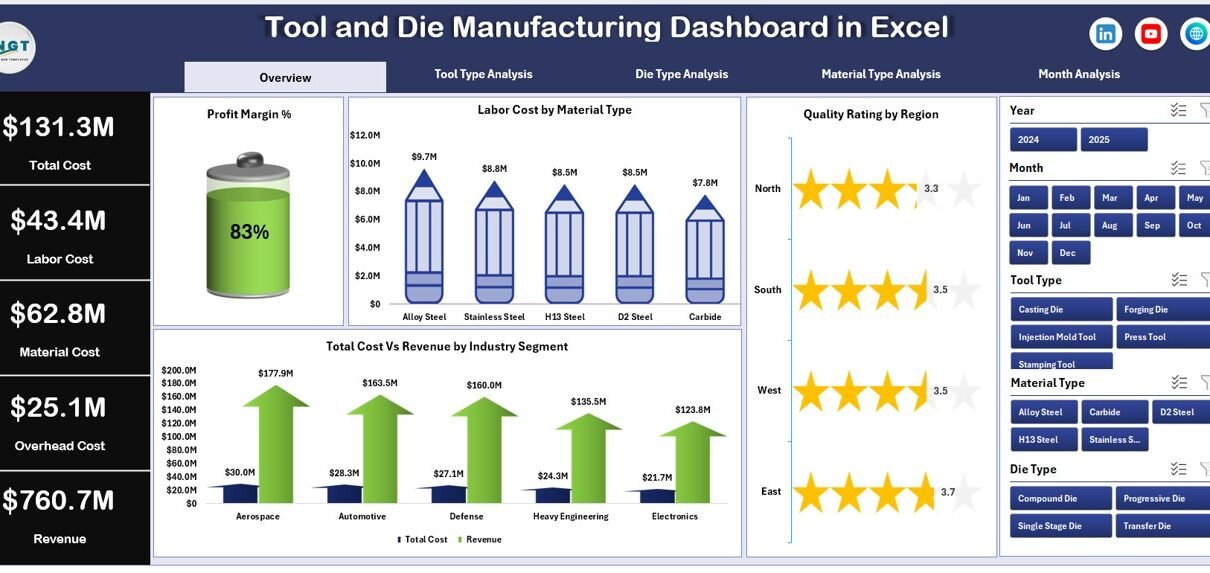
Tool and Die Manufacturing Dashboard in Excel

February 14, 2026February 14, 2026 PKComments Off on Tool and Die Manufacturing Dashboard in Excel
Manufacturing leaders face constant pressure. Production targets rise. Material prices change. Labor costs increase. Meanwhile, customers demand higher quality and faster delivery. Therefore, you must track profit, cost, and quality
Read More
Dashboard

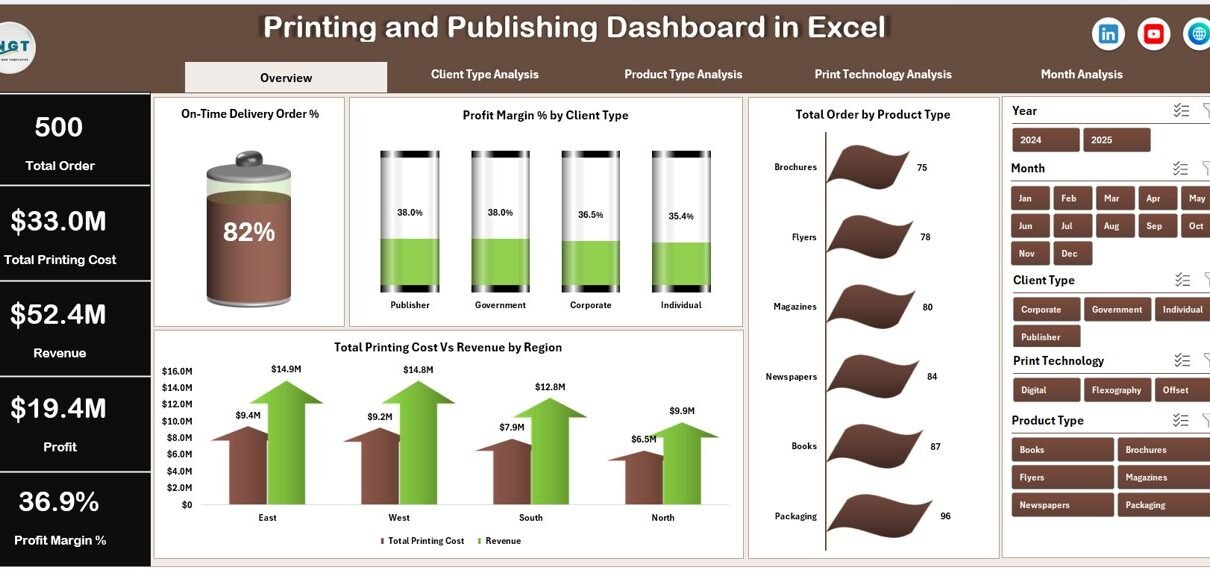
Printing and Publishing Dashboard in Excel

February 13, 2026February 13, 2026 PKComments Off on Printing and Publishing Dashboard in Excel
The printing and publishing industry moves fast. Clients demand quality. Deadlines stay tight. Costs fluctuate daily. Meanwhile, profit margins shrink when businesses fail to track performance clearly. However, many printing
Read More
Dashboard

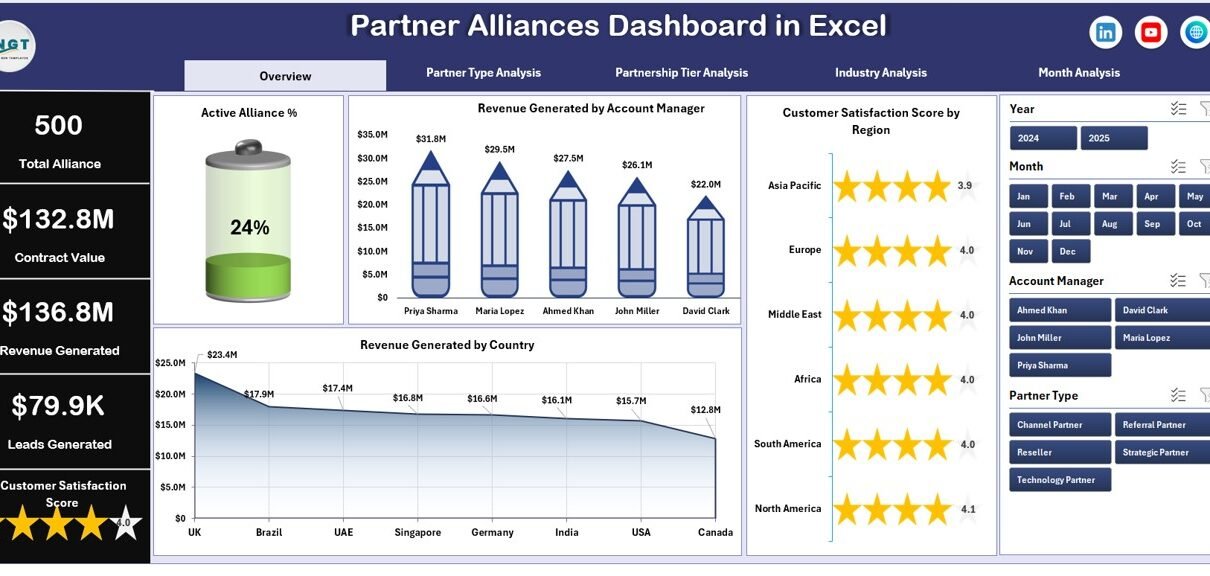
Partner Alliances Dashboard in Excel

February 11, 2026February 11, 2026 PKComments Off on Partner Alliances Dashboard in Excel
Strategic partnerships drive growth. However, many businesses still track alliances using scattered Excel files, email reports, and manual summaries. As a result, leaders struggle to measure partner performance, revenue contribution,
Read More
Dashboard

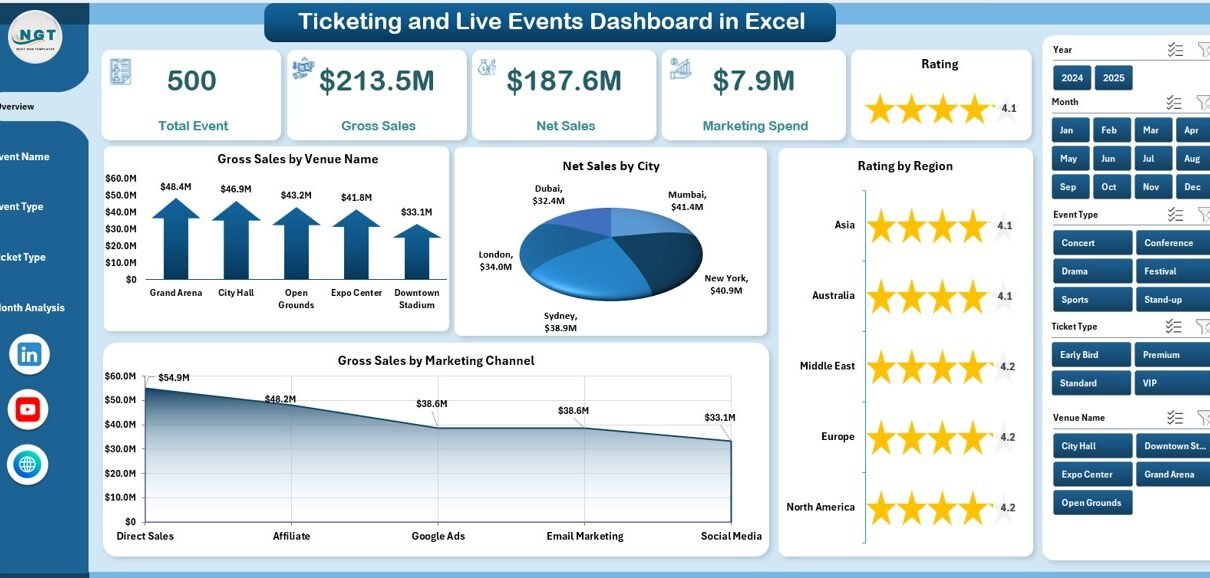
Ticketing and Live Events Dashboard in Excel

February 6, 2026February 6, 2026 PKComments Off on Ticketing and Live Events Dashboard in Excel
The live events industry grows faster than ever. Concerts, corporate events, festivals, sports matches, and exhibitions attract massive audiences every month. However, event managers face intense competition, rising marketing costs,
Read More
Dashboard

Health Insurance Dashboard in Excel

January 19, 2026January 19, 2026 PKComments Off on Health Insurance Dashboard in Excel
Managing health insurance data without clear visibility creates confusion, delays, and financial risks. Every health insurance organization deals with large volumes of data related to premiums, claims, policy types, regions,
Read More
  • Learn Excel (Free Course)
    • 1. Shortcut Keys
    • 2. Fill & Flash Fill
    • 3. Find & Replace
    • 4. Sort & Filter
    • 5. Formulas & Functions
    • 6. Data Validation
    • 7. Conditional Formatting
    • 8. Basic Charts
    • 9. Advanced Charts
    • 10. Pivot Tables
    • 11. Excel Dashboards
    • 12. VBA Course
    • 13. Excel Formulas with AI
  • Templates
  • Tutorials
    • Charts and Visualization
    • VBA
    • Excel Tips and Tricks
    • Excel Dashboards
    • Power Pivot & DAX
  • Power BI
  • Template Store
    • Ready to Use Templates
  • Courses
  • Academy
    • Excel + AI Mastery: 100 Formulas
    • Excel Pivot Tables & Dashboards
  • About Us
  • Contact Us
Copyright © 2023 PK-AnExcelExpert.com - Privacy Policy