New: NextGenTemplates Academy - video courses on Excel formulas with AI and Pivot Tables & dashboards. Early-bird: 20% off with code EARLYBIRD20 - first 20 orders only. See the courses →
  • Learn Excel (Free Course)
    • 1. Shortcut Keys
    • 2. Fill & Flash Fill
    • 3. Find & Replace
    • 4. Sort & Filter
    • 5. Formulas & Functions
    • 6. Data Validation
    • 7. Conditional Formatting
    • 8. Basic Charts
    • 9. Advanced Charts
    • 10. Pivot Tables
    • 11. Excel Dashboards
    • 12. VBA Course
    • 13. Excel Formulas with AI
  • Templates
  • Tutorials
    • Charts and Visualization
    • VBA
    • Excel Tips and Tricks
    • Excel Dashboards
    • Power Pivot & DAX
  • Power BI
  • Template Store
    • Ready to Use Templates
  • Courses
  • Academy
    • Excel + AI Mastery: 100 Formulas
    • Excel Pivot Tables & Dashboards
  • About Us
  • Contact Us

PK: An Excel Expert

Transforming Data into Decisions

Tag: Power BI dashboard

Power BI Templates

Eco Resorts Dashboard in Power BI

September 12, 2026October 10, 2026 PKComments Off on Eco Resorts Dashboard in Power BI
Eco Resorts Dashboard in Power BI gives hospitality teams a structured way to review booking, revenue, occupancy, guest, channel, accommodation, and sustainability records. Five connected report pages turn a flat
Read More
Power BI Templates

Drone Services Dashboard in Power BI

September 12, 2026September 12, 2026 PKComments Off on Drone Services Dashboard in Power BI
A growing drone-services business can generate plenty of operational data while still leaving managers without a clear answer to basic questions: Which service lines create revenue? Where are flight hours
Read More
Dashboard Templates

Endpoint Protection Services Dashboard in Excel

September 12, 2026October 10, 2026 PKComments Off on Endpoint Protection Services Dashboard in Excel
Endpoint Protection Services Dashboard in Excel provides a structured way to turn operational security-service records into a clear management report. Instead of reviewing separate device lists, incident logs, financial extracts,
Read More
Dashboard Templates

Emotion AI Startups Dashboard in Excel

September 12, 2026September 12, 2026 PKComments Off on Emotion AI Startups Dashboard in Excel
Emotion AI ventures span facial vision, voice tone, text sentiment, biosignals and multimodal approaches, but comparing their operational and commercial data requires more than a single accuracy figure. The Emotion
Read More
Power BI Templates

Elevator Maintenance KPI Dashboard in Power BI

September 11, 2026October 10, 2026 PKComments Off on Elevator Maintenance KPI Dashboard in Power BI
Elevator Maintenance KPI Dashboard in Power BI turns monthly target, actual, and definition data into a direction-aware scorecard for 13 elevator-service indicators. It helps contractors, facilities teams, analysts, and managers
Read More
Dashboard Templates

Glass Installation KPI Dashboard in Excel

September 11, 2026September 11, 2026 PKComments Off on Glass Installation KPI Dashboard in Excel
The Glass Installation KPI Dashboard in Excel gives glazing teams one repeatable monthly view of 14 measures. Instead of rebuilding a slide deck from estimating, operations, quality, customer, and finance
Read More
Power BI Templates

Documentary Channels Dashboard in Power BI

September 11, 2026September 11, 2026 PKComments Off on Documentary Channels Dashboard in Power BI
The Documentary Channels Dashboard in Power BI reports on a 500-title, 1,955-episode catalog across 5 interactive report pages, 15 charts and scorecards, and 22 DAX measures, with 5 slicers available
Read More
Power BI Templates

DIY Craft Stores Dashboard in Power BI

September 11, 2026September 11, 2026 PKComments Off on DIY Craft Stores Dashboard in Power BI
Craft retail is a margin business dressed up as a hobby business. A single shop can carry seven or eight buying categories, several own-brand product lines, a marketplace channel, an
Read More
Power BI Templates

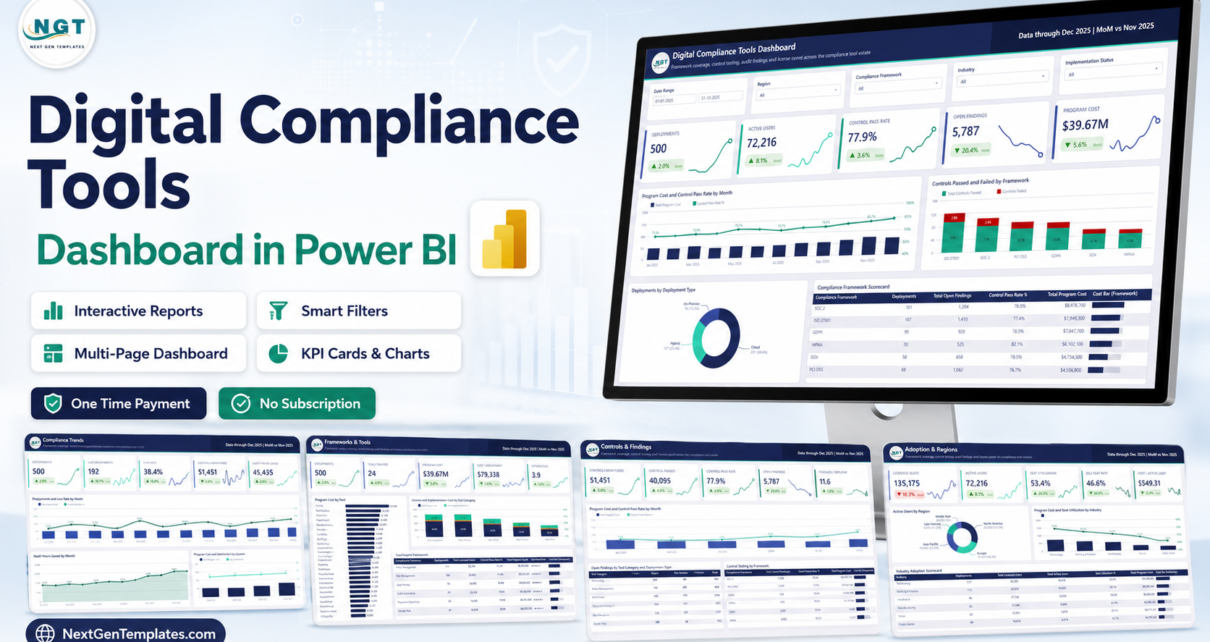
Digital Compliance Tools Dashboard in Power BI

September 6, 2026September 6, 2026 PKComments Off on Digital Compliance Tools Dashboard in Power BI
Most compliance teams can tell you how many tools they own. Very few can tell you what those tools cost per control tested, how many of the seats they pay
Read More
Dashboard Power BI

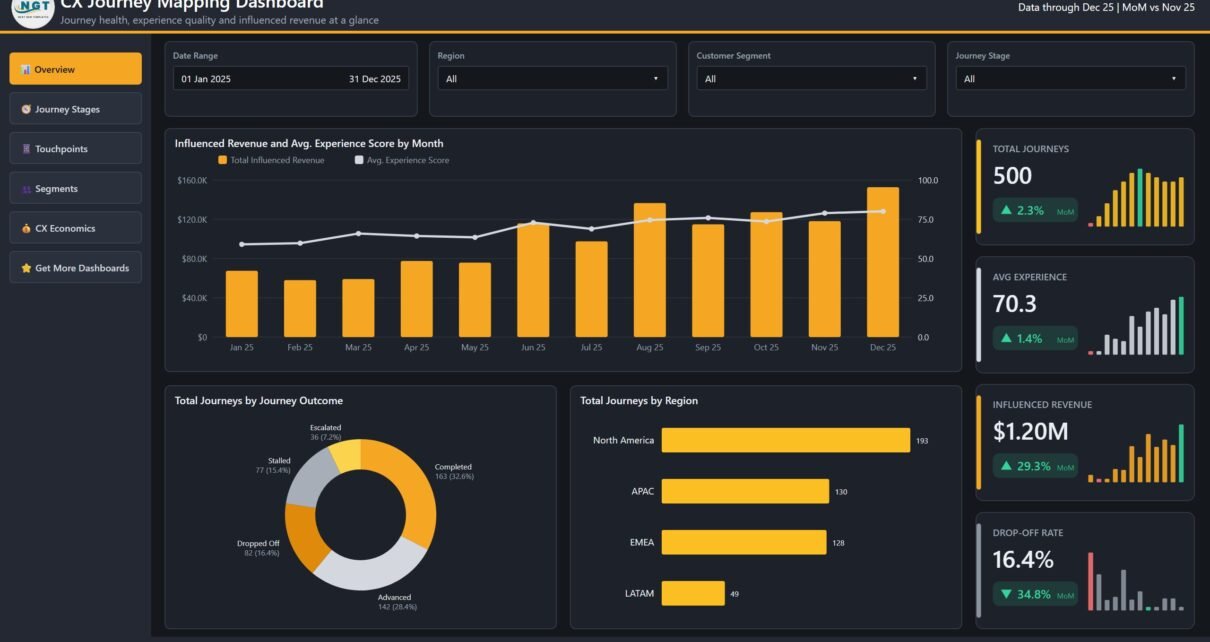
CX Journey Mapping Dashboard in Power BI

August 31, 2026August 31, 2026 PKComments Off on CX Journey Mapping Dashboard in Power BI
Most customer-experience reporting stops at a satisfaction score. The CX Journey Mapping Dashboard in Power BI goes further: it takes 500 sample customer journeys and shows where they stall, which
Read More

Posts pagination

Previous 1 2 3 4 … 85 Next
  • Learn Excel (Free Course)
    • 1. Shortcut Keys
    • 2. Fill & Flash Fill
    • 3. Find & Replace
    • 4. Sort & Filter
    • 5. Formulas & Functions
    • 6. Data Validation
    • 7. Conditional Formatting
    • 8. Basic Charts
    • 9. Advanced Charts
    • 10. Pivot Tables
    • 11. Excel Dashboards
    • 12. VBA Course
    • 13. Excel Formulas with AI
  • Templates
  • Tutorials
    • Charts and Visualization
    • VBA
    • Excel Tips and Tricks
    • Excel Dashboards
    • Power Pivot & DAX
  • Power BI
  • Template Store
    • Ready to Use Templates
  • Courses
  • Academy
    • Excel + AI Mastery: 100 Formulas
    • Excel Pivot Tables & Dashboards
  • About Us
  • Contact Us
Copyright © 2023 PK-AnExcelExpert.com - Privacy Policy