New: NextGenTemplates Academy - video courses on Excel formulas with AI and Pivot Tables & dashboards. Early-bird: 20% off with code EARLYBIRD20 - first 20 orders only. See the courses →
  • Learn Excel (Free Course)
    • 1. Shortcut Keys
    • 2. Fill & Flash Fill
    • 3. Find & Replace
    • 4. Sort & Filter
    • 5. Formulas & Functions
    • 6. Data Validation
    • 7. Conditional Formatting
    • 8. Basic Charts
    • 9. Advanced Charts
    • 10. Pivot Tables
    • 11. Excel Dashboards
    • 12. VBA Course
    • 13. Excel Formulas with AI
  • Templates
  • Tutorials
    • Charts and Visualization
    • VBA
    • Excel Tips and Tricks
    • Excel Dashboards
    • Power Pivot & DAX
  • Power BI
  • Template Store
    • Ready to Use Templates
  • Courses
  • Academy
    • Excel + AI Mastery: 100 Formulas
    • Excel Pivot Tables & Dashboards
  • About Us
  • Contact Us

PK: An Excel Expert

Transforming Data into Decisions

Tag: Power BI dashboard

Dashboard Power BI

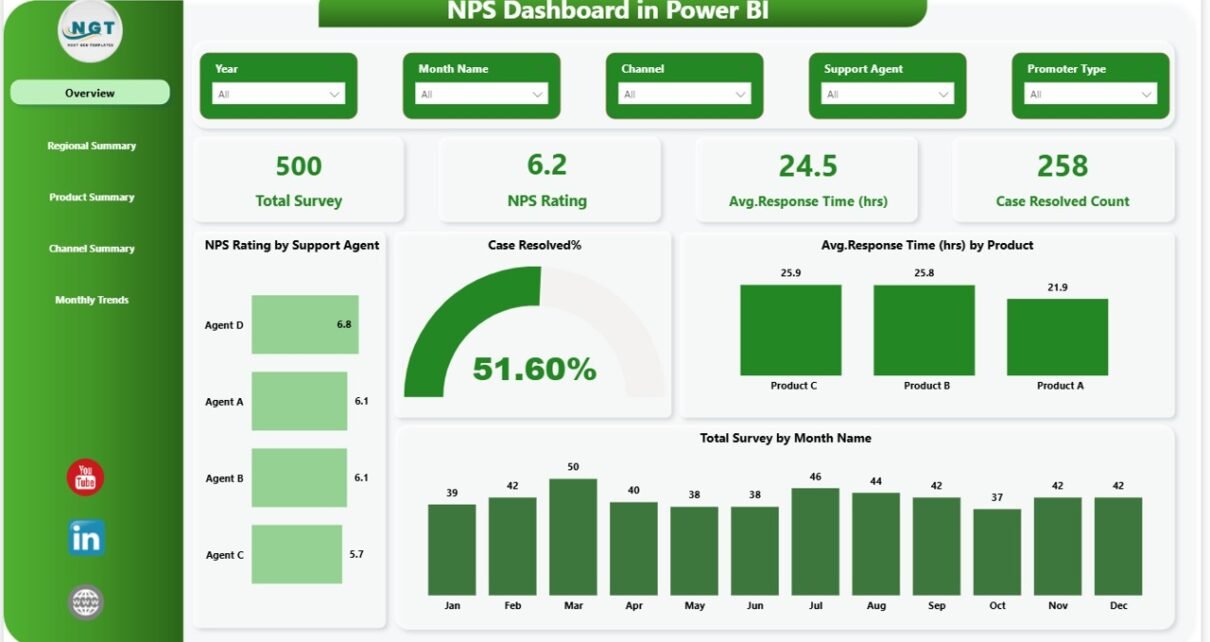
NPS Dashboard in Power BI

February 12, 2026February 12, 2026 PKComments Off on NPS Dashboard in Power BI
Customer loyalty decides business growth. However, many organizations still track customer feedback in scattered spreadsheets. As a result, leaders struggle to measure satisfaction, response time, and resolution rates clearly.So, how
Read More
Dashboard Power BI

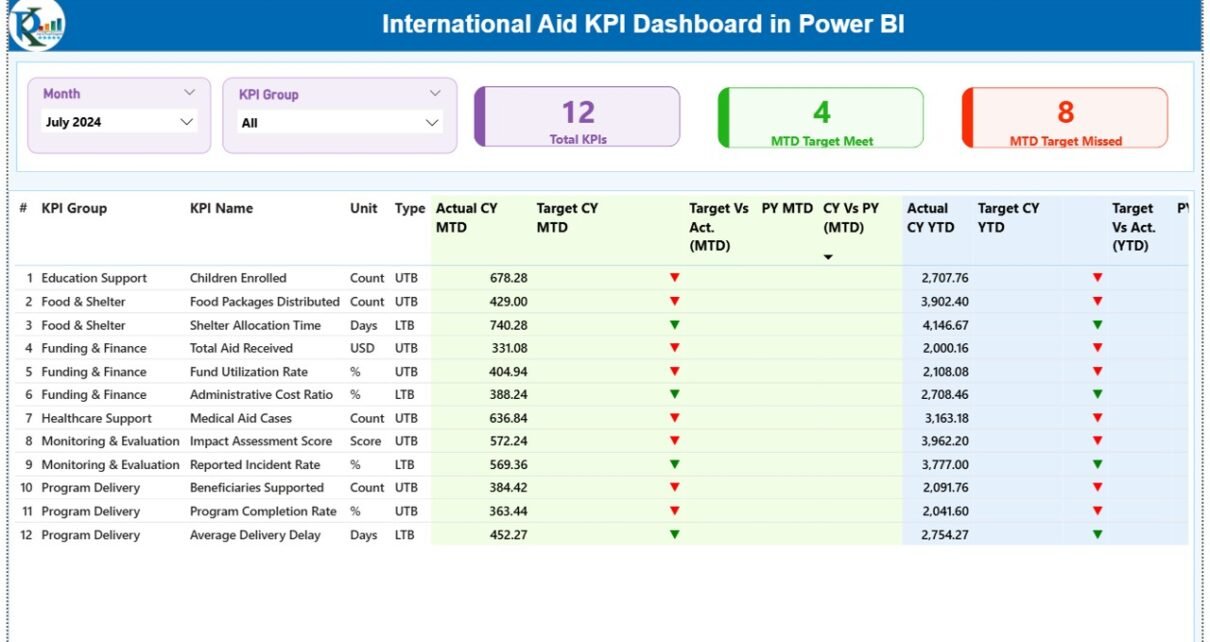
International Aid KPI Dashboard in Power BI

February 12, 2026February 12, 2026 PKComments Off on International Aid KPI Dashboard in Power BI
International aid organizations manage millions of dollars, thousands of beneficiaries, and multiple programs across regions. However, many teams still rely on scattered spreadsheets and manual reports. As a result, leaders
Read More
Dashboard Power BI

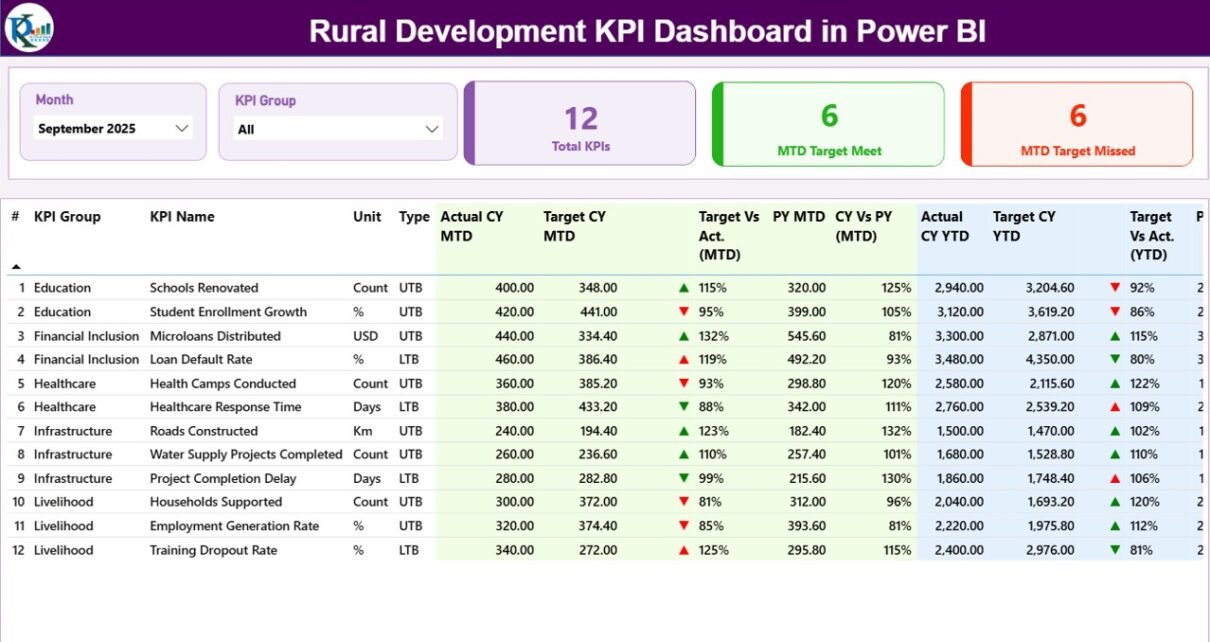
Rural Development KPI Dashboard in Power BI

February 12, 2026February 12, 2026 PKComments Off on Rural Development KPI Dashboard in Power BI
Rural development drives economic stability, social growth, and long-term sustainability. However, many government bodies and NGOs still track rural programs using scattered spreadsheets. As a result, decision-makers struggle to measure
Read More
Dashboard Power BI

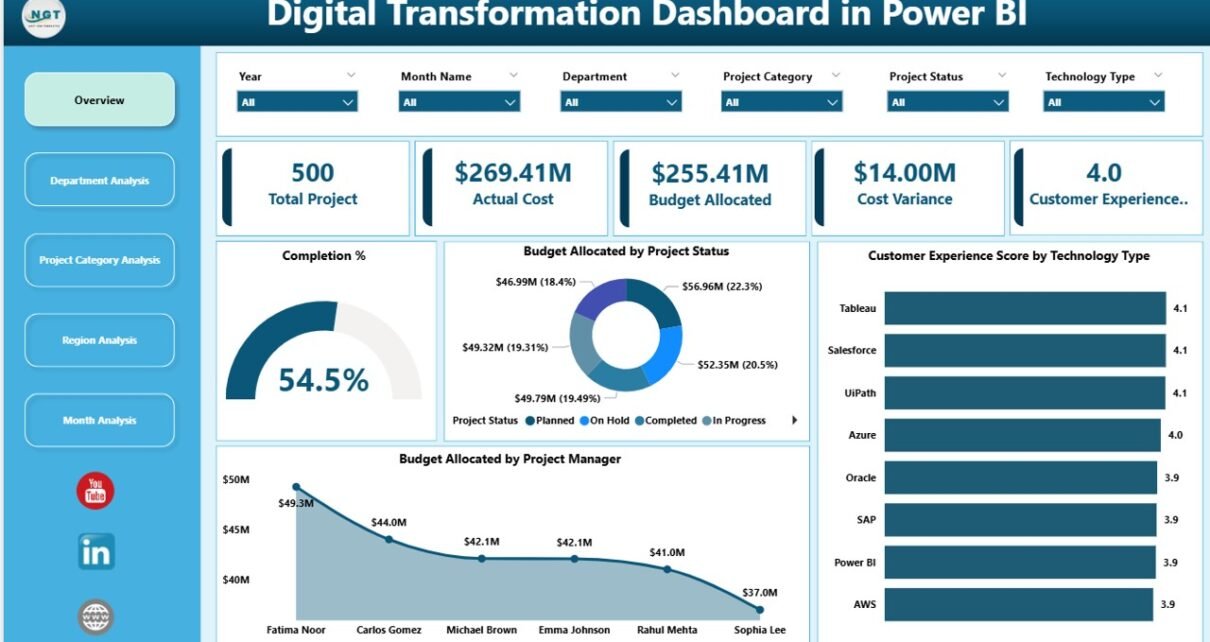
Digital Transformation Dashboard in Power BI

February 11, 2026February 11, 2026 PKComments Off on Digital Transformation Dashboard in Power BI
Digital transformation is no longer optional. Organizations compete in a fast-moving world. Customers expect speed. Teams demand automation. Leaders need visibility. However, many companies still track digital projects using scattered
Read More
Dashboard Power BI

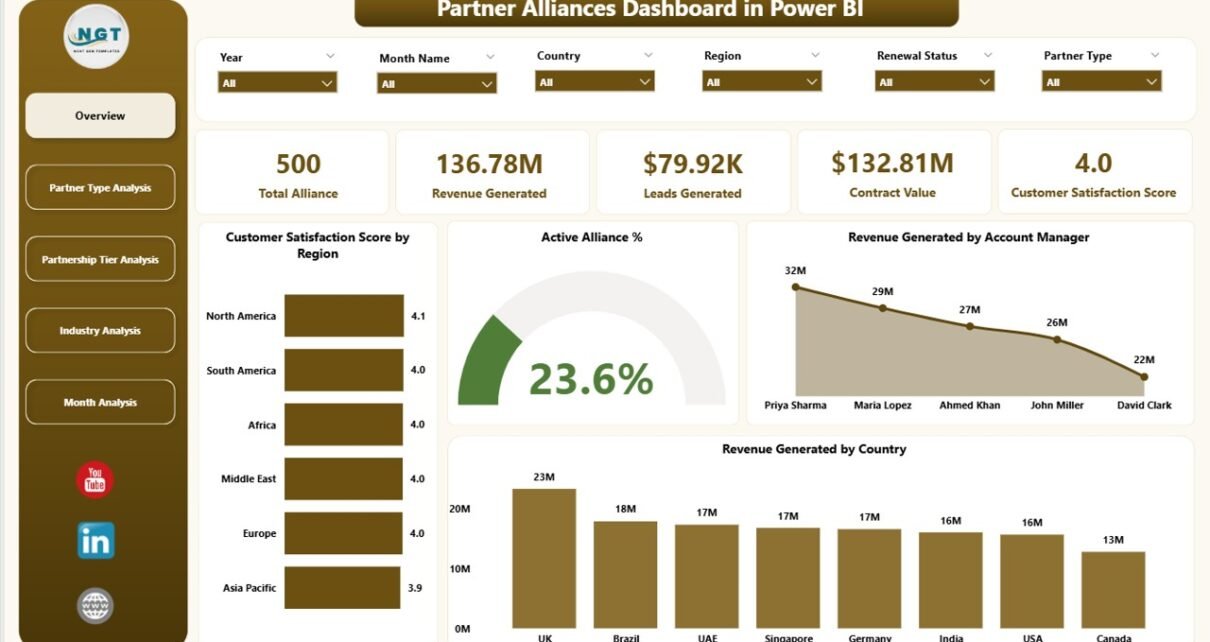
Partner Alliances Dashboard in Power BI

February 11, 2026February 11, 2026 PKComments Off on Partner Alliances Dashboard in Power BI
Strategic partnerships drive growth. However, without clear tracking, alliances lose direction. Many organizations struggle to monitor partner performance, revenue contribution, lead generation, and satisfaction levels in one place. As a
Read More
Dashboard Power BI

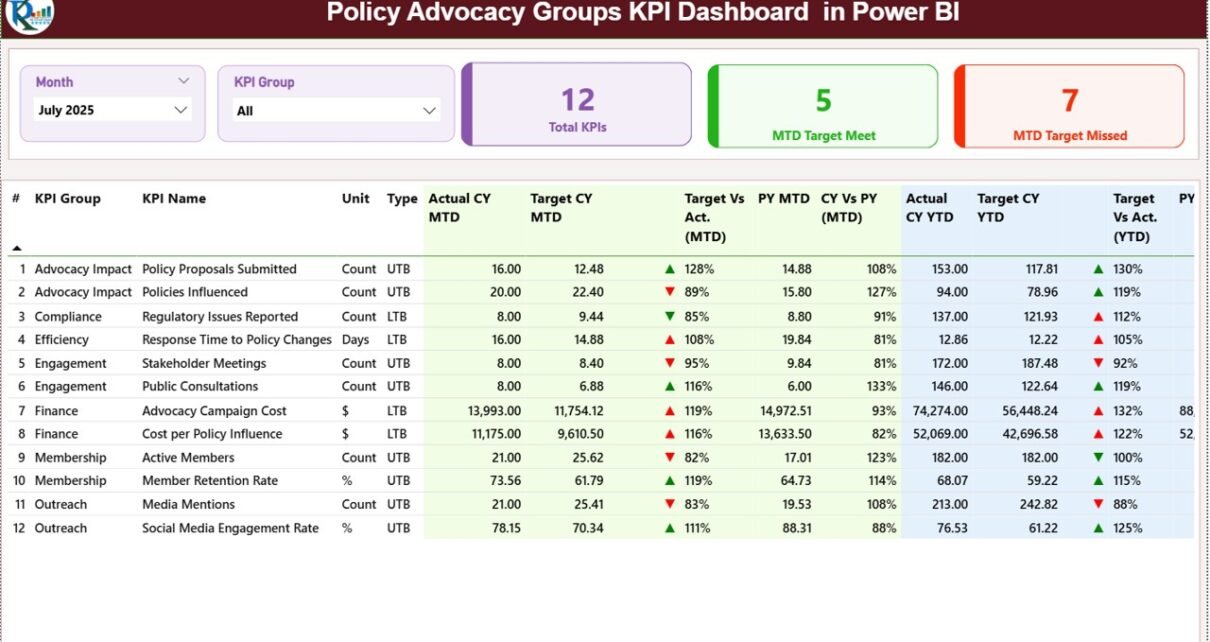
Policy Advocacy Groups KPI Dashboard in Power BI

February 11, 2026February 11, 2026 PKComments Off on Policy Advocacy Groups KPI Dashboard in Power BI
Policy advocacy groups work to create change. They run campaigns, influence decision-makers, mobilize communities, and track outcomes. However, many organizations still rely on manual Excel summaries or scattered reports. As
Read More
Dashboard Power BI

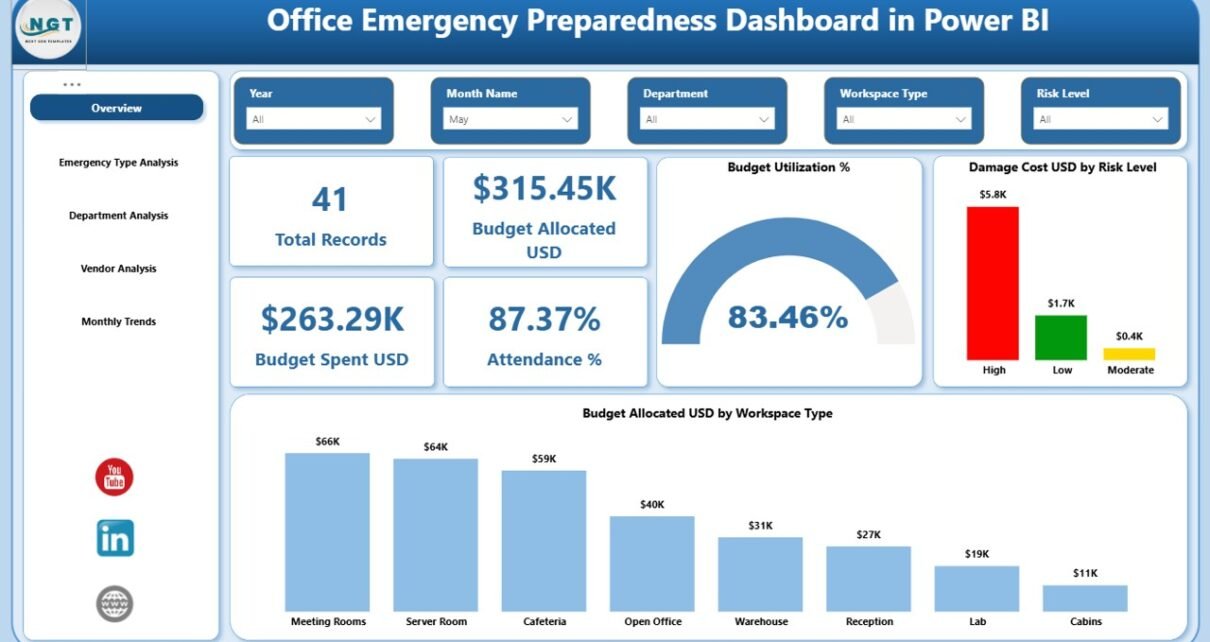
Office Emergency Preparedness Dashboard in Power BI

February 11, 2026February 11, 2026 PKComments Off on Office Emergency Preparedness Dashboard in Power BI
Emergencies do not send invitations. They arrive without warning. Therefore, every organization must prepare in advance. However, many offices still track emergency drills, budgets, and risk levels in scattered Excel
Read More
Dashboard Power BI

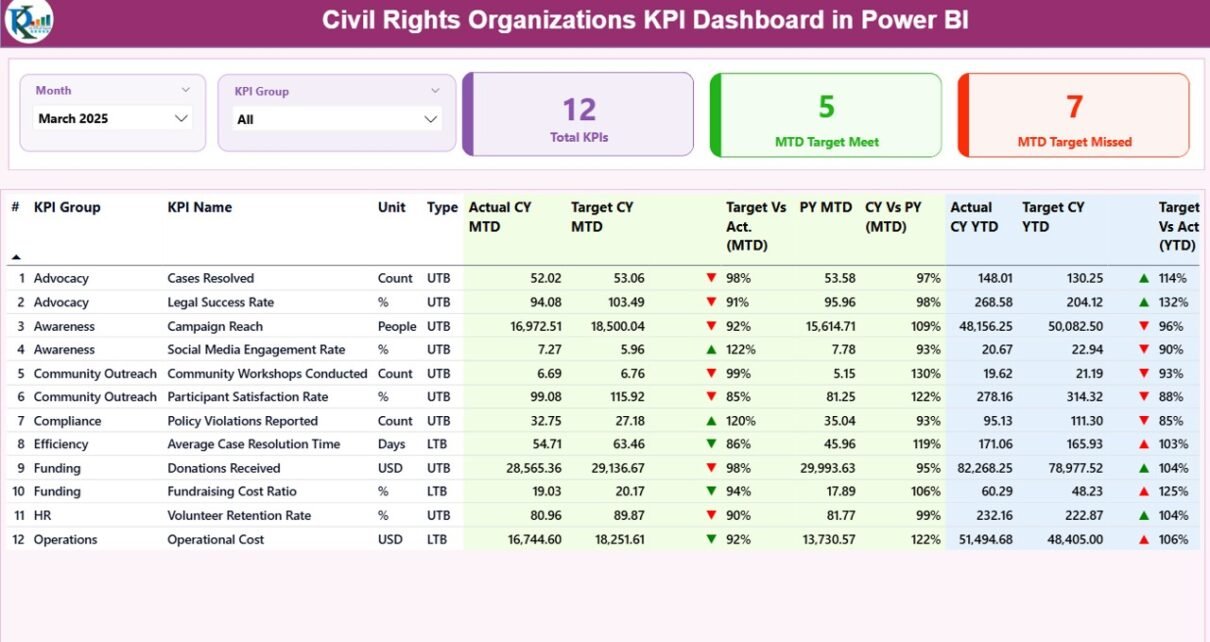
Civil Rights Organizations KPI Dashboard in Power BI

February 11, 2026February 11, 2026 PKComments Off on Civil Rights Organizations KPI Dashboard in Power BI
Civil rights organizations fight for justice, equality, and human dignity every single day. However, passion alone does not create measurable impact. Data creates impact. Clear reporting builds trust. Strong monitoring
Read More
Dashboard Power BI

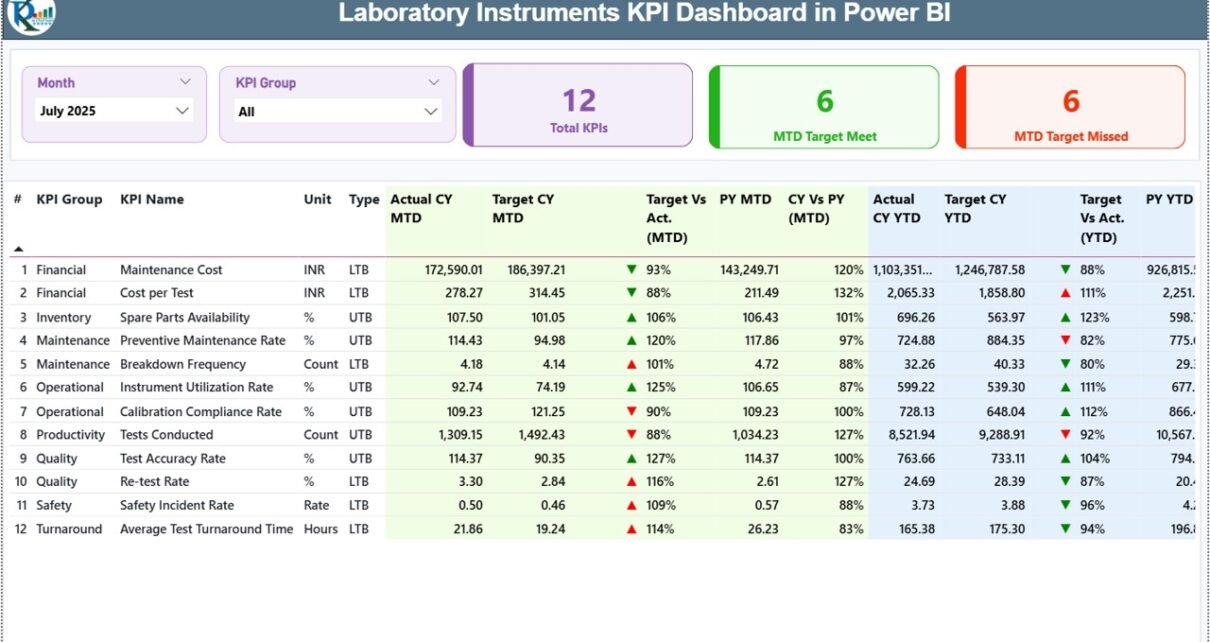
Laboratory Instruments KPI Dashboard in Power BI

February 11, 2026February 11, 2026 PKComments Off on Laboratory Instruments KPI Dashboard in Power BI
Laboratories depend on precision, speed, and compliance. However, many labs still track instrument performance manually. As a result, teams spend hours compiling reports. Moreover, managers struggle to monitor downtime, utilization
Read More
Dashboard Power BI

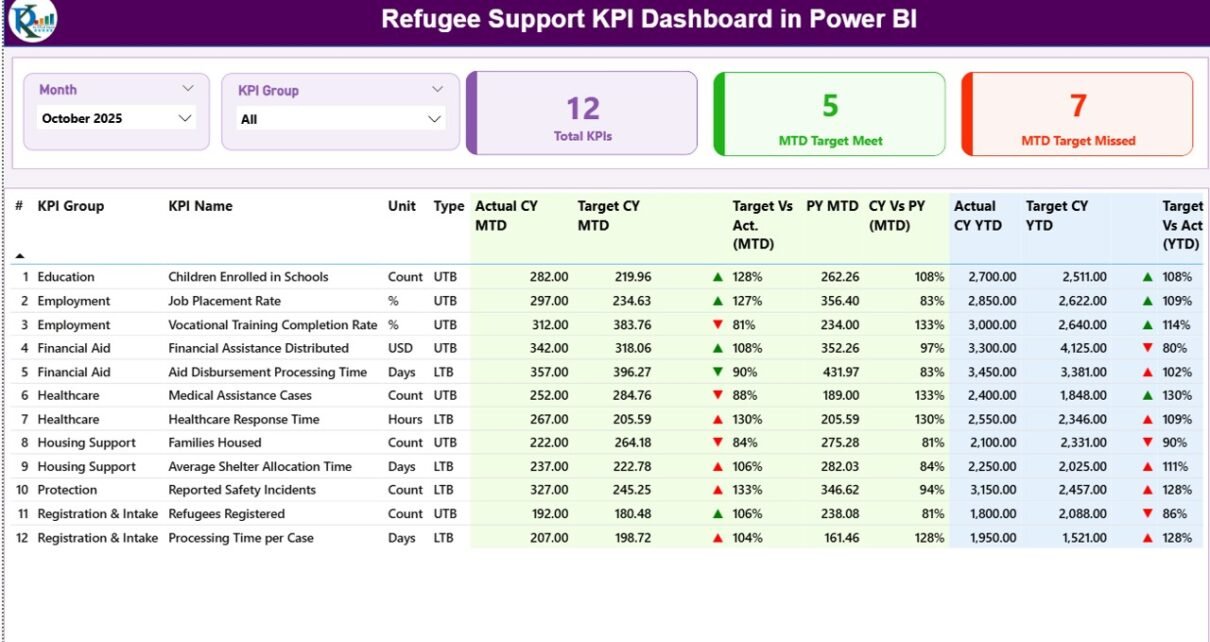
Refugee Support KPI Dashboard in Power BI

February 11, 2026February 11, 2026 PKComments Off on Refugee Support KPI Dashboard in Power BI
Humanitarian work demands clarity. Teams must track shelter support, food distribution, healthcare coverage, education access, and employment programs. However, when teams use scattered spreadsheets, they lose visibility. As a result,
Read More

Posts pagination

Previous 1 … 29 30 31 … 85 Next
  • Learn Excel (Free Course)
    • 1. Shortcut Keys
    • 2. Fill & Flash Fill
    • 3. Find & Replace
    • 4. Sort & Filter
    • 5. Formulas & Functions
    • 6. Data Validation
    • 7. Conditional Formatting
    • 8. Basic Charts
    • 9. Advanced Charts
    • 10. Pivot Tables
    • 11. Excel Dashboards
    • 12. VBA Course
    • 13. Excel Formulas with AI
  • Templates
  • Tutorials
    • Charts and Visualization
    • VBA
    • Excel Tips and Tricks
    • Excel Dashboards
    • Power Pivot & DAX
  • Power BI
  • Template Store
    • Ready to Use Templates
  • Courses
  • Academy
    • Excel + AI Mastery: 100 Formulas
    • Excel Pivot Tables & Dashboards
  • About Us
  • Contact Us
Copyright © 2023 PK-AnExcelExpert.com - Privacy Policy