New: NextGenTemplates Academy - video courses on Excel formulas with AI and Pivot Tables & dashboards. Early-bird: 20% off with code EARLYBIRD20 - first 20 orders only. See the courses →
  • Learn Excel (Free Course)
    • 1. Shortcut Keys
    • 2. Fill & Flash Fill
    • 3. Find & Replace
    • 4. Sort & Filter
    • 5. Formulas & Functions
    • 6. Data Validation
    • 7. Conditional Formatting
    • 8. Basic Charts
    • 9. Advanced Charts
    • 10. Pivot Tables
    • 11. Excel Dashboards
    • 12. VBA Course
    • 13. Excel Formulas with AI
  • Templates
  • Tutorials
    • Charts and Visualization
    • VBA
    • Excel Tips and Tricks
    • Excel Dashboards
    • Power Pivot & DAX
  • Power BI
  • Template Store
    • Ready to Use Templates
  • Courses
  • Academy
    • Excel + AI Mastery: 100 Formulas
    • Excel Pivot Tables & Dashboards
  • About Us
  • Contact Us

PK: An Excel Expert

Transforming Data into Decisions
Tag: Power BI dashboard

Dashboard Power BI

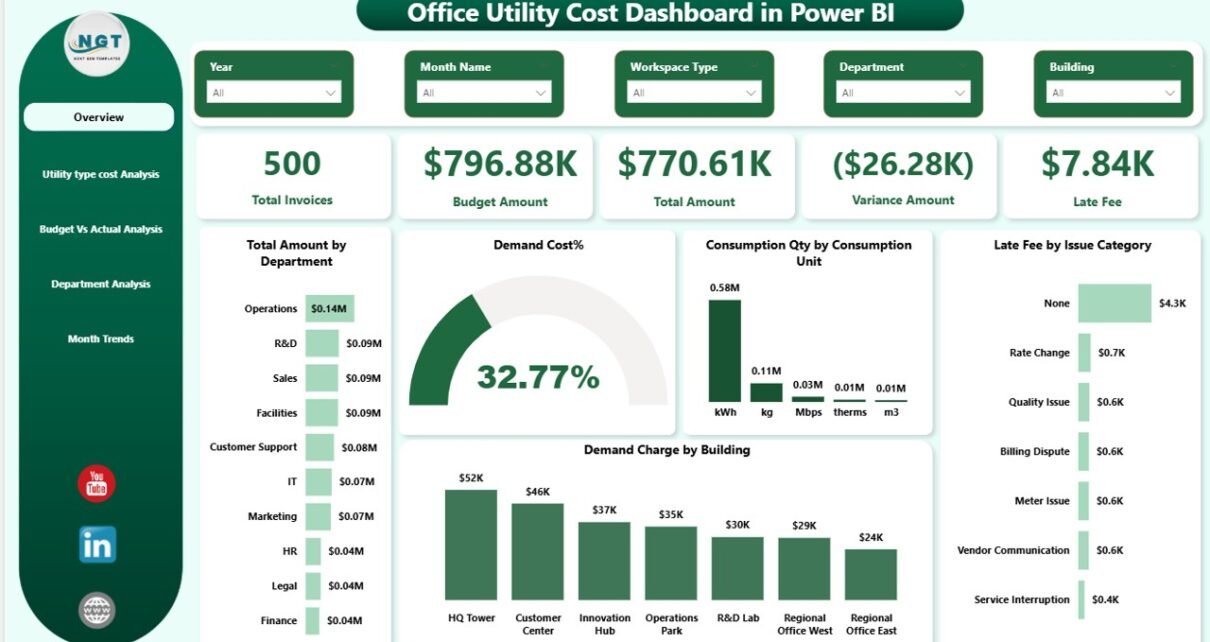
Office Utility Cost Dashboard in Power BI

February 10, 2026February 10, 2026 PKComments Off on Office Utility Cost Dashboard in Power BI
Managing office utility costs has become more important than ever. Energy prices continue to rise. Water tariffs keep changing. Demand charges increase without warning. As a result, businesses struggle to
Read More
Dashboard Power BI

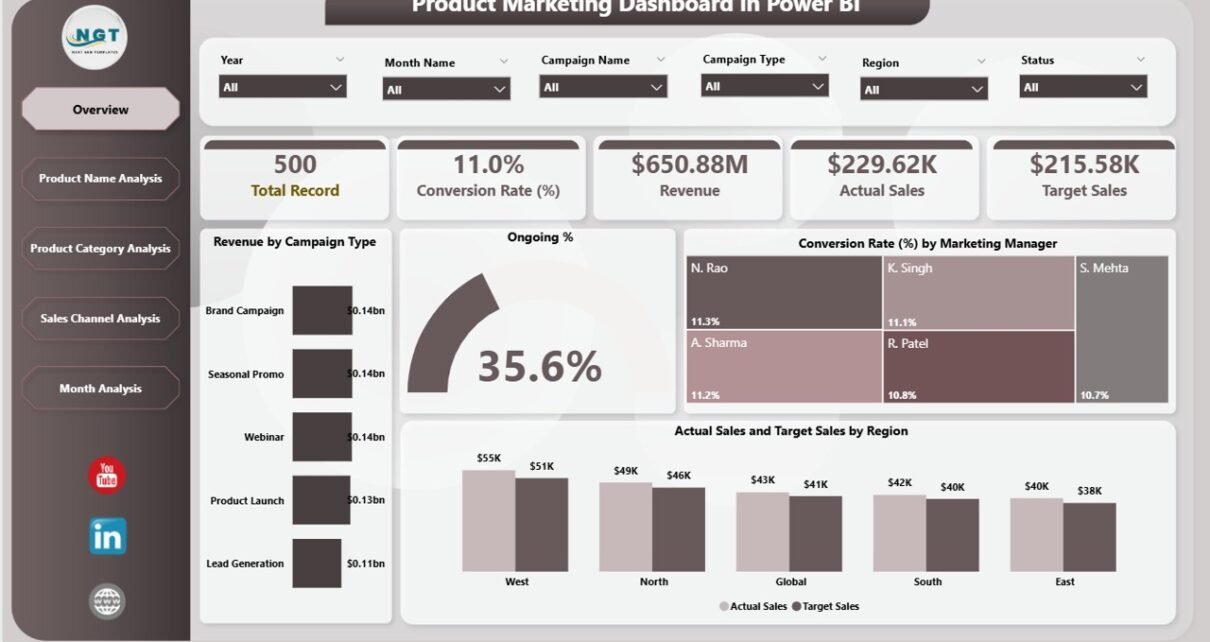
Product Marketing Dashboard in Power BI

February 10, 2026February 10, 2026 PKComments Off on Product Marketing Dashboard in Power BI
Marketing today moves fast. Campaigns launch every week. Products compete for attention. Teams spend budgets across channels. However, without clear data, even the best marketing strategy can fail. So, how
Read More
Dashboard Power BI

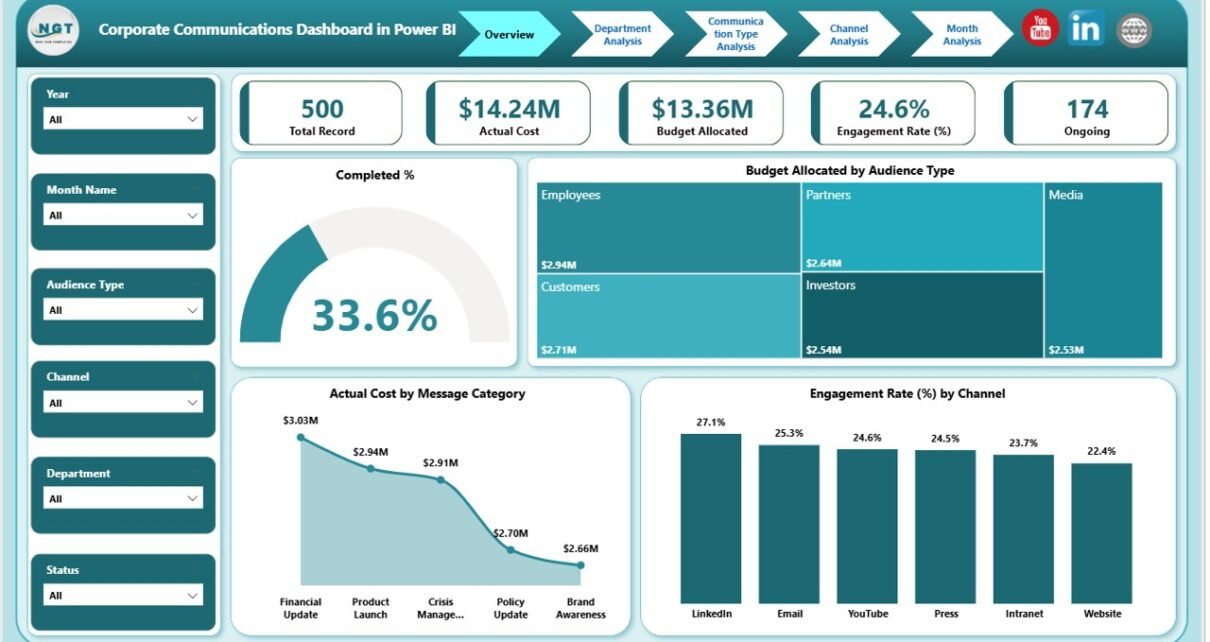
Corporate Communications Dashboard in Power BI

February 10, 2026February 10, 2026 PKComments Off on Corporate Communications Dashboard in Power BI
In today’s fast-moving business environment, companies must manage internal and external communication with clarity and control. However, many teams still rely on scattered Excel sheets and manual reports. As a
Read More
Dashboard Power BI

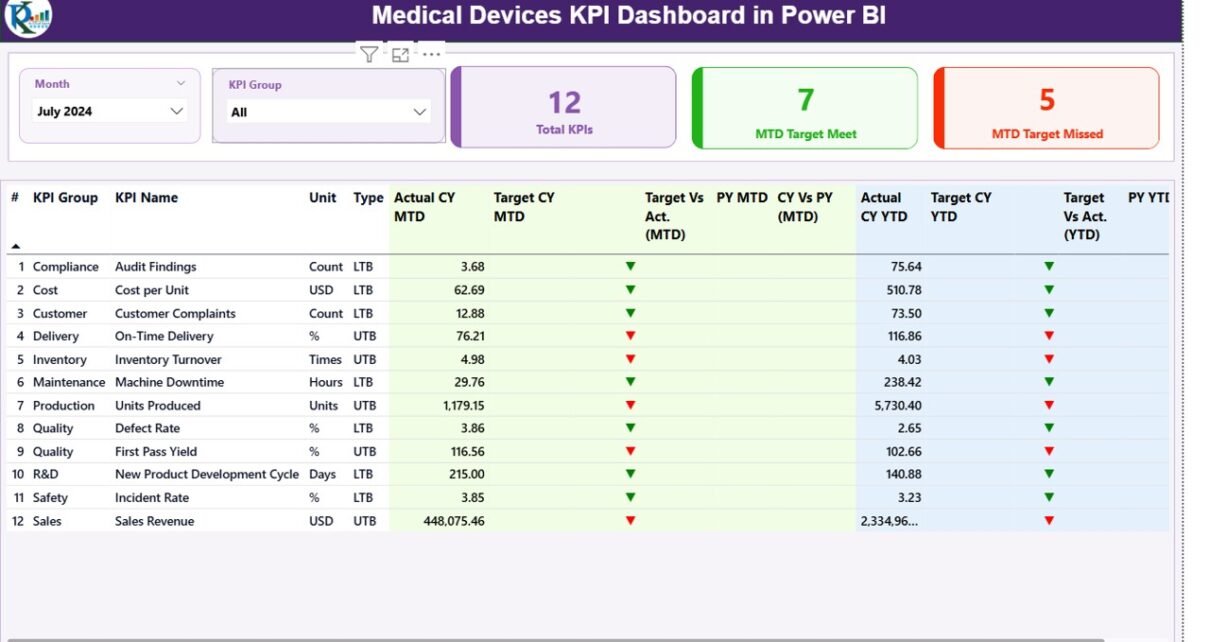
Medical Devices KPI Dashboard in Power BI

February 10, 2026February 10, 2026 PKComments Off on Medical Devices KPI Dashboard in Power BI
The medical devices industry demands precision, compliance, and consistent performance. Every month, teams monitor production output, defect rates, regulatory metrics, sales growth, and service performance. However, many organizations still rely
Read More
Dashboard Power BI

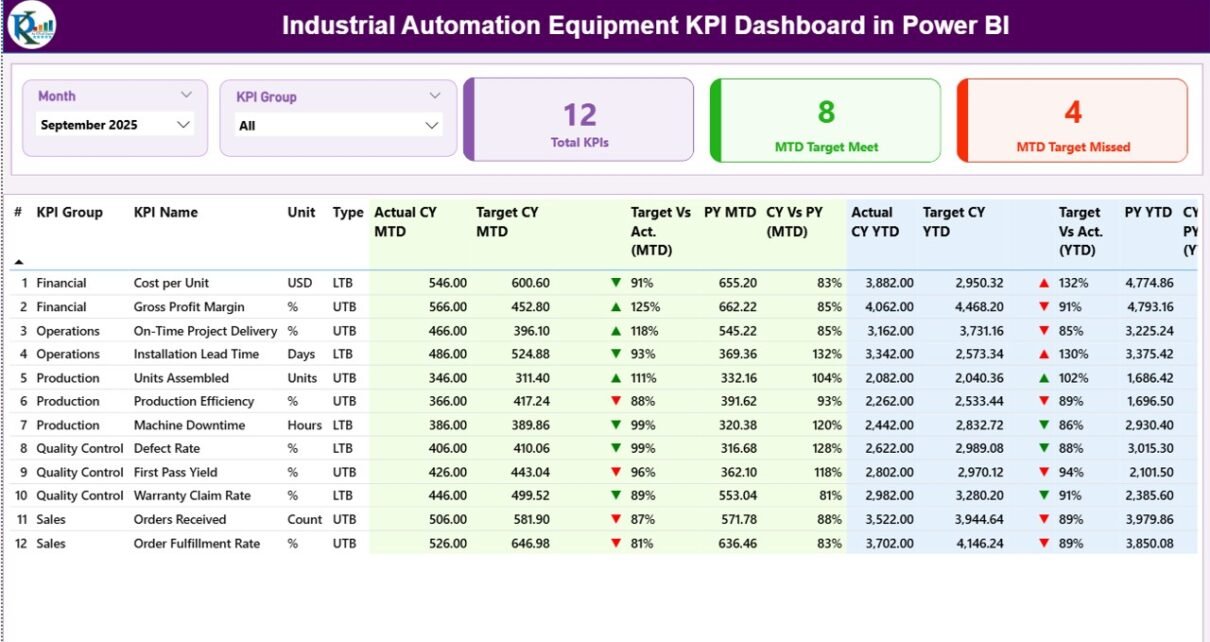
Industrial Automation Equipment KPI Dashboard in Power BI

February 10, 2026February 10, 2026 PKComments Off on Industrial Automation Equipment KPI Dashboard in Power BI
Industrial automation drives modern manufacturing. However, without proper performance tracking, even advanced machines fail to deliver full value. Companies invest heavily in PLC systems, robotics, SCADA, sensors, and automated production
Read More
Dashboard Power BI

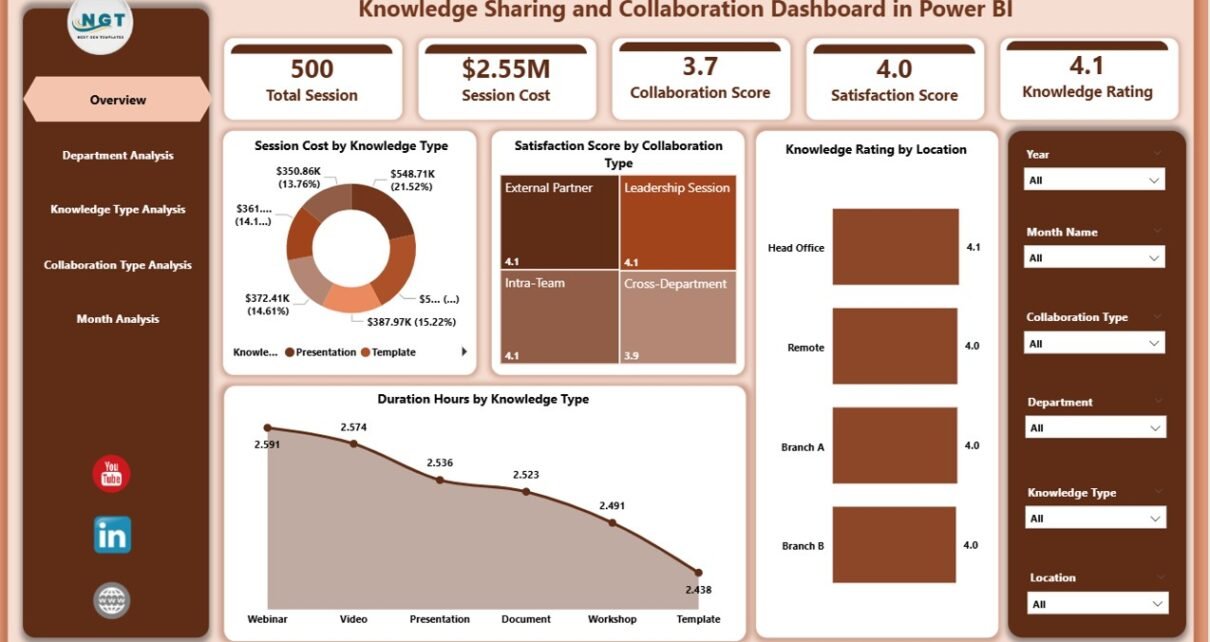
Knowledge Sharing and Collaboration Dashboard in Power BI

February 9, 2026February 9, 2026 PKComments Off on Knowledge Sharing and Collaboration Dashboard in Power BI
In today’s fast-moving Knowledge Sharing and Collaboration Dashboard, companies must share knowledge quickly. Teams work across departments. Employees join from different locations. Moreover, organizations rely on collaboration to drive innovation.
Read More
Dashboard Power BI

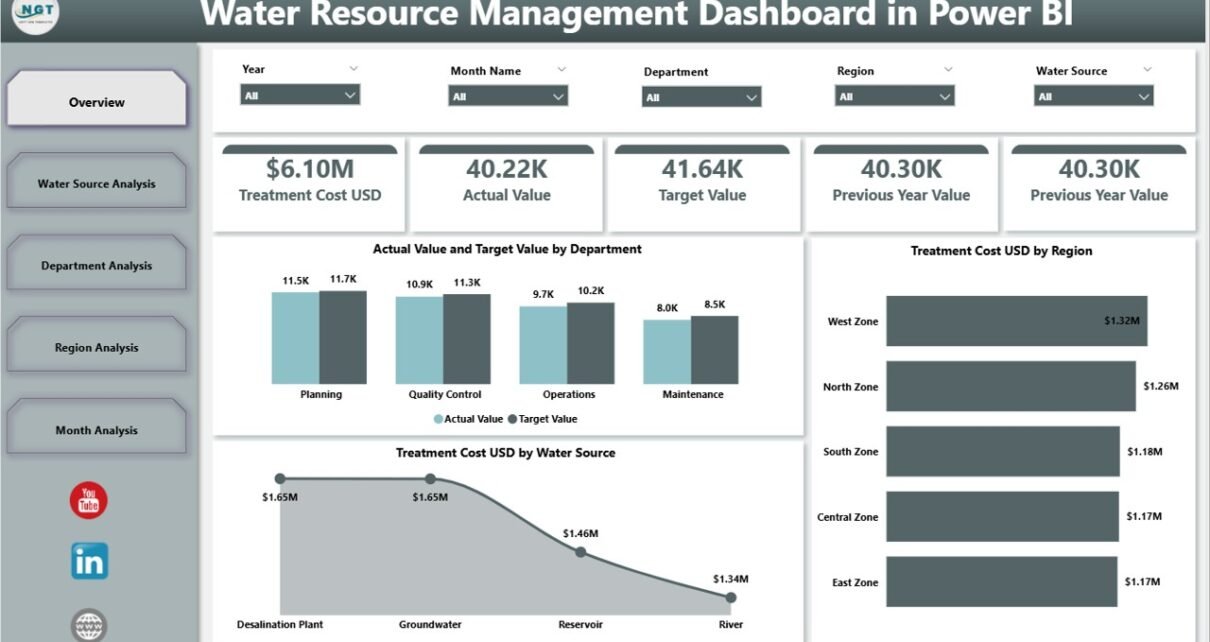
Water Resource Management Dashboard in Power BI

February 9, 2026February 9, 2026 PKComments Off on Water Resource Management Dashboard in Power BI
Water is life. However, managing water resources has become more complex than ever. Cities grow fast. Industries consume more water. Climate change affects rainfall patterns. Therefore, water authorities must track
Read More
Dashboard Power BI

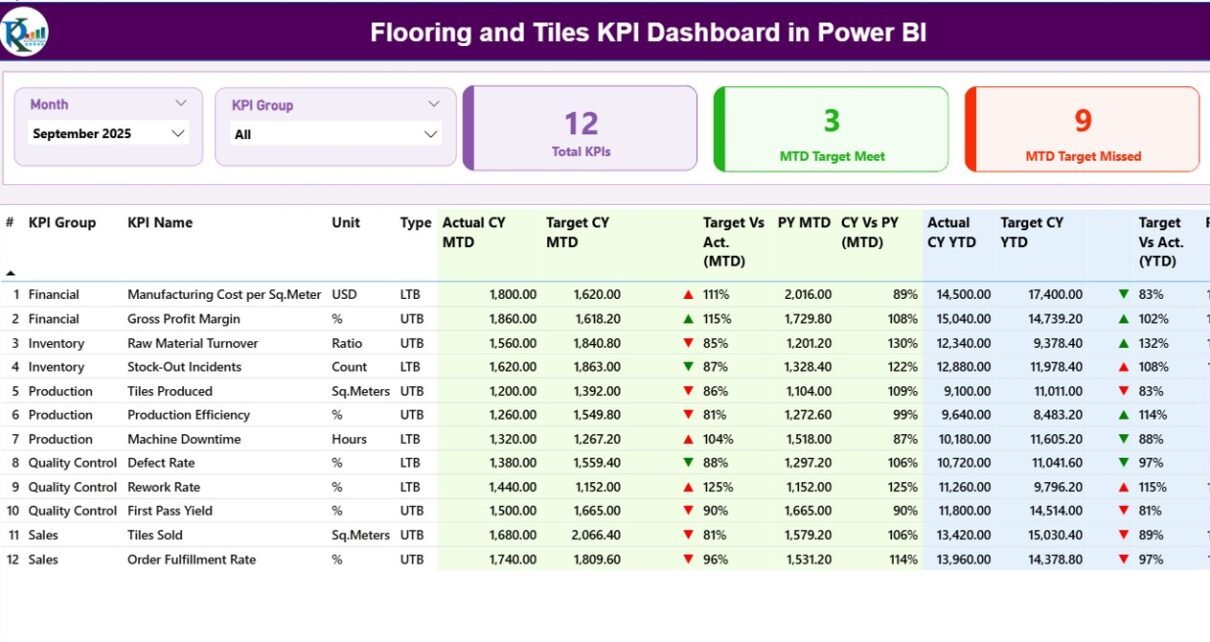
Flooring and Tiles KPI Dashboard in Power BI

February 9, 2026February 9, 2026 PKComments Off on Flooring and Tiles KPI Dashboard in Power BI
The Flooring and Tiles KPI Dashboard changes fast. Customer taste shifts quickly. Moreover, builders demand faster delivery. At the same time, raw material costs move up and down. Therefore, flooring
Read More
Dashboard Power BI

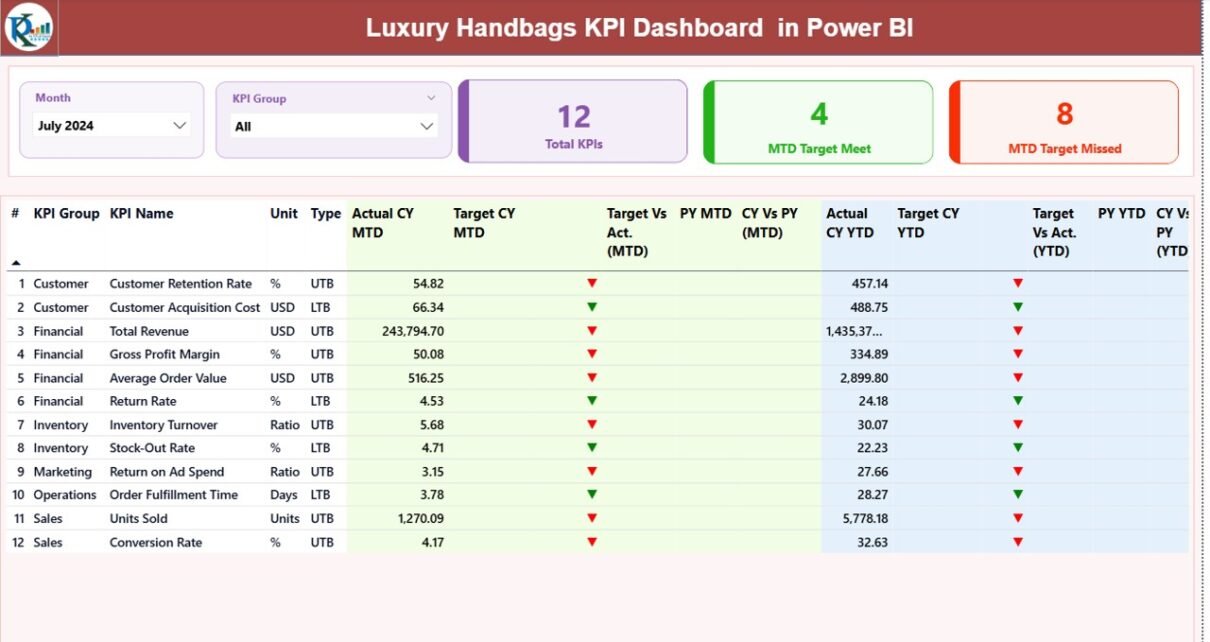
Luxury Handbags KPI Dashboard in Power BI

February 9, 2026February 9, 2026 PKComments Off on Luxury Handbags KPI Dashboard in Power BI
The luxury handbag industry moves fast. Trends change quickly. Customer taste shifts with seasons. Moreover, global fashion weeks, celebrity endorsements, and festive campaigns directly impact sales. Therefore, luxury handbag brands
Read More
Dashboard Power BI

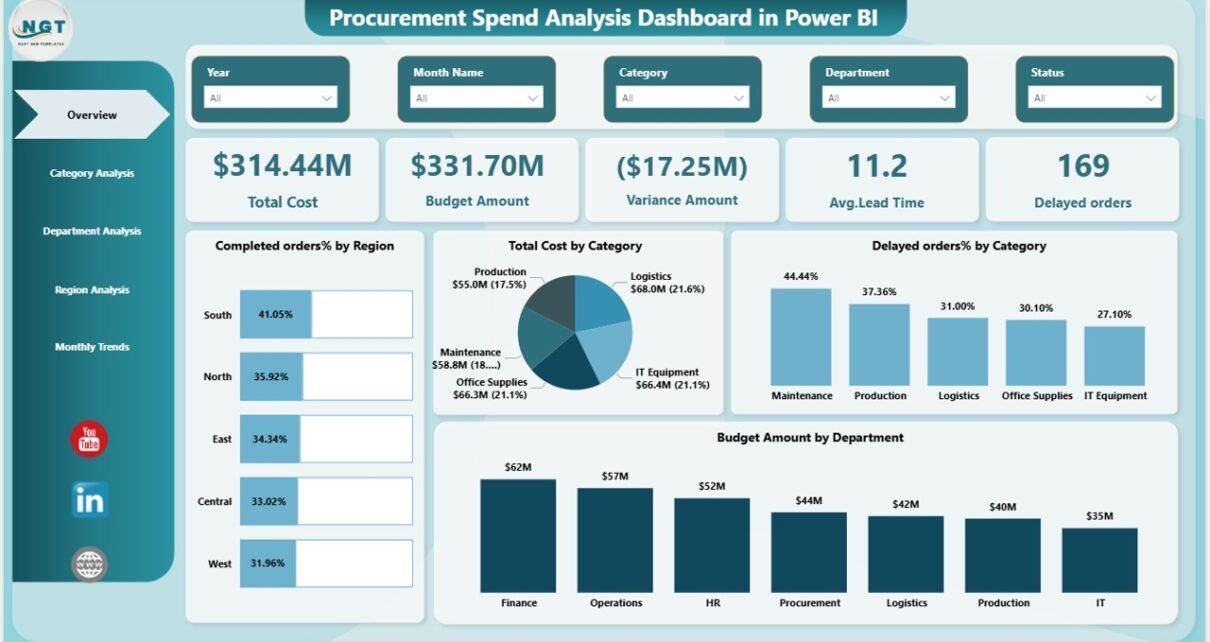
Procurement Spend Analysis Dashboard in Power BI

February 8, 2026February 8, 2026 PKComments Off on Procurement Spend Analysis Dashboard in Power BI
In today’s competitive market, companies must control every rupee they spend. However, procurement teams often struggle to track supplier costs, monitor budgets, and manage order delays. As a result, businesses
Read More

Posts pagination

Previous 1 … 30 31 32 … 85 Next
  • Learn Excel (Free Course)
    • 1. Shortcut Keys
    • 2. Fill & Flash Fill
    • 3. Find & Replace
    • 4. Sort & Filter
    • 5. Formulas & Functions
    • 6. Data Validation
    • 7. Conditional Formatting
    • 8. Basic Charts
    • 9. Advanced Charts
    • 10. Pivot Tables
    • 11. Excel Dashboards
    • 12. VBA Course
    • 13. Excel Formulas with AI
  • Templates
  • Tutorials
    • Charts and Visualization
    • VBA
    • Excel Tips and Tricks
    • Excel Dashboards
    • Power Pivot & DAX
  • Power BI
  • Template Store
    • Ready to Use Templates
  • Courses
  • Academy
    • Excel + AI Mastery: 100 Formulas
    • Excel Pivot Tables & Dashboards
  • About Us
  • Contact Us
Copyright © 2023 PK-AnExcelExpert.com - Privacy Policy