New: NextGenTemplates Academy - video courses on Excel formulas with AI and Pivot Tables & dashboards. Early-bird: 20% off with code EARLYBIRD20 - first 20 orders only. See the courses →
  • Learn Excel (Free Course)
    • 1. Shortcut Keys
    • 2. Fill & Flash Fill
    • 3. Find & Replace
    • 4. Sort & Filter
    • 5. Formulas & Functions
    • 6. Data Validation
    • 7. Conditional Formatting
    • 8. Basic Charts
    • 9. Advanced Charts
    • 10. Pivot Tables
    • 11. Excel Dashboards
    • 12. VBA Course
    • 13. Excel Formulas with AI
  • Templates
  • Tutorials
    • Charts and Visualization
    • VBA
    • Excel Tips and Tricks
    • Excel Dashboards
    • Power Pivot & DAX
  • Power BI
  • Template Store
    • Ready to Use Templates
  • Courses
  • Academy
    • Excel + AI Mastery: 100 Formulas
    • Excel Pivot Tables & Dashboards
  • About Us
  • Contact Us

PK: An Excel Expert

Transforming Data into Decisions

Tag: Power BI dashboard

Dashboard Power BI

Call Center Operations Dashboard in Power BI

January 18, 2026January 18, 2026 PKComments Off on Call Center Operations Dashboard in Power BI
Managing a call center demands speed, accuracy, and clear visibility into daily operations. However, raw call logs and scattered reports often slow down decision-making. Therefore, businesses increasingly rely on a
Read More
Dashboard Power BI

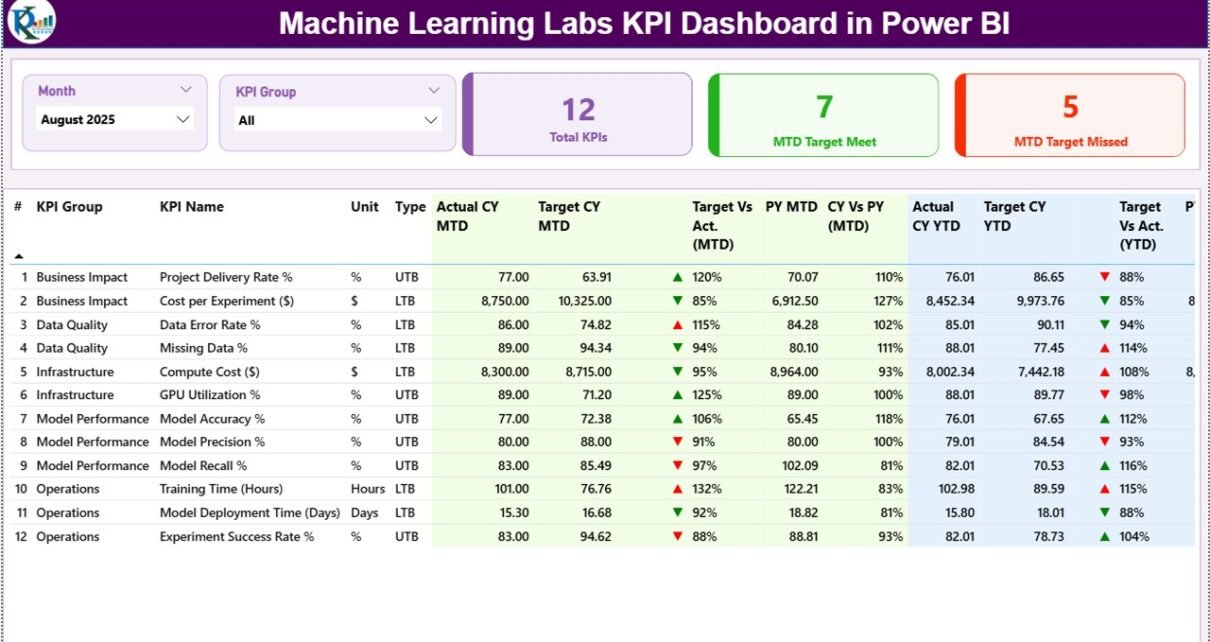
Machine Learning Labs KPI Dashboard in Power BI

January 18, 2026January 18, 2026 PKComments Off on Machine Learning Labs KPI Dashboard in Power BI
Running a machine learning lab requires constant tracking of experiments, models, data quality, costs, timelines, and outcomes. However, when teams store this information in scattered Excel files or disconnected tools,
Read More
Dashboard Power BI

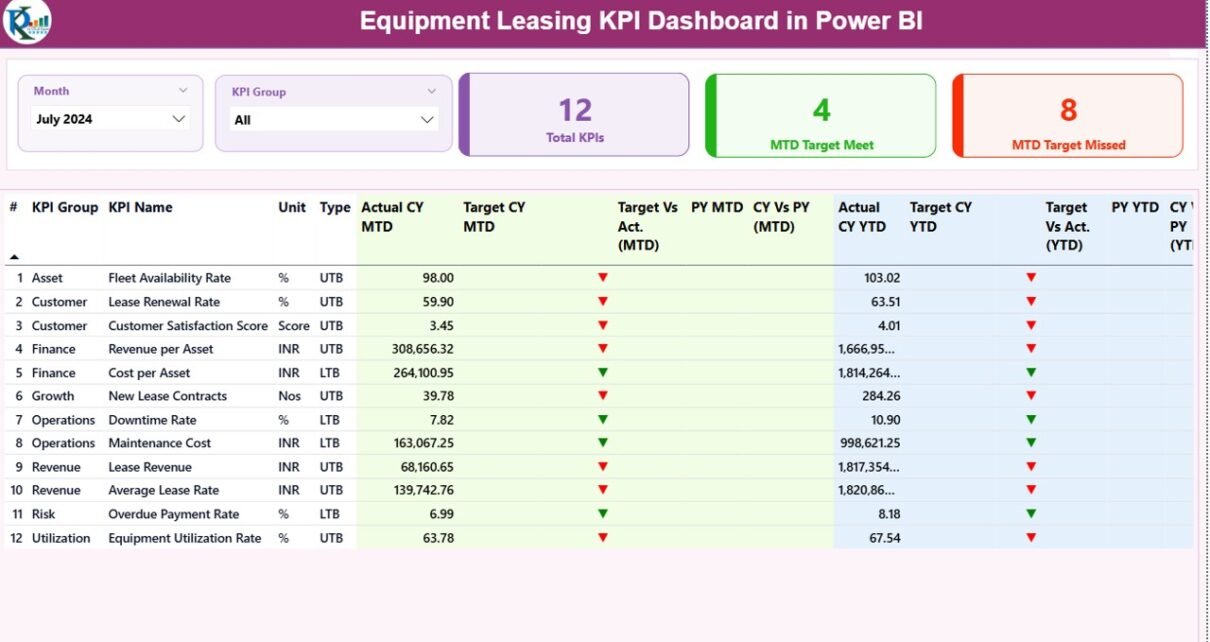
Equipment Leasing KPI Dashboard in Power BI

January 18, 2026January 18, 2026 PKComments Off on Equipment Leasing KPI Dashboard in Power BI
Managing an equipment leasing business requires constant tracking of performance, targets, costs, and utilization. However, raw data stored in spreadsheets rarely gives a clear picture. Therefore, companies increasingly rely on
Read More
Dashboard Power BI

Market Research Dashboard in Power BI

January 17, 2026January 17, 2026 PKComments Off on Market Research Dashboard in Power BI
Market research shapes every successful business strategy. Companies that clearly understand customer needs, satisfaction levels, pricing sensitivity, and response behavior always stay ahead of competitors. However, raw survey data stored
Read More
Dashboard Power BI

Heavy Machinery Dashboard in Power BI

January 17, 2026January 17, 2026 PKComments Off on Heavy Machinery Dashboard in Power BI
Heavy machinery plays a critical role in industries such as construction, mining, manufacturing, infrastructure, and energy. Excavators, cranes, loaders, bulldozers, and other machines operate for long hours and involve high
Read More
Dashboard Power BI

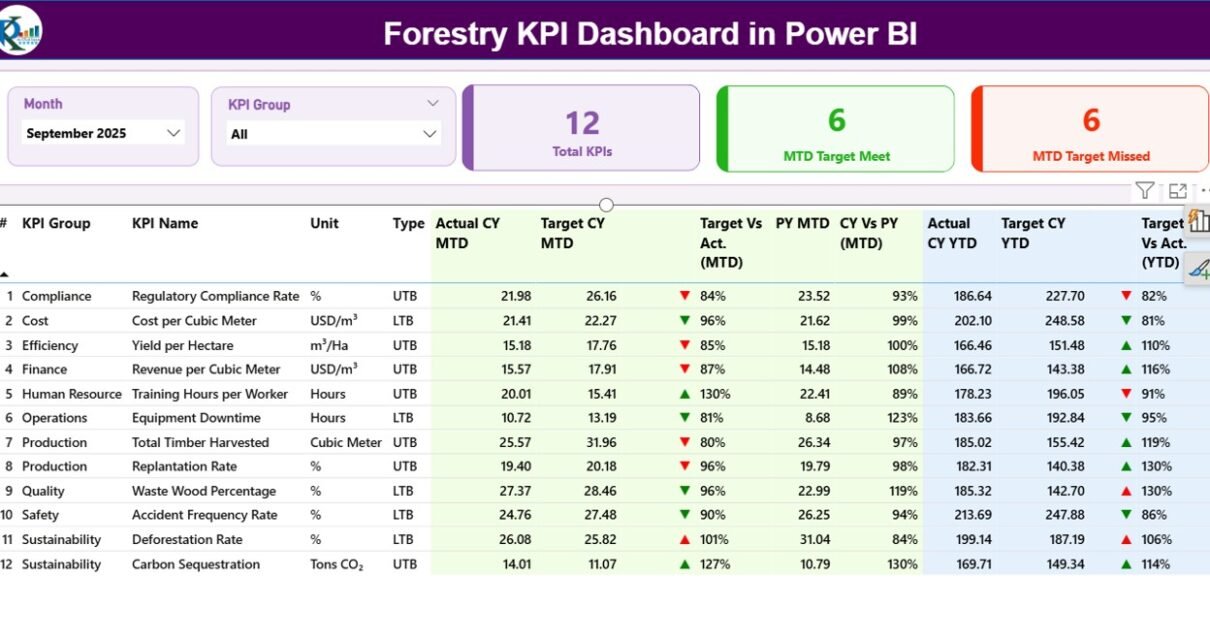
Forestry KPI Dashboard in Power BI

January 17, 2026October 10, 2026 PKComments Off on Forestry KPI Dashboard in Power BI
Forestry organizations operate in a complex environment. On one side, they manage natural resources responsibly. On the other side, they must meet productivity, sustainability, safety, and compliance goals. Therefore, forestry
Read More
Dashboard Power BI

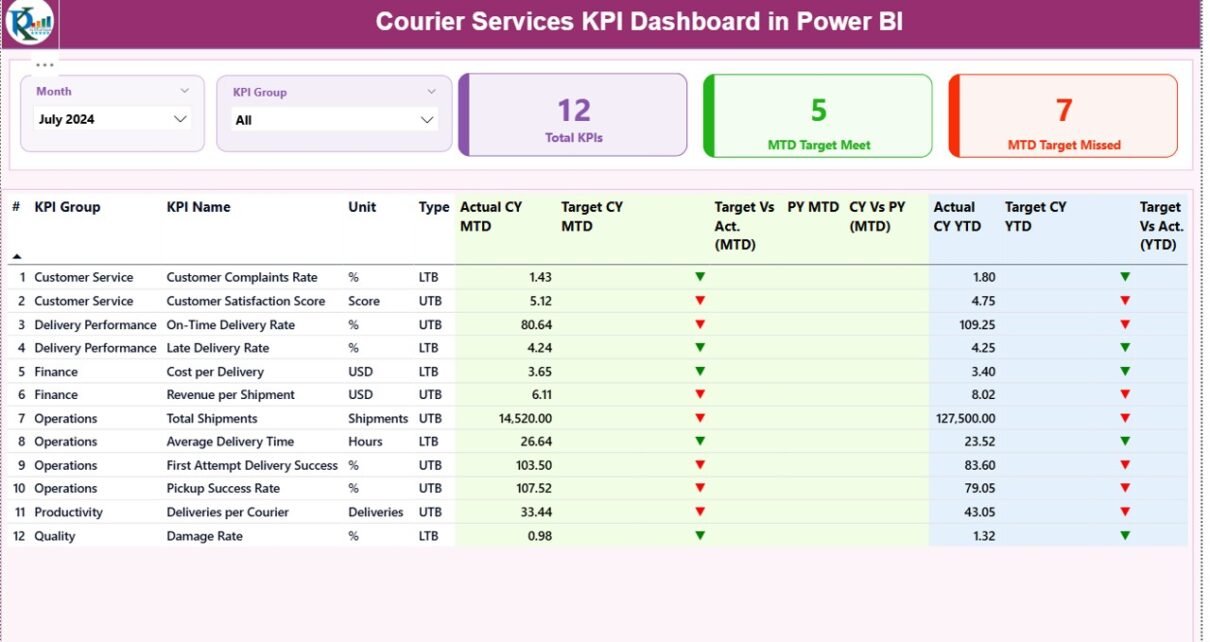
Courier Services KPI Dashboard in Power BI

January 17, 2026January 17, 2026 PKComments Off on Courier Services KPI Dashboard in Power BI
The courier and logistics industry moves fast. Every parcel, every delivery route, and every customer promise depends on speed, accuracy, and cost control. Therefore, courier companies must track performance continuously
Read More
Dashboard Power BI

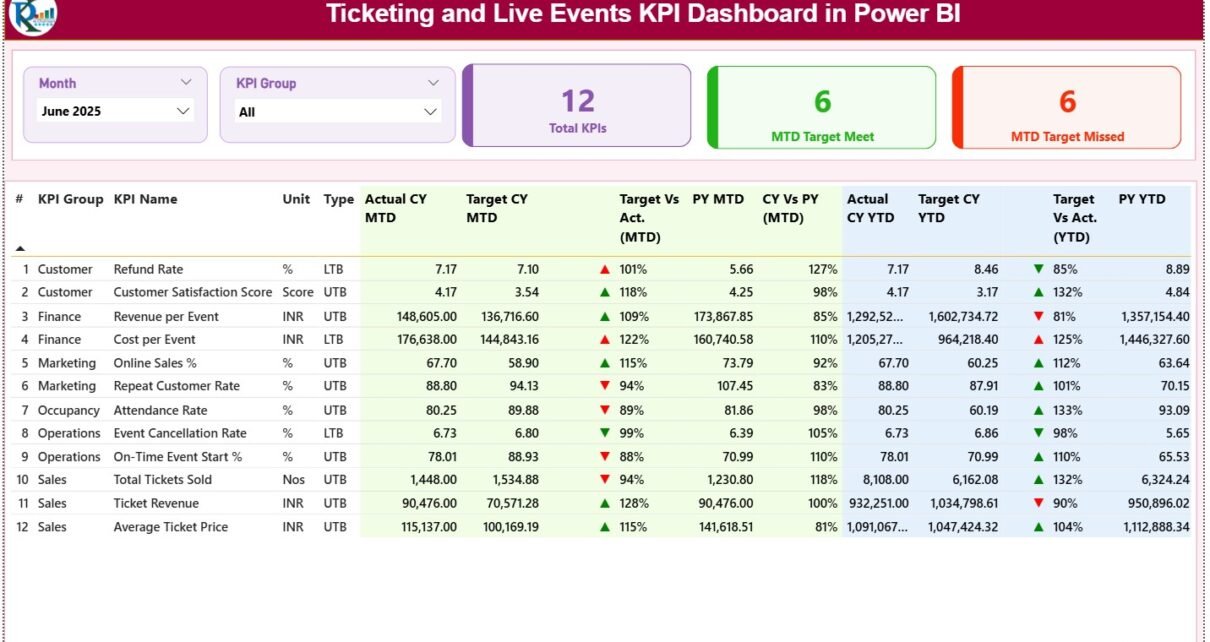
Ticketing and Live Events KPI Dashboard in Power BI

January 17, 2026January 17, 2026 PKComments Off on Ticketing and Live Events KPI Dashboard in Power BI
The ticketing and live events industry runs on timing, accuracy, and fast decisions. Concerts, sports events, exhibitions, and festivals generate huge volumes of data every month. Ticket sales, attendance, revenue,
Read More
Power Pivot

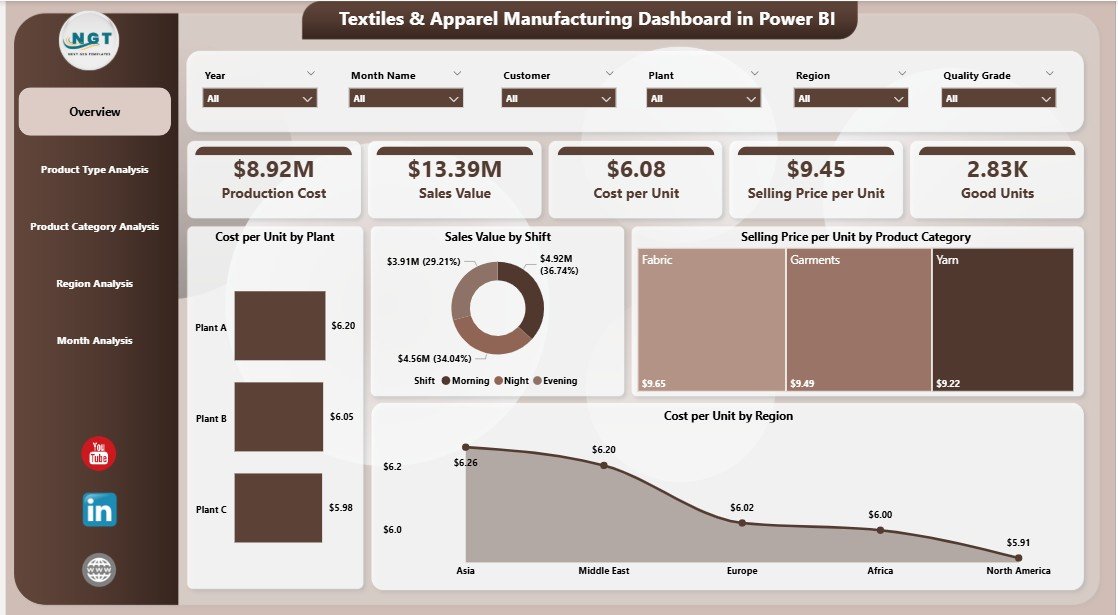
Textiles & Apparel Manufacturing Dashboard in Power BI

January 16, 2026January 16, 2026 PKComments Off on Textiles & Apparel Manufacturing Dashboard in Power BI
The textiles and apparel manufacturing industry operates in a fast-moving, cost-sensitive, and highly competitive environment. Every day, manufacturers track production volumes, unit costs, selling prices, regional demand, and monthly trends.
Read More
Dashboard Power BI

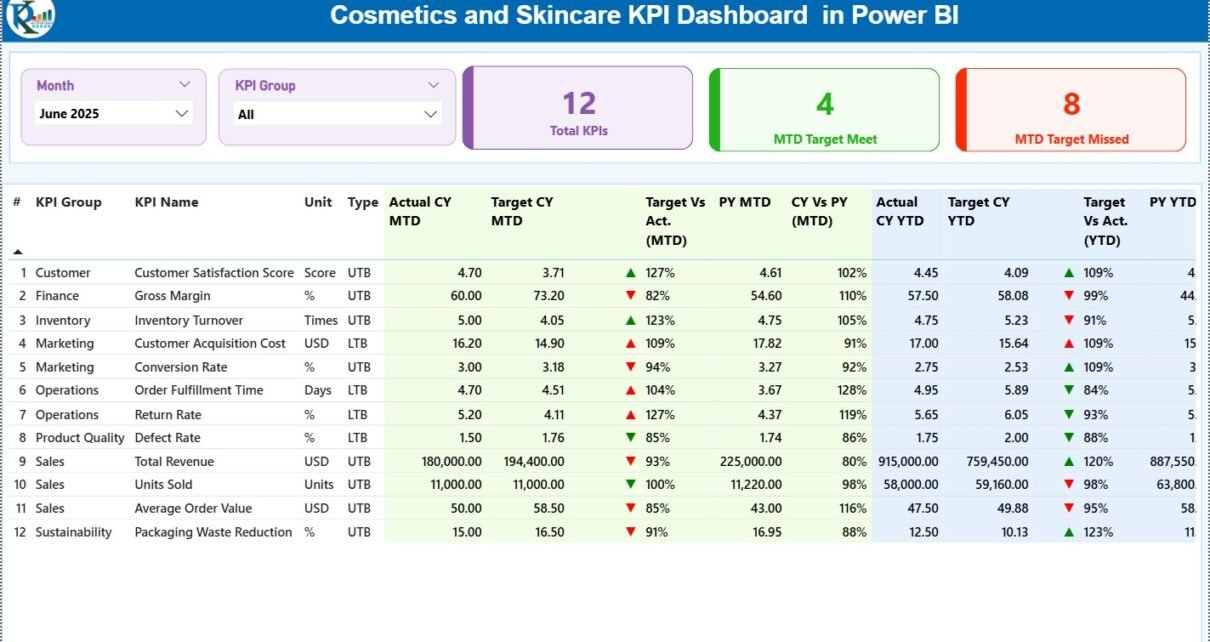
Cosmetics and Skincare KPI Dashboard in Power BI

January 16, 2026January 16, 2026 PKComments Off on Cosmetics and Skincare KPI Dashboard in Power BI
The cosmetics and skincare industry is evolving rapidly. New products launch frequently, customer expectations change quickly, and competition continues to grow. Therefore, beauty brands must track performance accurately, consistently, and
Read More

Posts pagination

Previous 1 … 38 39 40 … 85 Next
  • Learn Excel (Free Course)
    • 1. Shortcut Keys
    • 2. Fill & Flash Fill
    • 3. Find & Replace
    • 4. Sort & Filter
    • 5. Formulas & Functions
    • 6. Data Validation
    • 7. Conditional Formatting
    • 8. Basic Charts
    • 9. Advanced Charts
    • 10. Pivot Tables
    • 11. Excel Dashboards
    • 12. VBA Course
    • 13. Excel Formulas with AI
  • Templates
  • Tutorials
    • Charts and Visualization
    • VBA
    • Excel Tips and Tricks
    • Excel Dashboards
    • Power Pivot & DAX
  • Power BI
  • Template Store
    • Ready to Use Templates
  • Courses
  • Academy
    • Excel + AI Mastery: 100 Formulas
    • Excel Pivot Tables & Dashboards
  • About Us
  • Contact Us
Copyright © 2023 PK-AnExcelExpert.com - Privacy Policy