New: NextGenTemplates Academy - video courses on Excel formulas with AI and Pivot Tables & dashboards. Early-bird: 20% off with code EARLYBIRD20 - first 20 orders only. See the courses →
  • Learn Excel (Free Course)
    • 1. Shortcut Keys
    • 2. Fill & Flash Fill
    • 3. Find & Replace
    • 4. Sort & Filter
    • 5. Formulas & Functions
    • 6. Data Validation
    • 7. Conditional Formatting
    • 8. Basic Charts
    • 9. Advanced Charts
    • 10. Pivot Tables
    • 11. Excel Dashboards
    • 12. VBA Course
    • 13. Excel Formulas with AI
  • Templates
  • Tutorials
    • Charts and Visualization
    • VBA
    • Excel Tips and Tricks
    • Excel Dashboards
    • Power Pivot & DAX
  • Power BI
  • Template Store
    • Ready to Use Templates
  • Courses
  • Academy
    • Excel + AI Mastery: 100 Formulas
    • Excel Pivot Tables & Dashboards
  • About Us
  • Contact Us

PK: An Excel Expert

Transforming Data into Decisions
Tag: Power BI dashboard

Dashboard Power BI

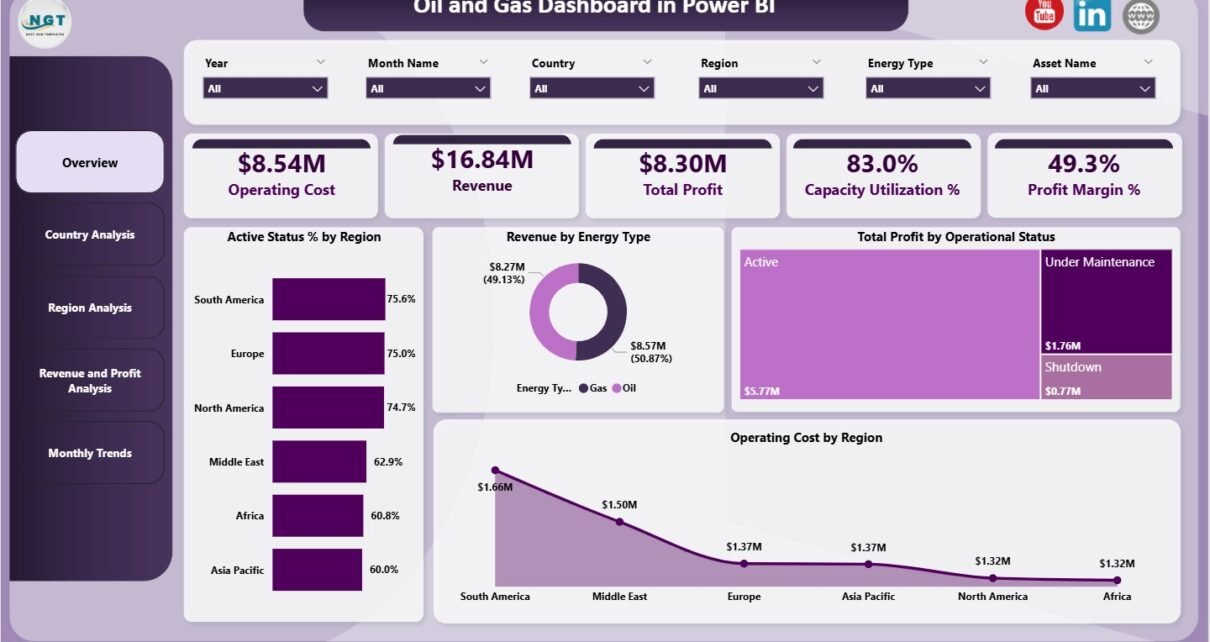
Oil and Gas Dashboard in Power BI

January 16, 2026January 16, 2026 PKComments Off on Oil and Gas Dashboard in Power BI
The oil and gas industry runs on data, scale, and precision. Every day, companies track production, revenue, operating cost, capacity utilization, and profit margins across regions and countries. However, when
Read More
Dashboard Power BI

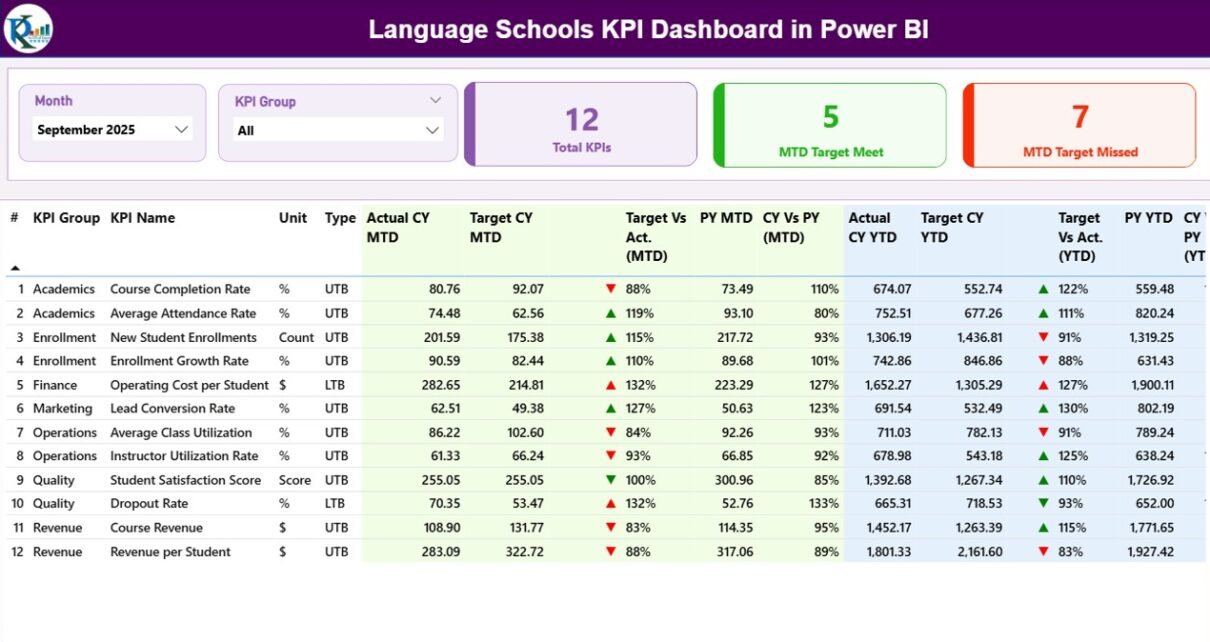
Language Schools KPI Dashboard in Power BI

January 16, 2026January 16, 2026 PKComments Off on Language Schools KPI Dashboard in Power BI
Running a language school requires constant monitoring of academic quality, student engagement, operational efficiency, and financial performance. However, when data stays scattered across spreadsheets, emails, and systems, leaders struggle to
Read More
Dashboard Power BI

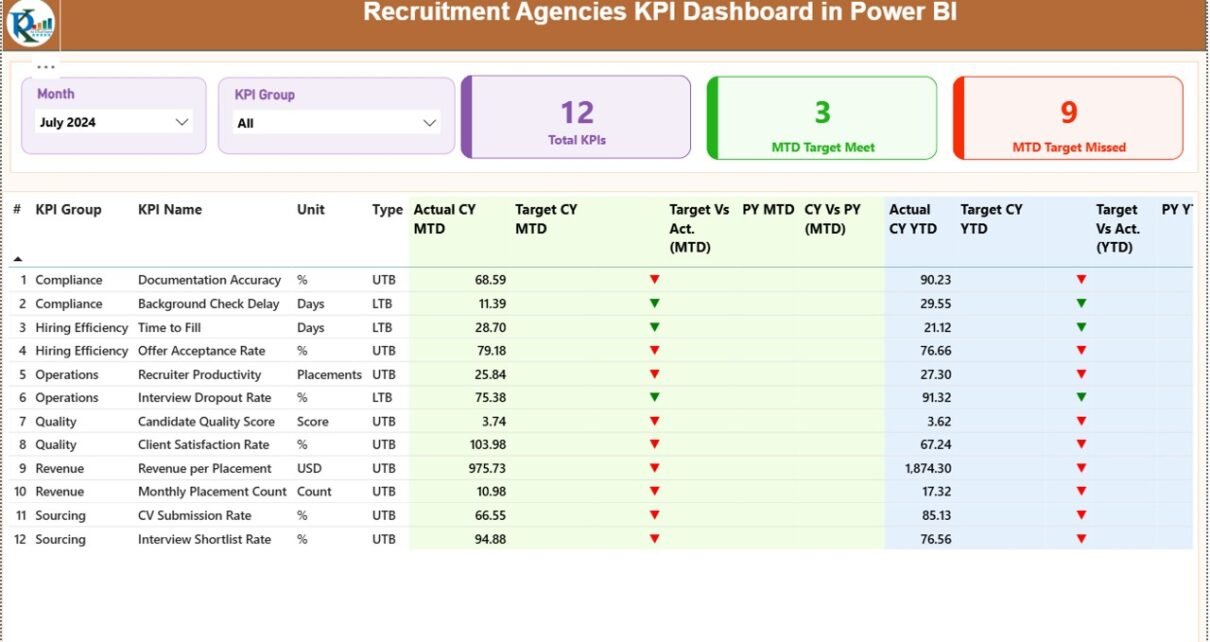
Recruitment Agencies KPI Dashboard in Power BI

January 16, 2026January 16, 2026 PKComments Off on Recruitment Agencies KPI Dashboard in Power BI
Recruitment agencies operate in a fast-paced, target-driven environment. Every day, teams track candidates, clients, interviews, offers, and revenue. However, without structured performance tracking, agencies lose clarity. As a result, decision-making
Read More
Dashboard Power BI

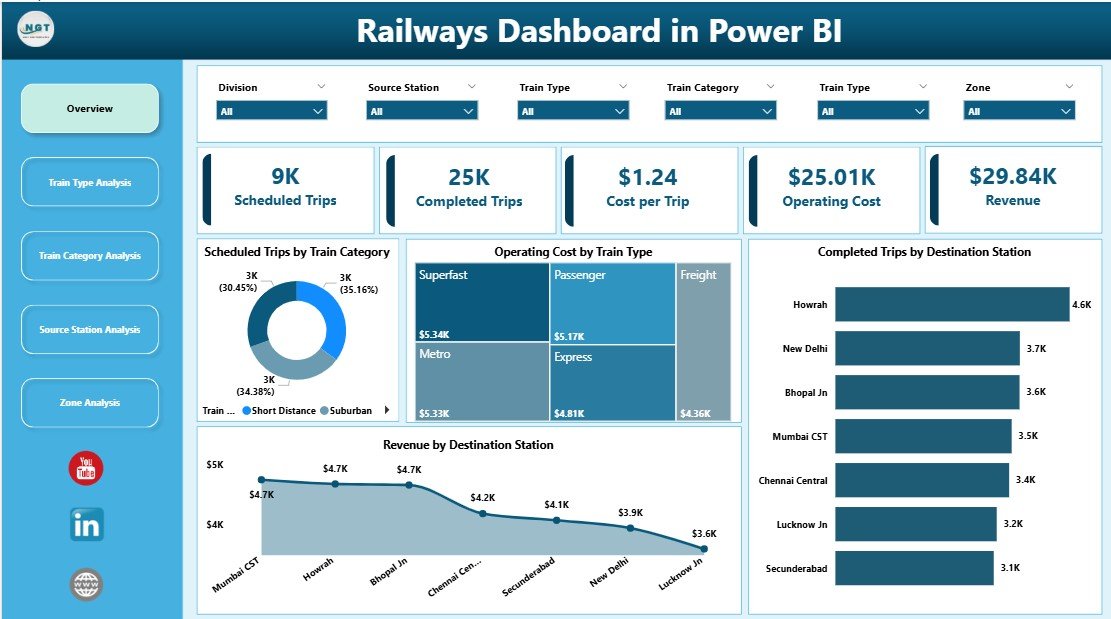
Railways Dashboard in Power BI

January 15, 2026January 15, 2026 PKComments Off on Railways Dashboard in Power BI
Railway networks manage thousands of trips, stations, zones, and train categories every day. Because operations run at such scale, decision-makers need clear visibility into performance, cost, and revenue. However, traditional
Read More
Dashboard Power BI

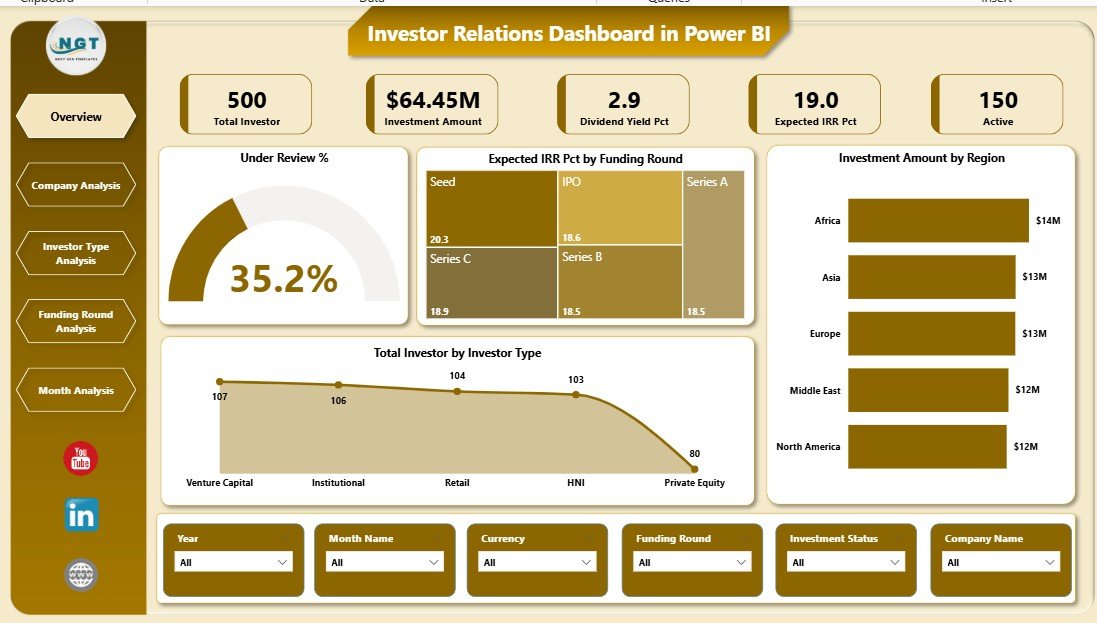
Investor Relations Dashboard in Power BI

January 15, 2026January 15, 2026 PKComments Off on Investor Relations Dashboard in Power BI
Investor relations play a critical role in building trust, transparency, and long-term value between organizations and their investors. However, managing investor data using scattered spreadsheets, static reports, and manual presentations
Read More
Dashboard Power BI

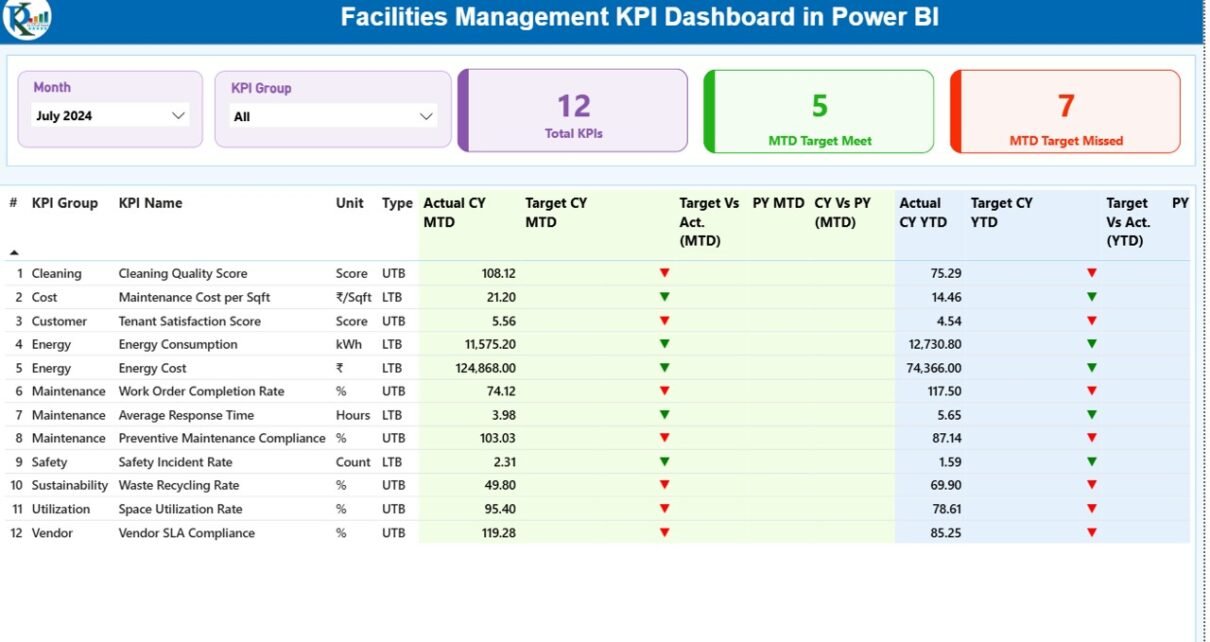
Facilities Management KPI Dashboard in Power BI

January 15, 2026January 15, 2026 PKComments Off on Facilities Management KPI Dashboard in Power BI
Facilities management plays a critical role in keeping organizations productive, safe, and cost-efficient. Offices, factories, hospitals, campuses, malls, and commercial buildings generate a massive amount of operational data every single
Read More
Dashboard Power BI

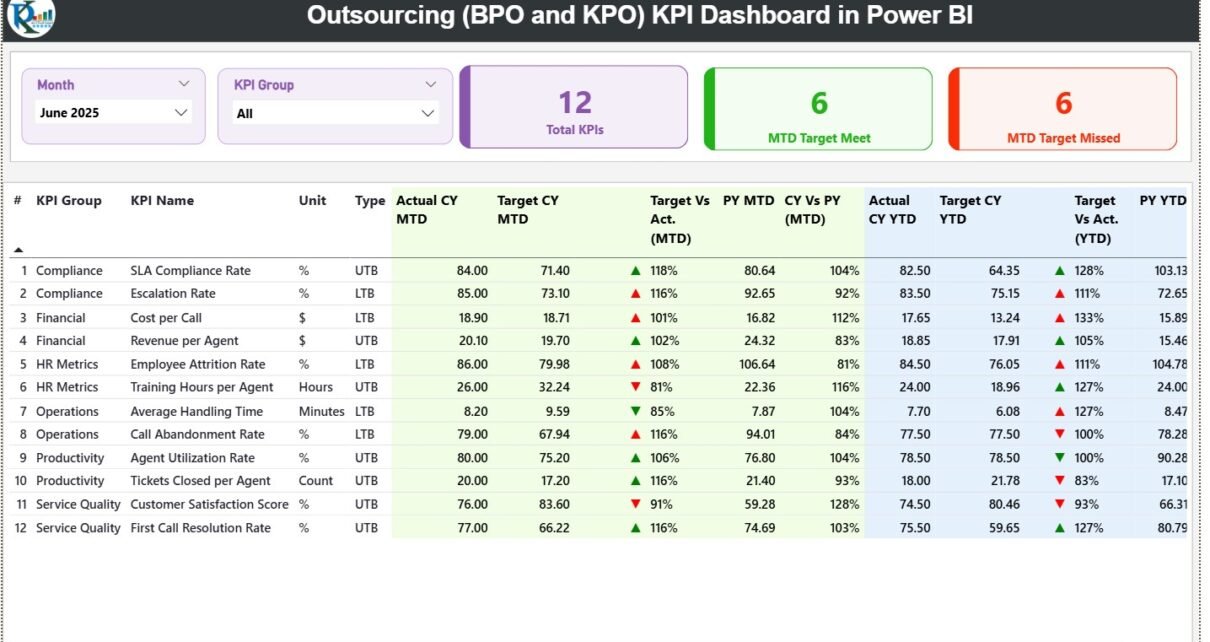
Outsourcing (BPO and KPO) KPI Dashboard in Power BI

January 15, 2026January 15, 2026 PKComments Off on Outsourcing (BPO and KPO) KPI Dashboard in Power BI
In today’s highly competitive outsourcing industry, data-driven decision-making defines success. Business Process Outsourcing (BPO) and Knowledge Process Outsourcing (KPO) organizations manage large workforces, strict SLAs, multiple clients, and complex processes.
Read More
Dashboard Power BI

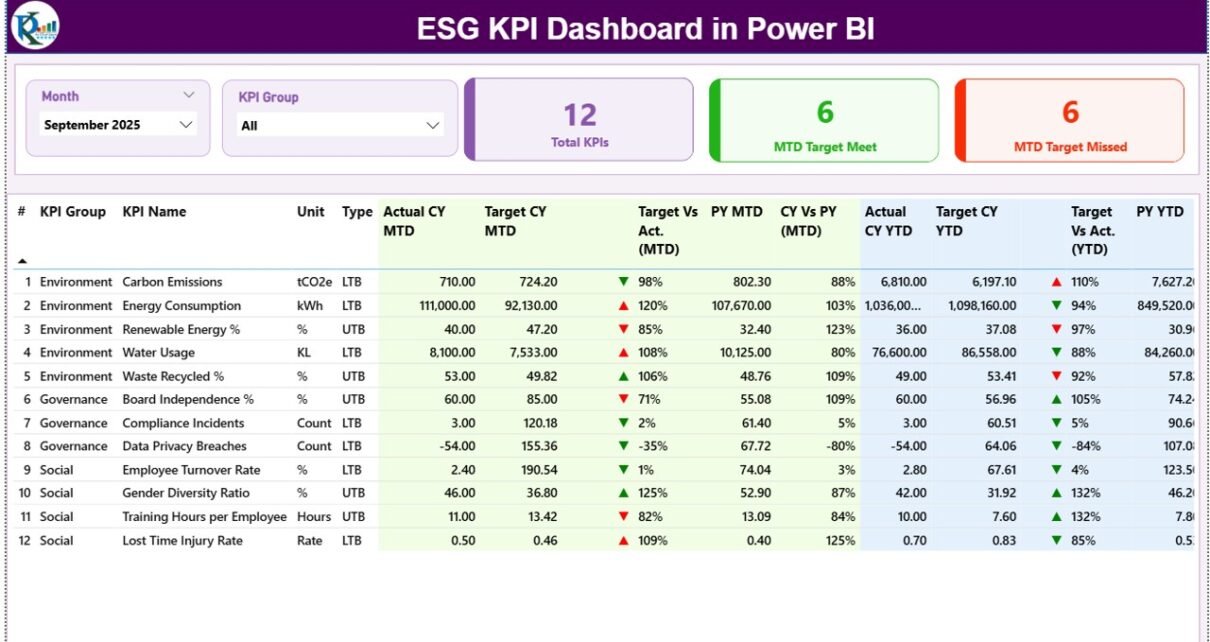
ESG KPI Dashboard in Power BI

January 15, 2026January 15, 2026 PKComments Off on ESG KPI Dashboard in Power BI
In today’s business environment, organizations must track Environmental, Social, and Governance (ESG) performance with the same seriousness as financial results. Investors, regulators, customers, and internal leaders expect clear, measurable, and
Read More
Dashboard Power BI

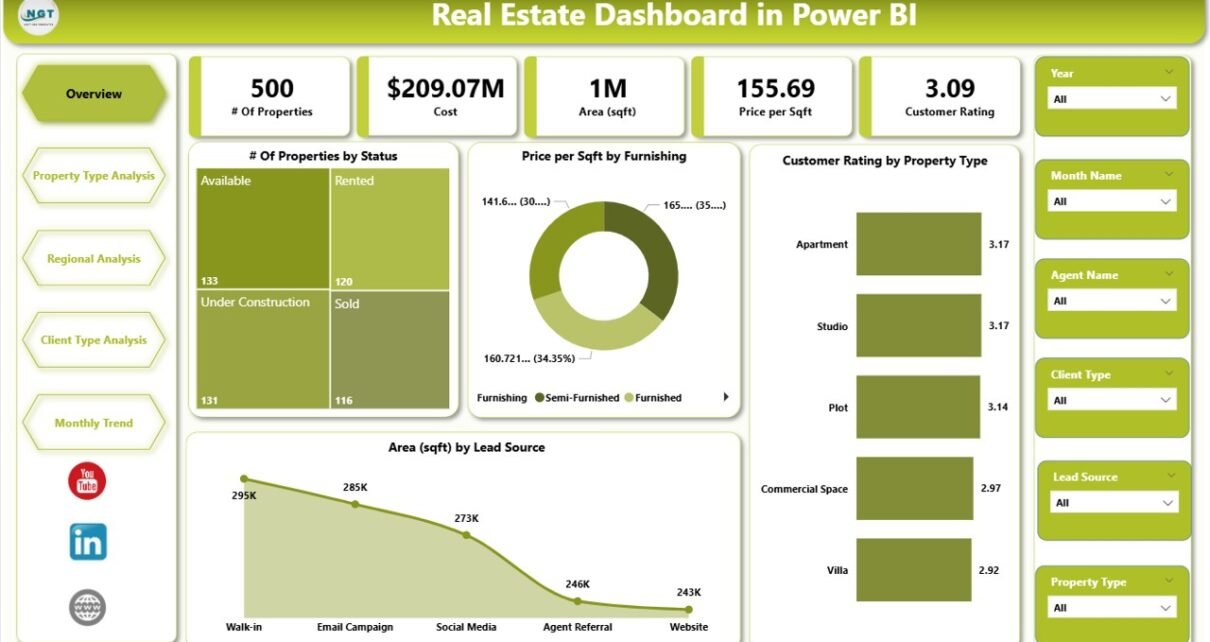
Real Estate Dashboard in Power BI

January 14, 2026January 14, 2026 PKComments Off on Real Estate Dashboard in Power BI
In today’s competitive property market, data-driven decision-making decides success. Real estate businesses generate large volumes of data every day. However, raw data alone never creates value. Instead, you must convert
Read More
Dashboard Power BI

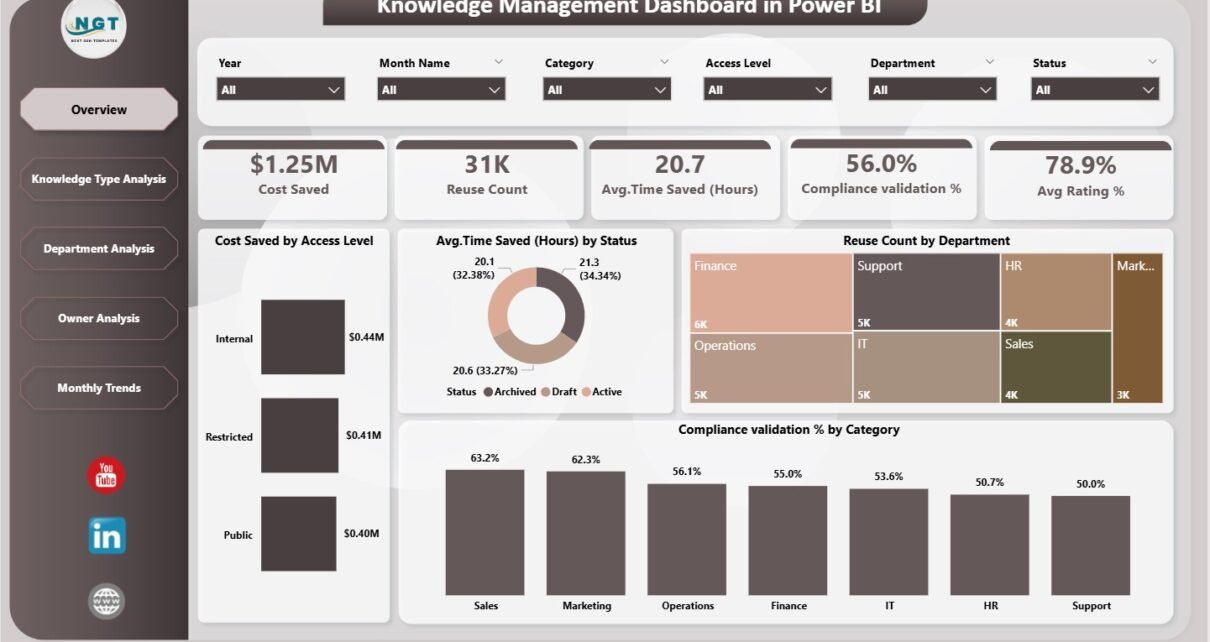
Knowledge Management Dashboard in Power BI

January 14, 2026January 14, 2026 PKComments Off on Knowledge Management Dashboard in Power BI
Organizations generate knowledge every single day—documents, SOPs, best practices, training material, and lessons learned. However, most organizations struggle to measure how effectively this knowledge is reused, how much cost it
Read More

Posts pagination

Previous 1 … 39 40 41 … 85 Next
  • Learn Excel (Free Course)
    • 1. Shortcut Keys
    • 2. Fill & Flash Fill
    • 3. Find & Replace
    • 4. Sort & Filter
    • 5. Formulas & Functions
    • 6. Data Validation
    • 7. Conditional Formatting
    • 8. Basic Charts
    • 9. Advanced Charts
    • 10. Pivot Tables
    • 11. Excel Dashboards
    • 12. VBA Course
    • 13. Excel Formulas with AI
  • Templates
  • Tutorials
    • Charts and Visualization
    • VBA
    • Excel Tips and Tricks
    • Excel Dashboards
    • Power Pivot & DAX
  • Power BI
  • Template Store
    • Ready to Use Templates
  • Courses
  • Academy
    • Excel + AI Mastery: 100 Formulas
    • Excel Pivot Tables & Dashboards
  • About Us
  • Contact Us
Copyright © 2023 PK-AnExcelExpert.com - Privacy Policy