New: NextGenTemplates Academy - video courses on Excel formulas with AI and Pivot Tables & dashboards. Early-bird: 20% off with code EARLYBIRD20 - first 20 orders only. See the courses →
  • Learn Excel (Free Course)
    • 1. Shortcut Keys
    • 2. Fill & Flash Fill
    • 3. Find & Replace
    • 4. Sort & Filter
    • 5. Formulas & Functions
    • 6. Data Validation
    • 7. Conditional Formatting
    • 8. Basic Charts
    • 9. Advanced Charts
    • 10. Pivot Tables
    • 11. Excel Dashboards
    • 12. VBA Course
    • 13. Excel Formulas with AI
  • Templates
  • Tutorials
    • Charts and Visualization
    • VBA
    • Excel Tips and Tricks
    • Excel Dashboards
    • Power Pivot & DAX
  • Power BI
  • Template Store
    • Ready to Use Templates
  • Courses
  • Academy
    • Excel + AI Mastery: 100 Formulas
    • Excel Pivot Tables & Dashboards
  • About Us
  • Contact Us

PK: An Excel Expert

Transforming Data into Decisions

Tag: Power BI dashboard

Dashboard Power BI

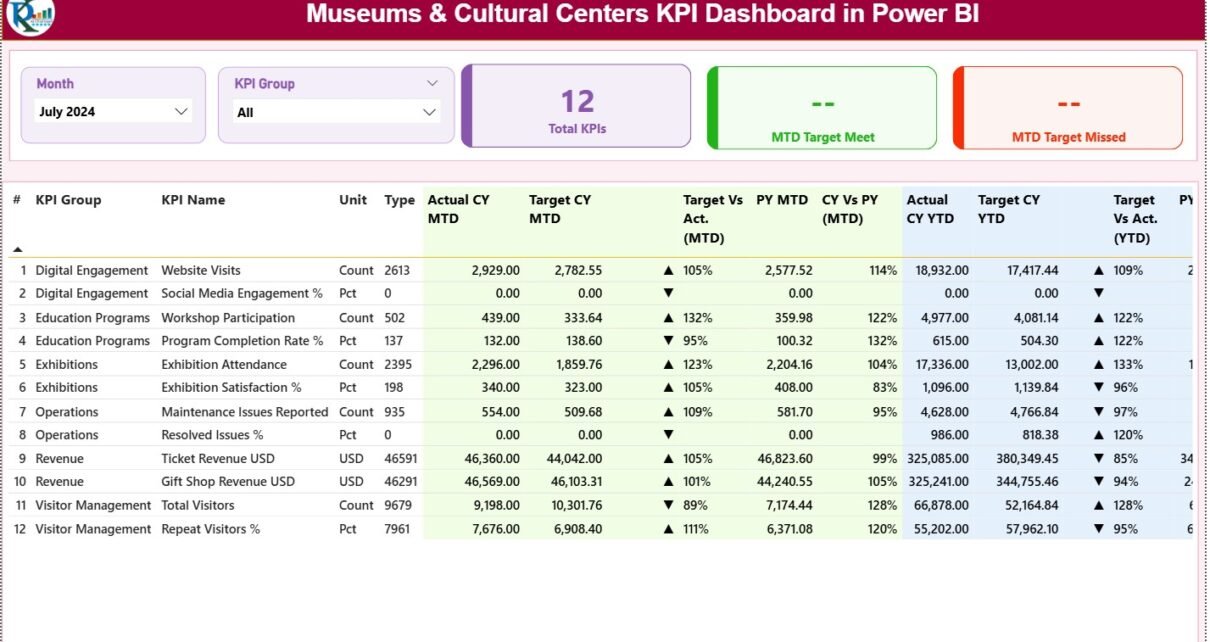
Museums & Cultural Centres KPI Dashboard in Power BI

December 12, 2025December 12, 2025 PKComments Off on Museums & Cultural Centres KPI Dashboard in Power BI
Museums and cultural centres play an important role in preserving history, promoting creativity, and enriching communities. Because of this heavy responsibility, cultural institutions must track many performance metrics to understand
Read More
Power BI

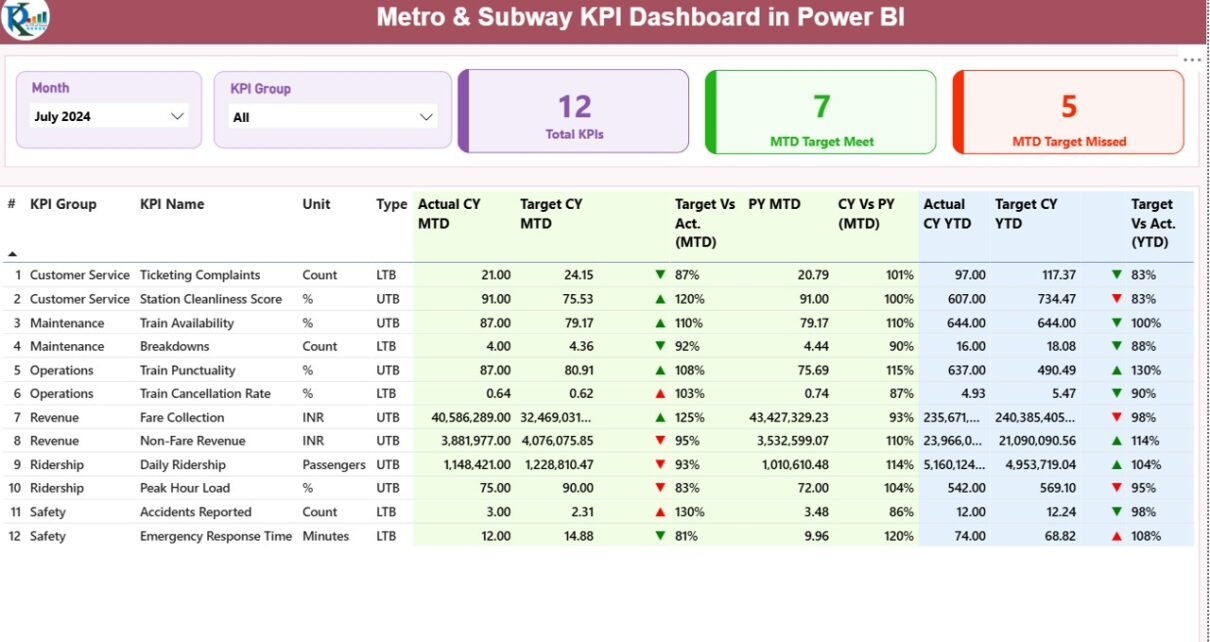
Metro & Subway KPI Dashboard in Power BI

December 11, 2025December 11, 2025 PKComments Off on Metro & Subway KPI Dashboard in Power BI
Modern metro and subway operations run with high speed, tight schedules, and strict safety rules. Every trip, every train, and every station generates useful data. When teams track this data
Read More
Dashboard Power BI

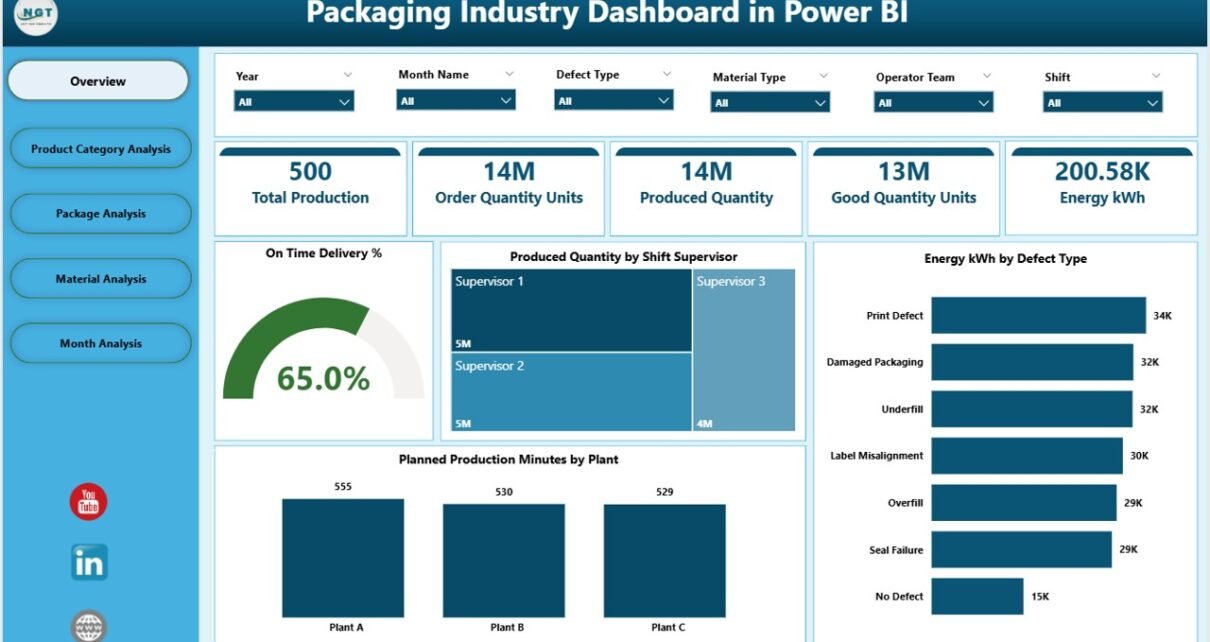
Packaging Industry Dashboard in Power BI

December 11, 2025December 11, 2025 PKComments Off on Packaging Industry Dashboard in Power BI
The packaging industry runs on speed, accuracy, and real-time decision-making. Every day, teams monitor production volumes, energy usage, material performance, defect levels, and delivery timelines. When managers track these KPIs
Read More
Dashboard Power BI

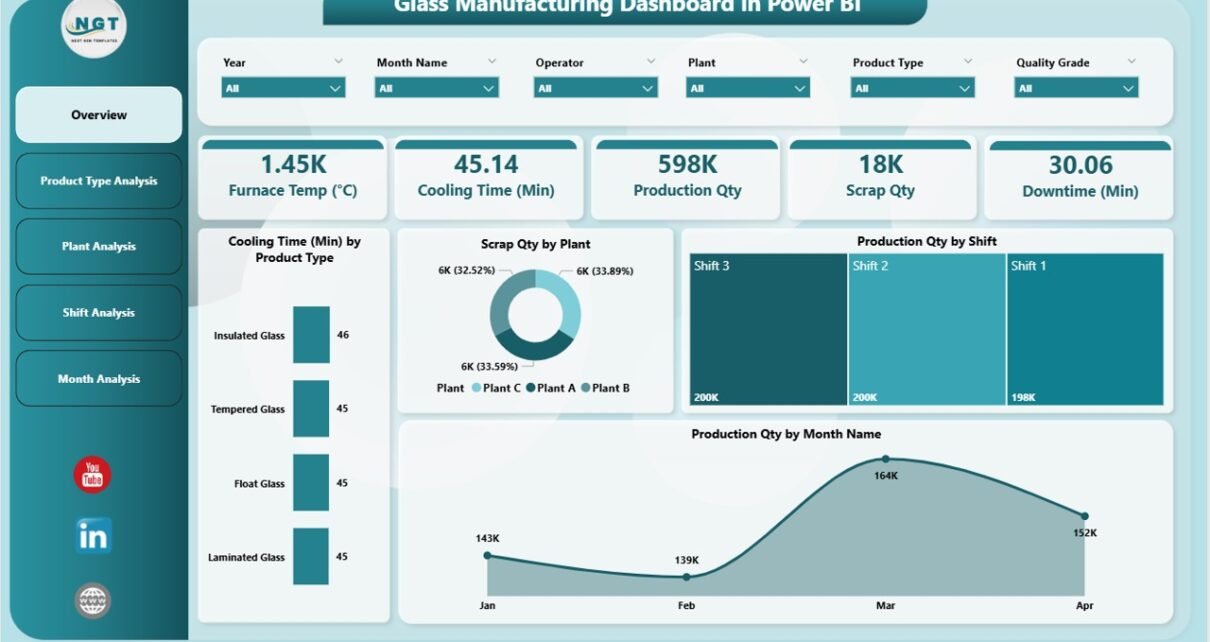
Glass Manufacturing Dashboard in Power BI

December 11, 2025December 11, 2025 PKComments Off on Glass Manufacturing Dashboard in Power BI
Running a glass manufacturing unit demands constant monitoring, quick decisions, and complete clarity over daily operations. Production teams deal with many challenges every single day—energy usage, furnace temperature, cooling time,
Read More
Dashboard Power BI

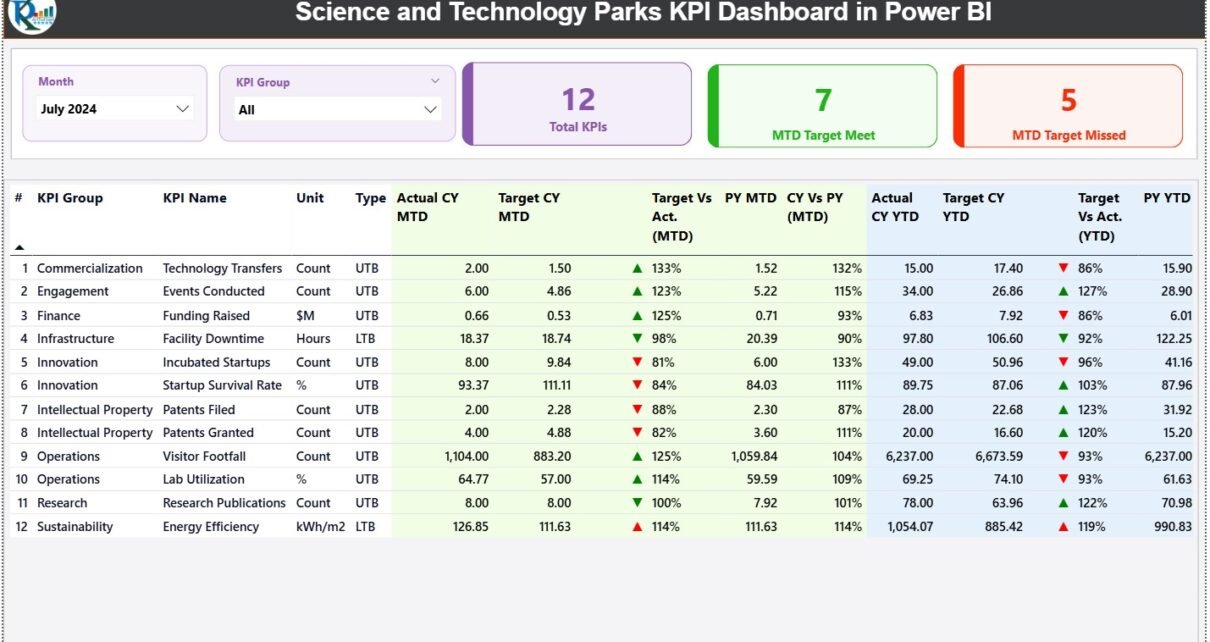
Science and Technology Parks KPI Dashboard in Power BI

December 11, 2025December 11, 2025 PKComments Off on Science and Technology Parks KPI Dashboard in Power BI
Science and Technology Parks (STPs) help countries grow their innovation capabilities. They support startups, research institutes, technology companies, and incubation centers. These parks act as engines of economic development because
Read More
Dashboard

Car Rental Services KPI Dashboard in Power BI

December 11, 2025December 11, 2025 PKComments Off on Car Rental Services KPI Dashboard in Power BI
Today’s car rental industry runs on speed, convenience, and constant updates. Customers want fast service, clean vehicles, quick check-in and check-out, and transparent pricing. Because of this, car rental companies
Read More
Dashboard Power BI

Loan Portfolio KPI Dashboard in Power BI

December 11, 2025December 11, 2025 PKComments Off on Loan Portfolio KPI Dashboard in Power BI
Managing a loan portfolio becomes harder every year. Competition rises, credit risk changes fast, customers expect quick decisions, and leadership demands accurate performance insights. Because of these challenges, financial institutions
Read More
Dashboard Power BI

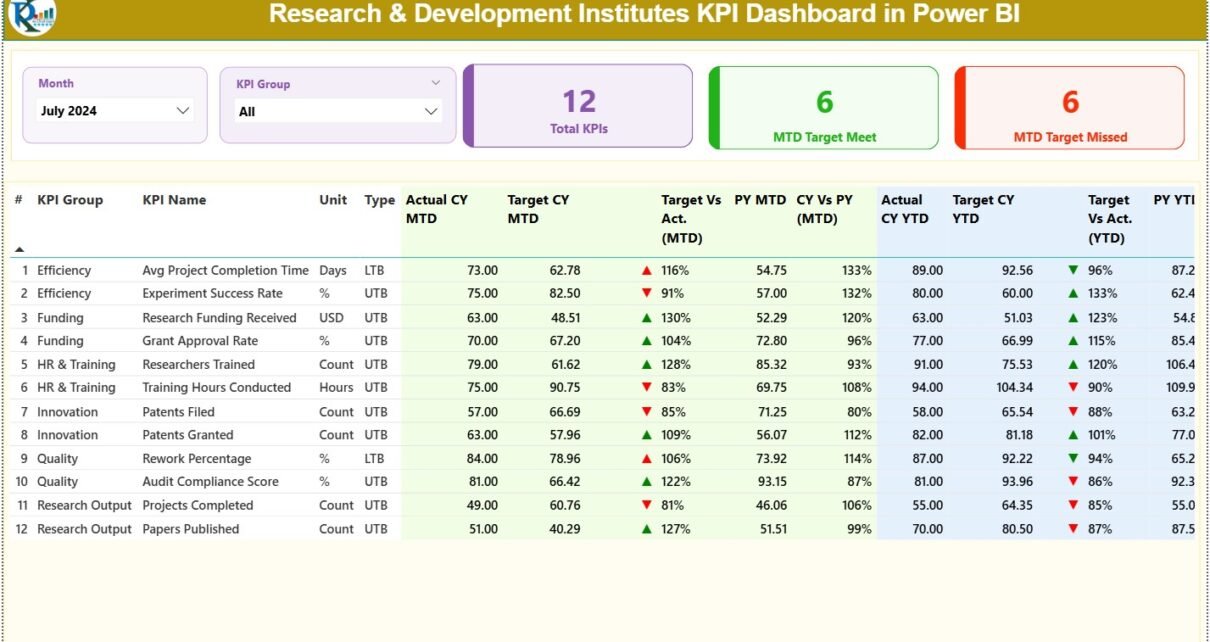
Research & Development Institutes KPI Dashboard in Power BI

December 11, 2025December 11, 2025 PKComments Off on Research & Development Institutes KPI Dashboard in Power BI
Research and Development (R&D) institutes run innovation, discovery, science, and technology growth. These institutes handle complex projects, long development cycles, advanced experiments, and multi-disciplinary teams. Because of this, leaders need
Read More
Dashboard Power BI

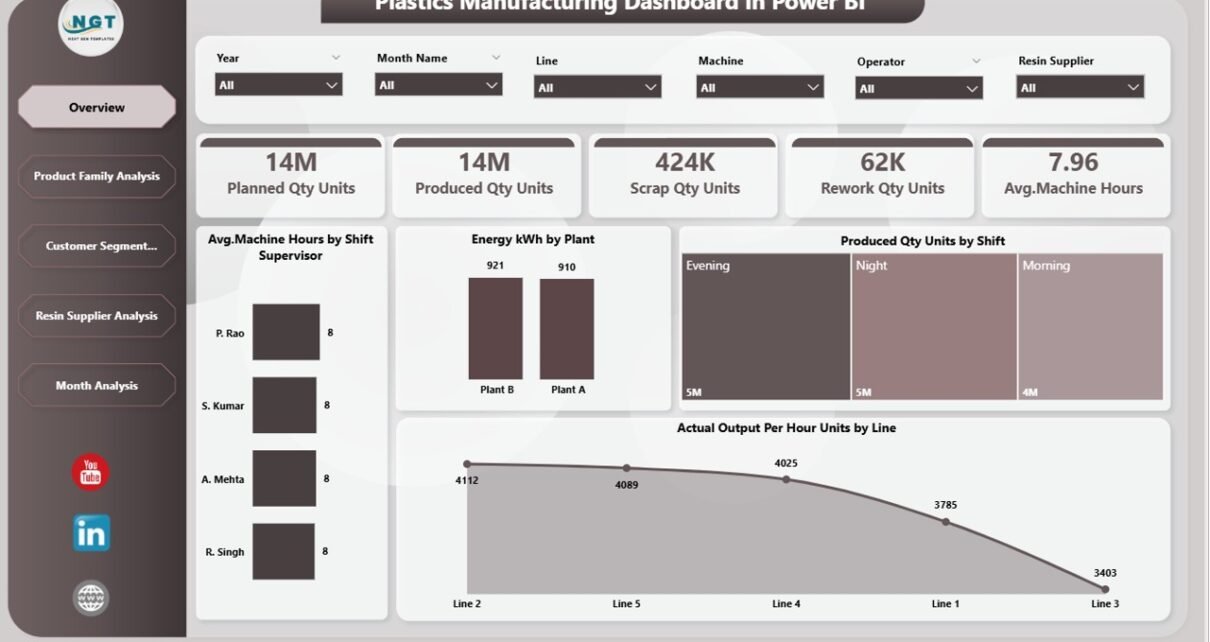
Plastics Manufacturing Dashboard in Power BI

December 10, 2025December 10, 2025 PKComments Off on Plastics Manufacturing Dashboard in Power BI
Managing a plastics manufacturing operation is never simple. You must balance production volume, energy consumption, scrap levels, machine utilization, supplier performance, and customer demand—all at the same time. However, when
Read More
Dashboard Power BI

Customer Experience Dashboard in Power BI

December 10, 2025December 10, 2025 PKComments Off on Customer Experience Dashboard in Power BI
Delivering an excellent customer experience no longer depends on guesswork. Instead, businesses must track customer interactions, measure service quality, and analyze behavior patterns in real time. Therefore, organizations across industries
Read More

Posts pagination

Previous 1 … 53 54 55 … 85 Next
  • Learn Excel (Free Course)
    • 1. Shortcut Keys
    • 2. Fill & Flash Fill
    • 3. Find & Replace
    • 4. Sort & Filter
    • 5. Formulas & Functions
    • 6. Data Validation
    • 7. Conditional Formatting
    • 8. Basic Charts
    • 9. Advanced Charts
    • 10. Pivot Tables
    • 11. Excel Dashboards
    • 12. VBA Course
    • 13. Excel Formulas with AI
  • Templates
  • Tutorials
    • Charts and Visualization
    • VBA
    • Excel Tips and Tricks
    • Excel Dashboards
    • Power Pivot & DAX
  • Power BI
  • Template Store
    • Ready to Use Templates
  • Courses
  • Academy
    • Excel + AI Mastery: 100 Formulas
    • Excel Pivot Tables & Dashboards
  • About Us
  • Contact Us
Copyright © 2023 PK-AnExcelExpert.com - Privacy Policy