New: NextGenTemplates Academy - video courses on Excel formulas with AI and Pivot Tables & dashboards. Early-bird: 20% off with code EARLYBIRD20 - first 20 orders only. See the courses →
  • Learn Excel (Free Course)
    • 1. Shortcut Keys
    • 2. Fill & Flash Fill
    • 3. Find & Replace
    • 4. Sort & Filter
    • 5. Formulas & Functions
    • 6. Data Validation
    • 7. Conditional Formatting
    • 8. Basic Charts
    • 9. Advanced Charts
    • 10. Pivot Tables
    • 11. Excel Dashboards
    • 12. VBA Course
    • 13. Excel Formulas with AI
  • Templates
  • Tutorials
    • Charts and Visualization
    • VBA
    • Excel Tips and Tricks
    • Excel Dashboards
    • Power Pivot & DAX
  • Power BI
  • Template Store
    • Ready to Use Templates
  • Courses
  • Academy
    • Excel + AI Mastery: 100 Formulas
    • Excel Pivot Tables & Dashboards
  • About Us
  • Contact Us

PK: An Excel Expert

Transforming Data into Decisions

Tag: Power BI dashboard

Dashboard

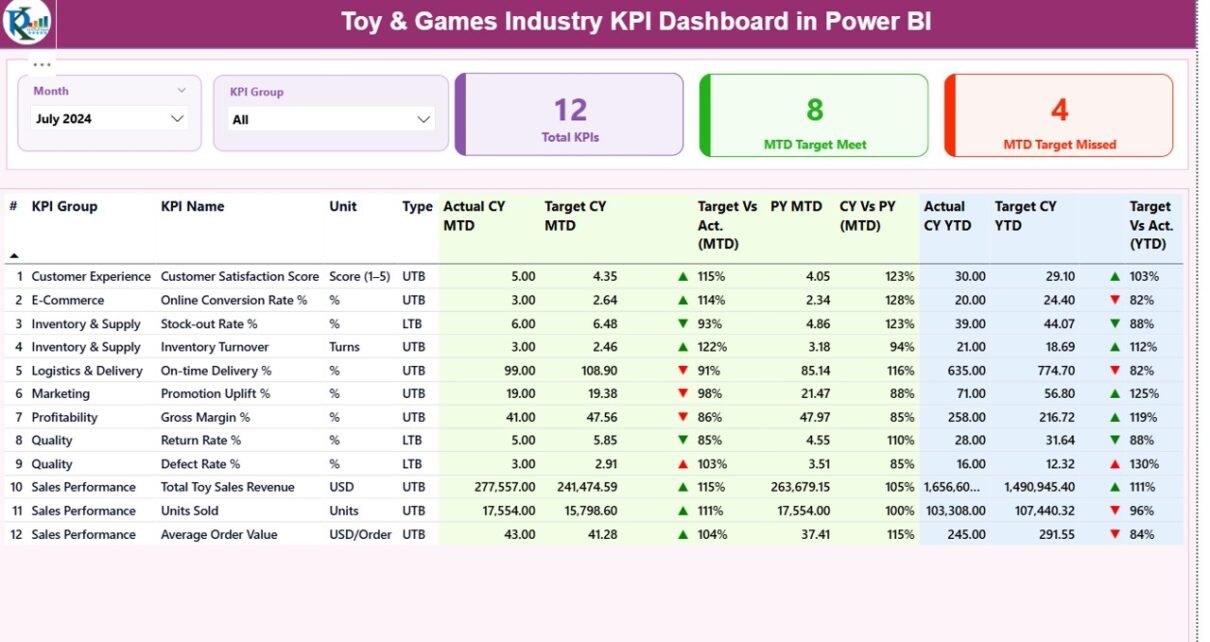
Toy & Games Industry KPI Dashboard in Power BI

December 10, 2025December 10, 2025 PKComments Off on Toy & Games Industry KPI Dashboard in Power BI
Managing performance in the toy and games industry is not as simple as tracking sales numbers alone. You deal with seasonal demand, fast-changing trends, inventory pressure, production efficiency, and customer
Read More
Dashboard Power BI

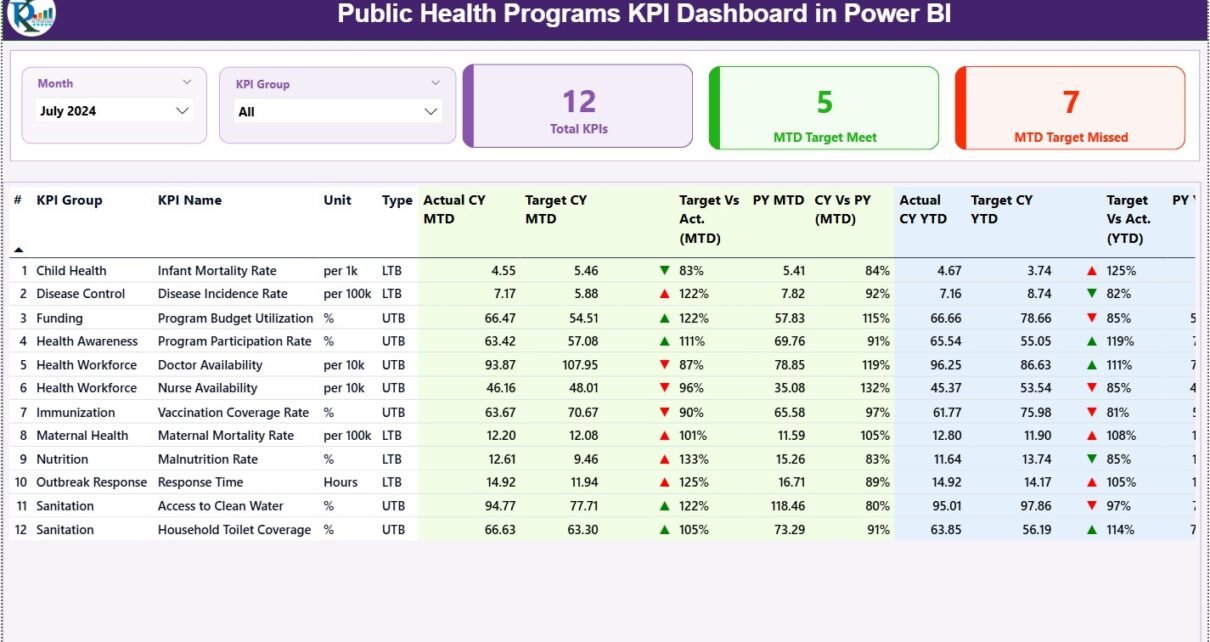
Public Health Programs KPI Dashboard in Power BI

December 10, 2025December 10, 2025 PKComments Off on Public Health Programs KPI Dashboard in Power BI
Managing public health programs without accurate performance tracking often leads to delayed interventions, inefficient resource allocation, and poor outcomes. Therefore, public health organizations increasingly rely on dashboards that convert complex
Read More
Dashboard Power BI

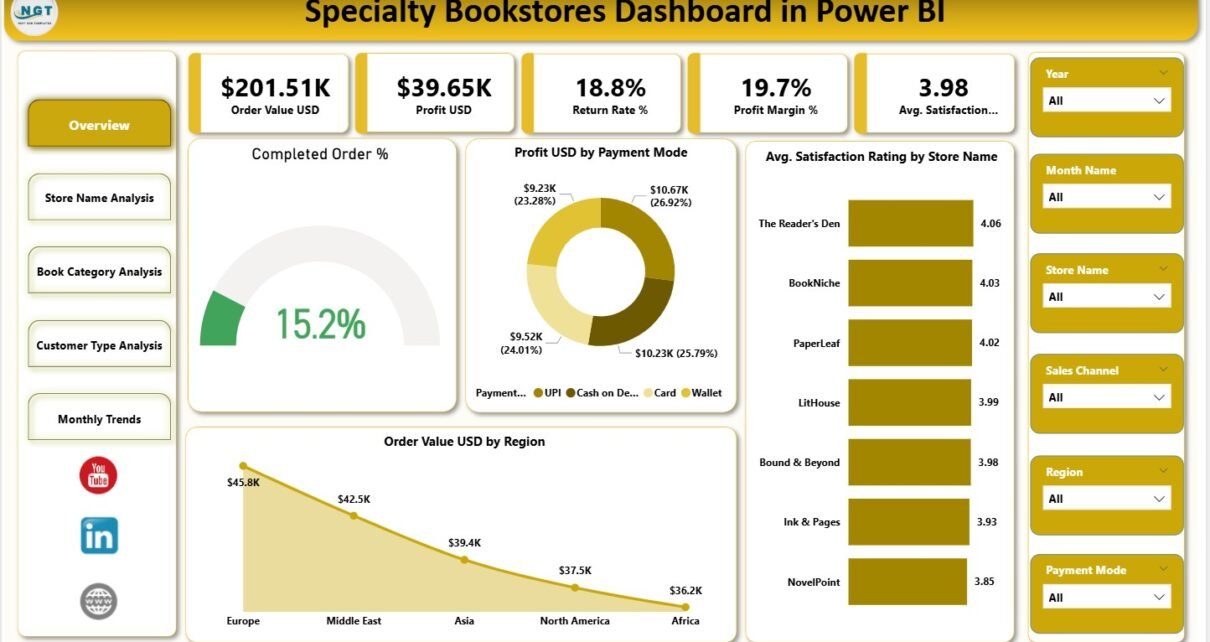
Specialty Bookstores Dashboard in Power BI

December 9, 2025December 9, 2025 PKComments Off on Specialty Bookstores Dashboard in Power BI
Running a specialty bookstore requires much more than curating great books. Today, store owners must track orders, profits, returns, customer satisfaction, and trends across stores and categories. Because manual reports
Read More
Dashboard Power BI

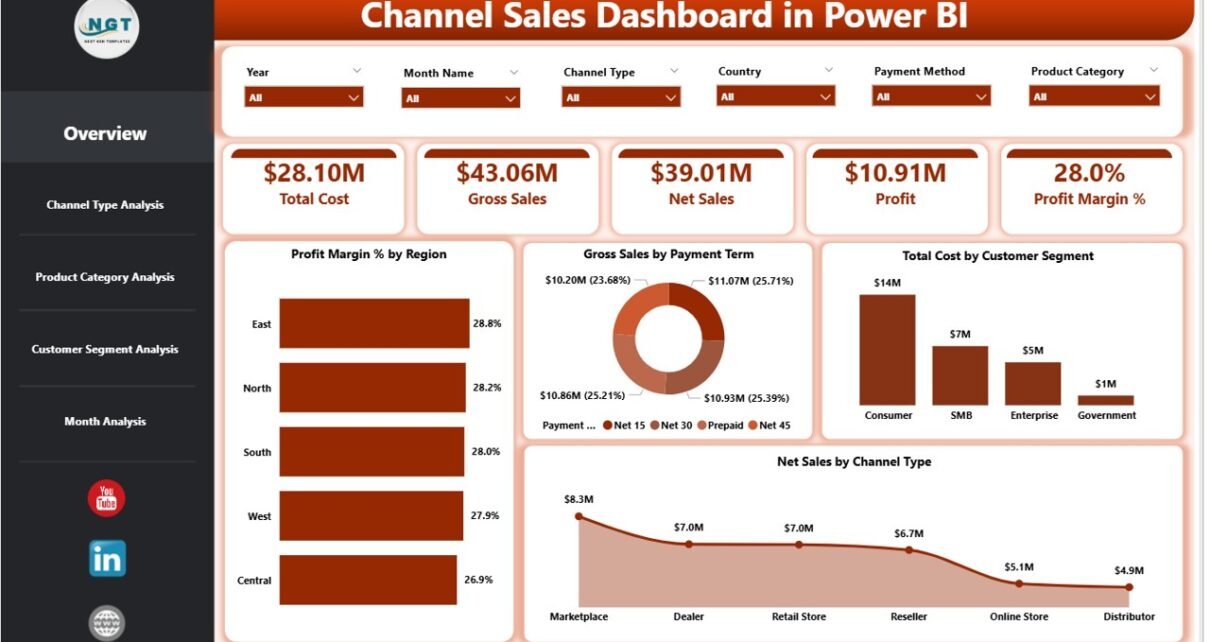
Channel Sales Dashboard in Power BI

December 9, 2025December 9, 2025 PKComments Off on Channel Sales Dashboard in Power BI
In today’s competitive business environment, companies depend heavily on indirect and multi-channel sales models. Because organizations sell through distributors, partners, resellers, and direct channels, tracking performance becomes complex and time-consuming.
Read More
Power BI

Convenience Stores KPI Dashboard in Power BI

December 9, 2025December 9, 2025 PKComments Off on Convenience Stores KPI Dashboard in Power BI
Running a convenience store business requires fast decisions, accurate insights, and complete visibility into daily operations. However, when sales, margins, inventory, and operational data stay scattered across multiple reports, decision-making
Read More
Dashboard Power BI

Brand Management Dashboard in Power BI

December 9, 2025December 9, 2025 PKComments Off on Brand Management Dashboard in Power BI
In today’s competitive market, brand success depends on how quickly and accurately you understand your marketing performance. Brands no longer grow based on intuition alone. Instead, they rely on real-time
Read More
Dashboard Power BI

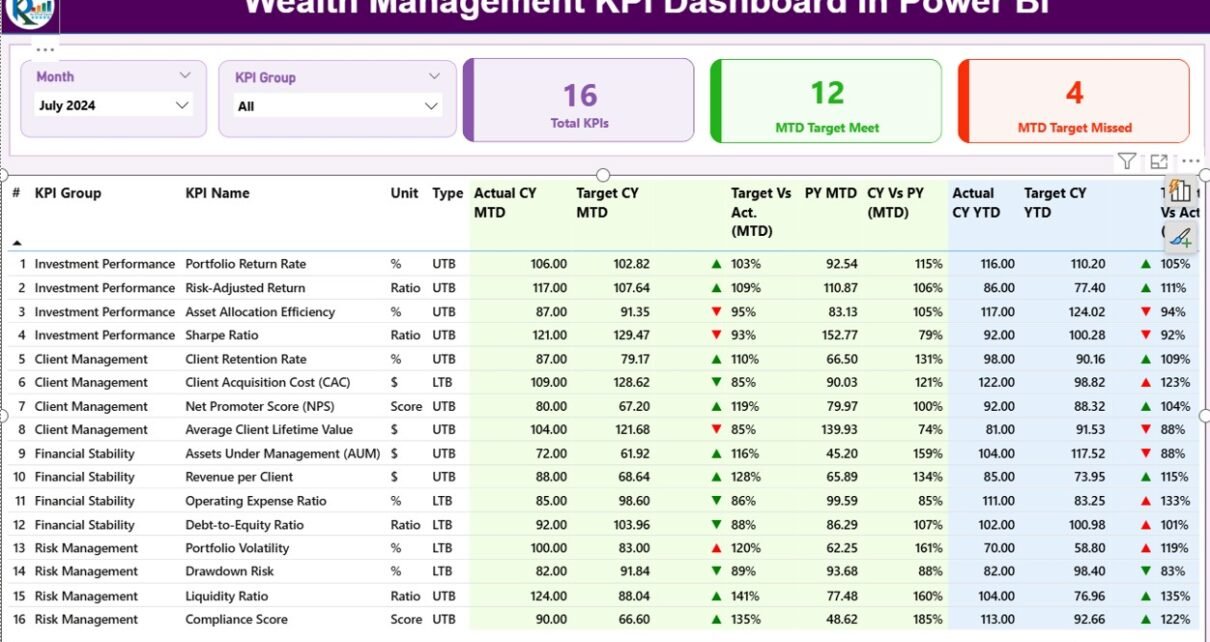
Wealth Management KPI Dashboard in Power BI

December 9, 2025December 9, 2025 PKComments Off on Wealth Management KPI Dashboard in Power BI
A Wealth Management KPI Dashboard in Power BI is a ready-to-use, interactive performance monitoring tool designed specifically for wealth managers, investment firms, private banks, and financial advisors. It helps decision-makers
Read More
Dashboard Power BI

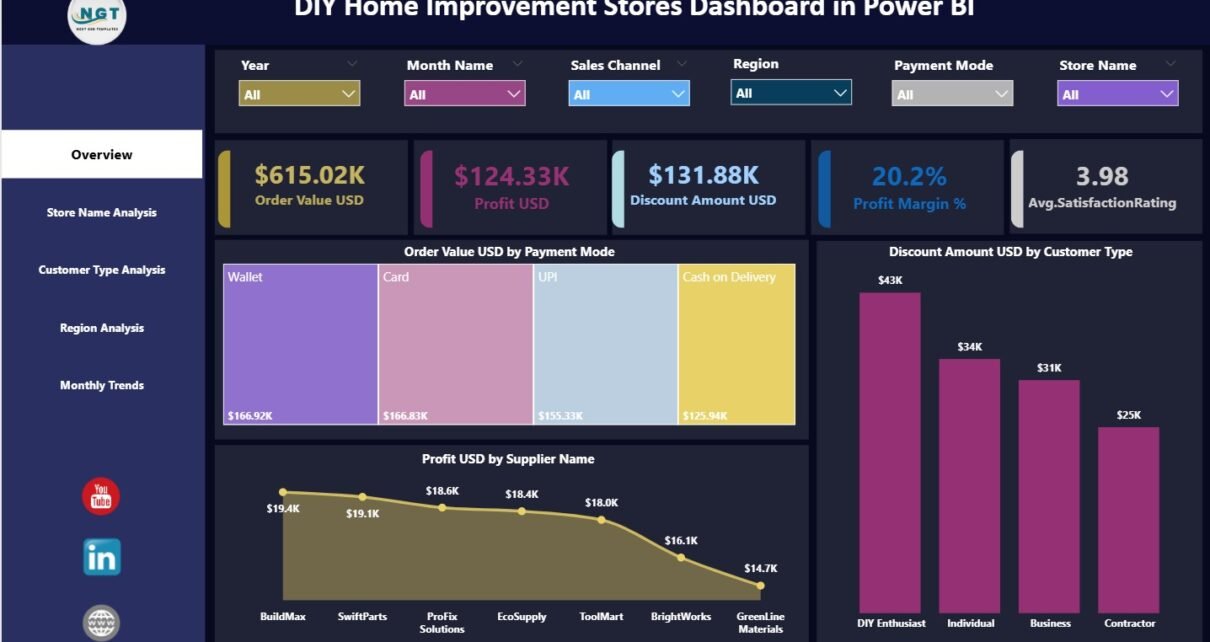
DIY Home Improvement Stores Dashboard in Power BI

December 8, 2025December 8, 2025 PKComments Off on DIY Home Improvement Stores Dashboard in Power BI
DIY home improvement stores operate in a fast-moving retail environment where pricing, discounts, suppliers, customer behavior, and regional demand change constantly. Without a structured analytics system, store managers and retail
Read More
Power BI

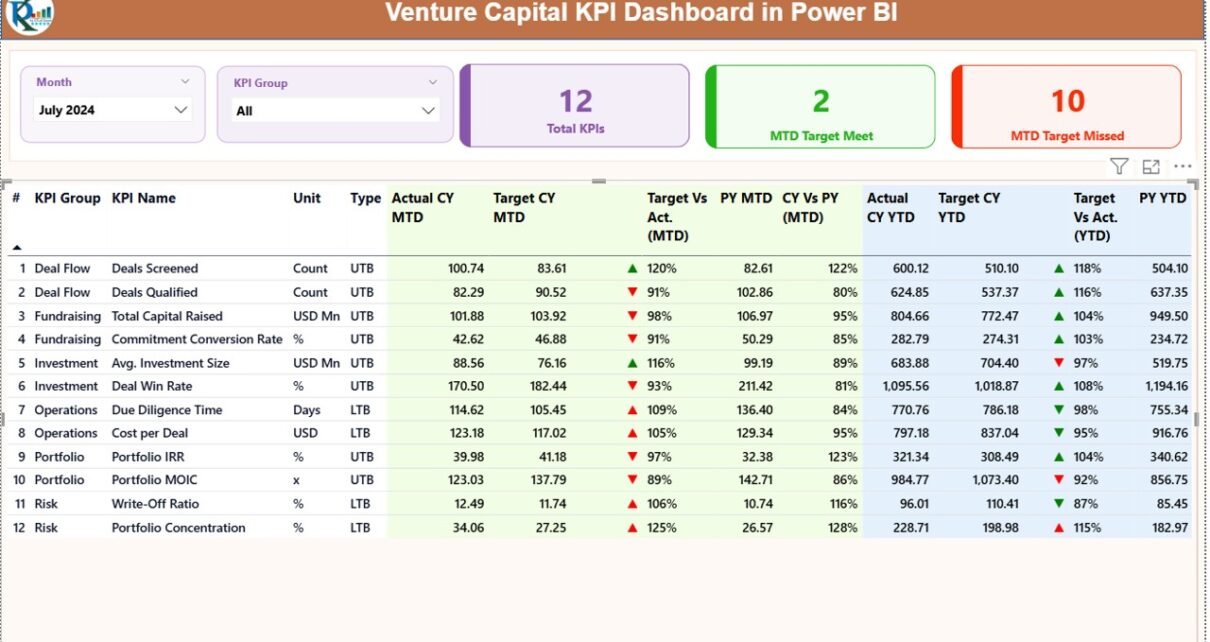
Venture Capital KPI Dashboard in Power BI

December 8, 2025December 8, 2025 PKComments Off on Venture Capital KPI Dashboard in Power BI
Venture capital firms operate in a fast-moving, high-risk environment. Therefore, partners, analysts, and fund managers must always track performance accurately. However, manual Excel reports, scattered data files, and delayed reviews
Read More
Dashboard Power BI

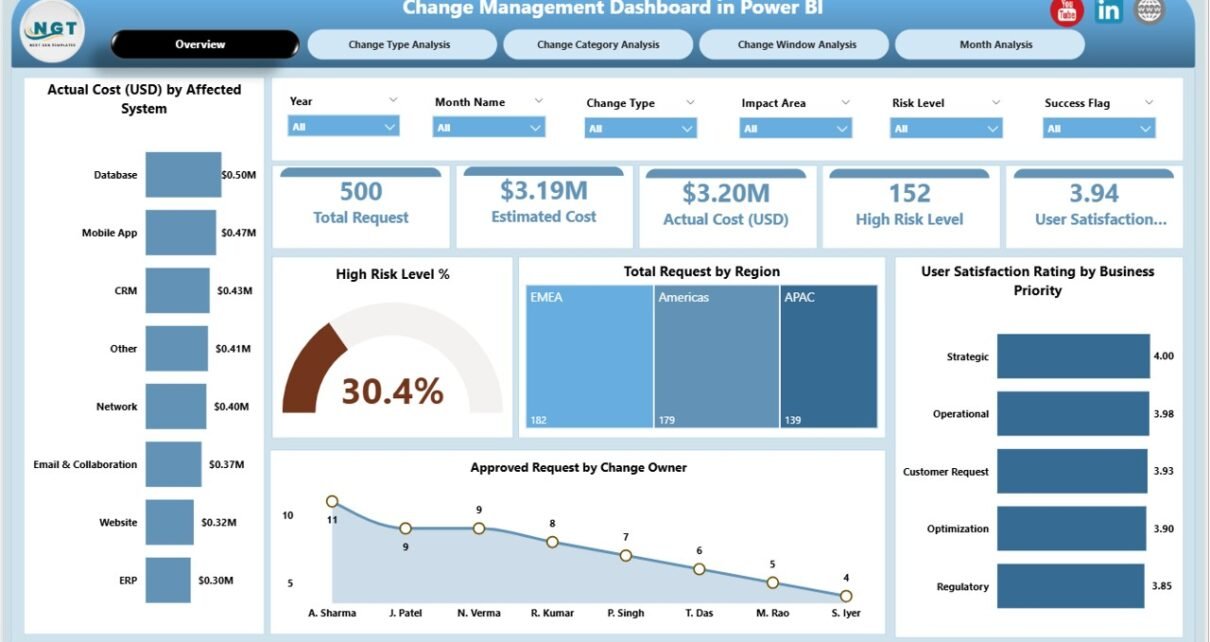
Change Management Dashboard in Power BI

December 8, 2025December 8, 2025 PKComments Off on Change Management Dashboard in Power BI
Managing change in modern organizations never stays simple. Every system update, infrastructure upgrade, or process modification brings cost, risk, and user impact. Because of this, leaders must monitor changes closely
Read More

Posts pagination

Previous 1 … 54 55 56 … 85 Next
  • Learn Excel (Free Course)
    • 1. Shortcut Keys
    • 2. Fill & Flash Fill
    • 3. Find & Replace
    • 4. Sort & Filter
    • 5. Formulas & Functions
    • 6. Data Validation
    • 7. Conditional Formatting
    • 8. Basic Charts
    • 9. Advanced Charts
    • 10. Pivot Tables
    • 11. Excel Dashboards
    • 12. VBA Course
    • 13. Excel Formulas with AI
  • Templates
  • Tutorials
    • Charts and Visualization
    • VBA
    • Excel Tips and Tricks
    • Excel Dashboards
    • Power Pivot & DAX
  • Power BI
  • Template Store
    • Ready to Use Templates
  • Courses
  • Academy
    • Excel + AI Mastery: 100 Formulas
    • Excel Pivot Tables & Dashboards
  • About Us
  • Contact Us
Copyright © 2023 PK-AnExcelExpert.com - Privacy Policy