New: NextGenTemplates Academy - video courses on Excel formulas with AI and Pivot Tables & dashboards. Early-bird: 20% off with code EARLYBIRD20 - first 20 orders only. See the courses →
  • Learn Excel (Free Course)
    • 1. Shortcut Keys
    • 2. Fill & Flash Fill
    • 3. Find & Replace
    • 4. Sort & Filter
    • 5. Formulas & Functions
    • 6. Data Validation
    • 7. Conditional Formatting
    • 8. Basic Charts
    • 9. Advanced Charts
    • 10. Pivot Tables
    • 11. Excel Dashboards
    • 12. VBA Course
    • 13. Excel Formulas with AI
  • Templates
  • Tutorials
    • Charts and Visualization
    • VBA
    • Excel Tips and Tricks
    • Excel Dashboards
    • Power Pivot & DAX
  • Power BI
  • Template Store
    • Ready to Use Templates
  • Courses
  • Academy
    • Excel + AI Mastery: 100 Formulas
    • Excel Pivot Tables & Dashboards
  • About Us
  • Contact Us

PK: An Excel Expert

Transforming Data into Decisions

Tag: Power BI dashboard

Templates

Chemical Manufacturing KPI Dashboard in Power BI

November 29, 2025November 29, 2025 PKComments Off on Chemical Manufacturing KPI Dashboard in Power BI
Chemical manufacturing runs on precision, safety, and efficiency. Every batch, process, and shift produces huge amounts of data. When this data stays in spreadsheets or scattered reports, leaders struggle to
Read More
Dashboard Power BI

Jewellery & Watches Dashboard in Power BI

November 29, 2025November 29, 2025 PKComments Off on Jewellery & Watches Dashboard in Power BI
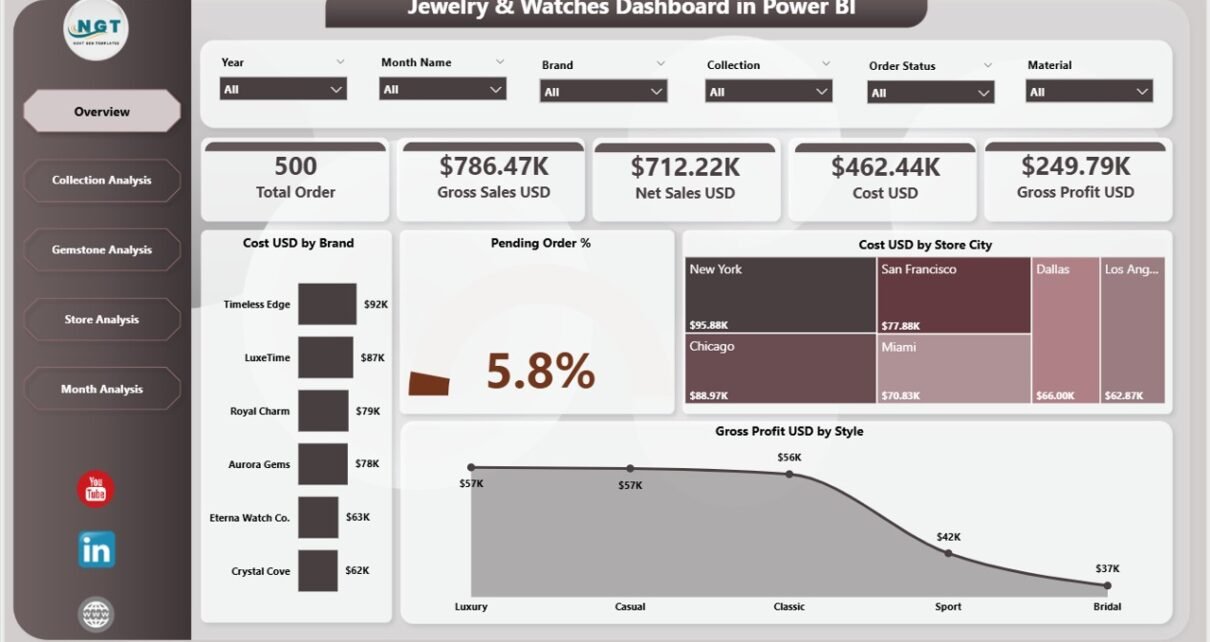
The jewellery and watches industry runs on precision, trust, and refined customer experience. Because of this, businesses in this sector depend on meaningful data that helps them understand sales patterns,
Read More
Templates

Oil & Gas KPI Dashboard in Power BI

November 29, 2025November 29, 2025 PKComments Off on Oil & Gas KPI Dashboard in Power BI
The oil and gas industry runs on complex operations, high-risk activities, heavy investments, and strict compliance rules. Because of this, companies cannot depend on slow manual reporting or scattered spreadsheets.
Read More
Dashboard Power BI

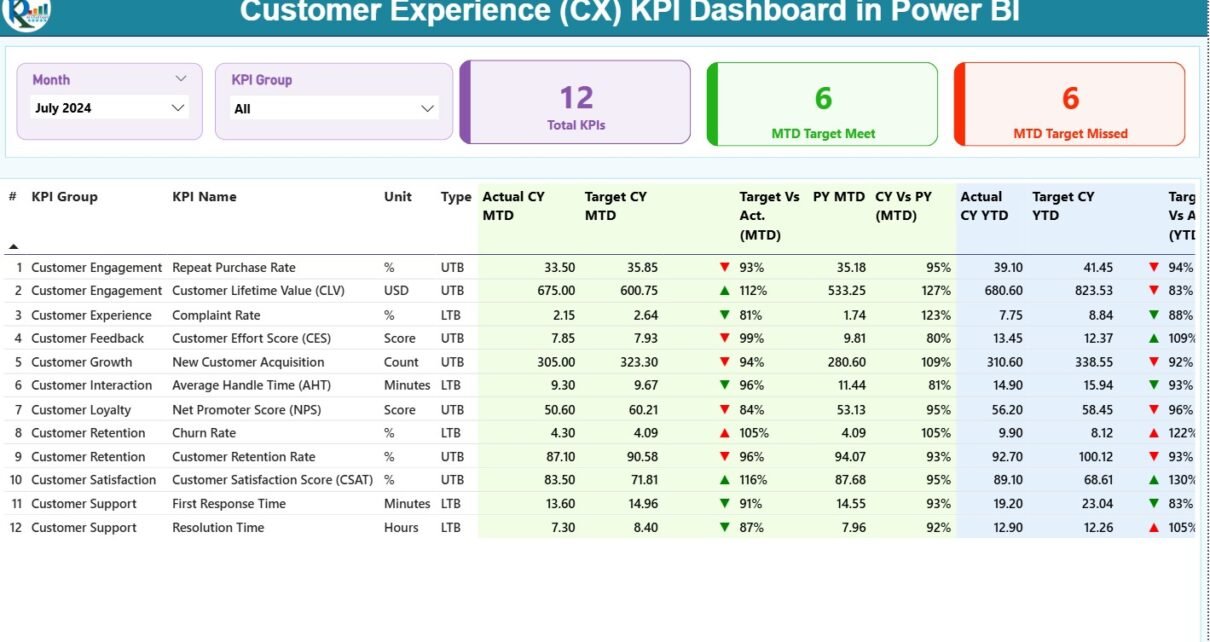
Customer Experience (CX) KPI Dashboard in Power BI

November 29, 2025November 29, 2025 PKComments Off on Customer Experience (CX) KPI Dashboard in Power BI
Customer Experience (CX) plays an important role in every business. When customers feel valued, they stay longer, spend more, and recommend your brand to others. Because of this, companies now
Read More
Dashboard Power BI

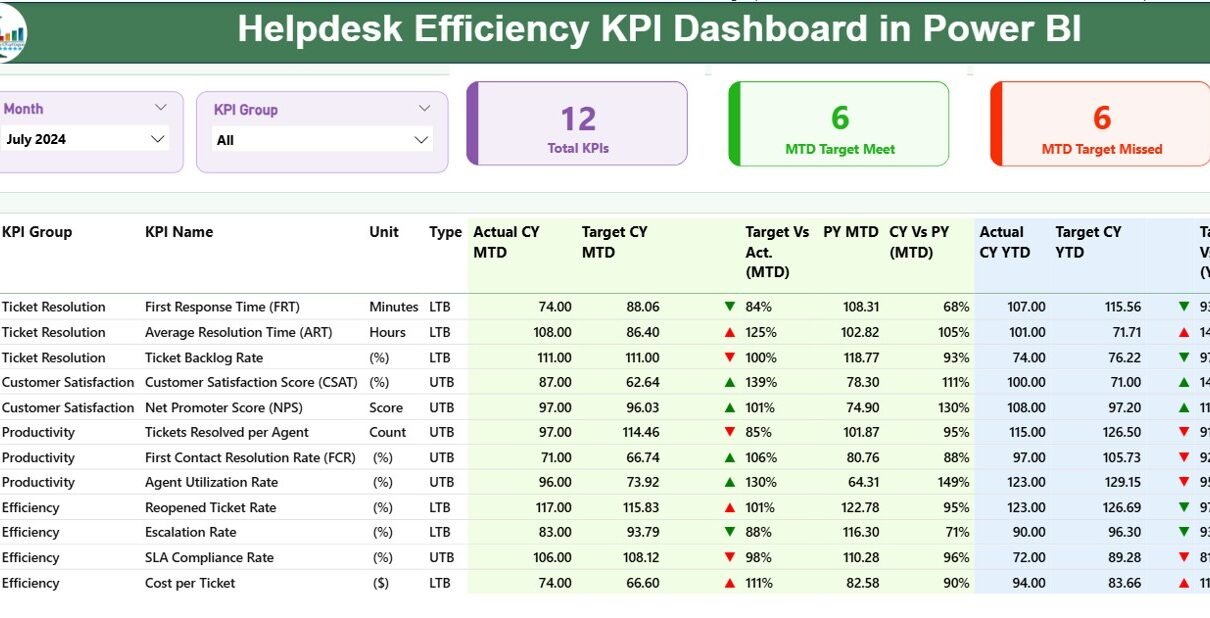
Helpdesk Efficiency KPI Dashboard in Power BI

November 29, 2025November 29, 2025 PKComments Off on Helpdesk Efficiency KPI Dashboard in Power BI
Managing a helpdesk becomes difficult when service requests grow, response times slow down, or support teams struggle with workload. However, support teams can improve their efficiency when they track each
Read More
Dashboard Power BI

Product Marketing KPI Dashboard in Power BI

November 29, 2025November 29, 2025 PKComments Off on Product Marketing KPI Dashboard in Power BI
Product marketing teams focus on one goal: drive product growth with clear insights. However, without proper metrics, teams struggle to measure performance, track results, and take quick action. Because of
Read More
Dashboard Power BI

Electronics Retail Dashboard in Power BI

November 28, 2025November 28, 2025 PKComments Off on Electronics Retail Dashboard in Power BI
Managing an electronics retail business becomes challenging because the market changes fast, customer expectations rise, and competition grows every day. You need real-time insights, quick decision-making, and a clear understanding
Read More
Dashboard Power BI

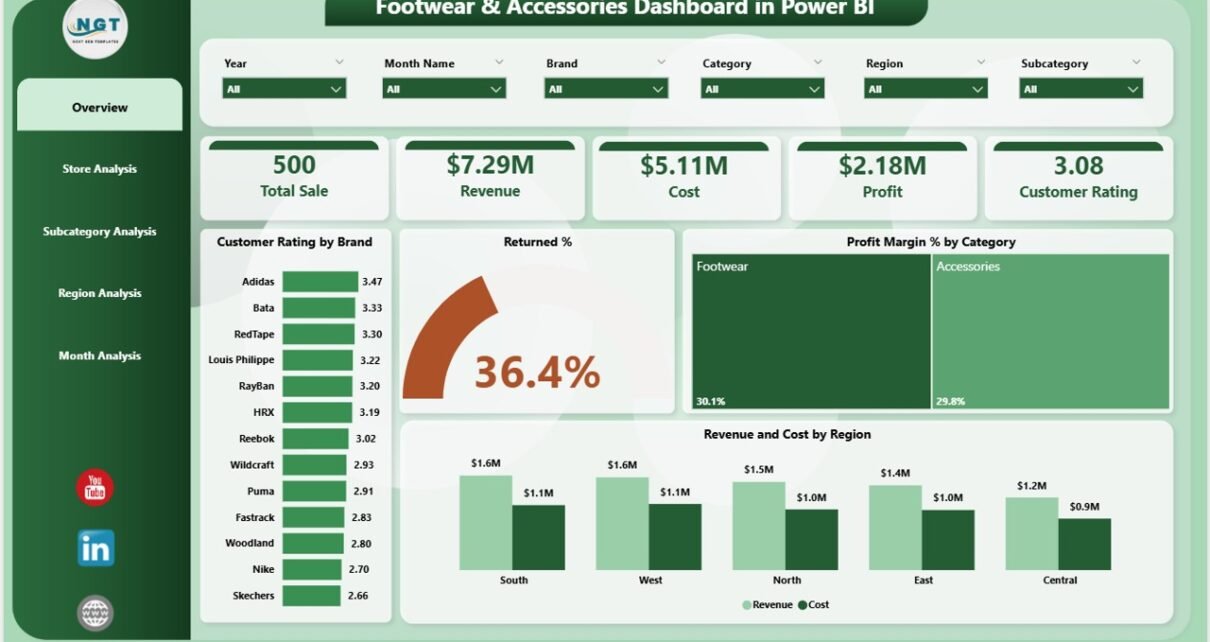
Footwear & Accessories Dashboard in Power BI

November 28, 2025November 28, 2025 PKComments Off on Footwear & Accessories Dashboard in Power BI
The footwear and accessories market grows every year. Customers want stylish shoes, durable bags, trendy belts, and many other fashion items. Because of this, retailers need the right insights to
Read More
Templates

Railways KPI Dashboard in Power BI

November 28, 2025November 28, 2025 PKComments Off on Railways KPI Dashboard in Power BI
Railway operations play a huge role in the growth of any country because people use trains every day for travel, logistics, business, and essential movement. As the demand grows, the
Read More
Dashboard Power BI

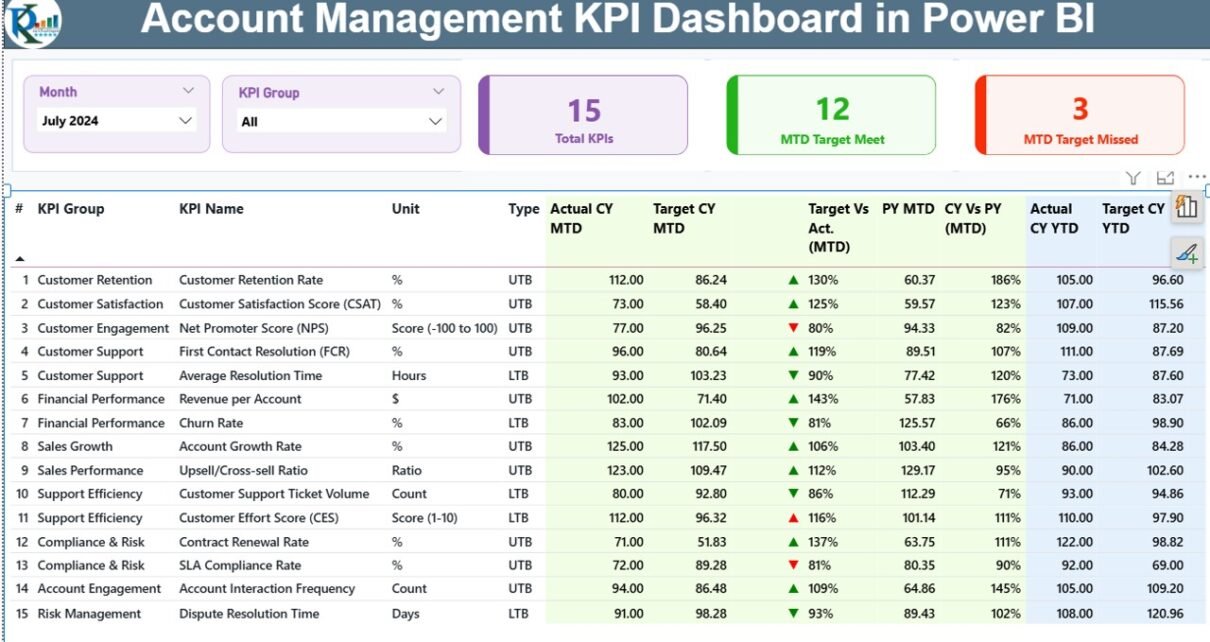
Account Management KPI Dashboard in Power BI

November 28, 2025November 28, 2025 PKComments Off on Account Management KPI Dashboard in Power BI
Monitoring account performance becomes difficult when data lives in multiple files, scattered reports, or outdated summaries. Even small account management teams handle many KPIs every month, and this often leads
Read More

Posts pagination

Previous 1 … 60 61 62 … 85 Next
  • Learn Excel (Free Course)
    • 1. Shortcut Keys
    • 2. Fill & Flash Fill
    • 3. Find & Replace
    • 4. Sort & Filter
    • 5. Formulas & Functions
    • 6. Data Validation
    • 7. Conditional Formatting
    • 8. Basic Charts
    • 9. Advanced Charts
    • 10. Pivot Tables
    • 11. Excel Dashboards
    • 12. VBA Course
    • 13. Excel Formulas with AI
  • Templates
  • Tutorials
    • Charts and Visualization
    • VBA
    • Excel Tips and Tricks
    • Excel Dashboards
    • Power Pivot & DAX
  • Power BI
  • Template Store
    • Ready to Use Templates
  • Courses
  • Academy
    • Excel + AI Mastery: 100 Formulas
    • Excel Pivot Tables & Dashboards
  • About Us
  • Contact Us
Copyright © 2023 PK-AnExcelExpert.com - Privacy Policy