New: NextGenTemplates Academy - video courses on Excel formulas with AI and Pivot Tables & dashboards. Early-bird: 20% off with code EARLYBIRD20 - first 20 orders only. See the courses →
  • Learn Excel (Free Course)
    • 1. Shortcut Keys
    • 2. Fill & Flash Fill
    • 3. Find & Replace
    • 4. Sort & Filter
    • 5. Formulas & Functions
    • 6. Data Validation
    • 7. Conditional Formatting
    • 8. Basic Charts
    • 9. Advanced Charts
    • 10. Pivot Tables
    • 11. Excel Dashboards
    • 12. VBA Course
    • 13. Excel Formulas with AI
  • Templates
  • Tutorials
    • Charts and Visualization
    • VBA
    • Excel Tips and Tricks
    • Excel Dashboards
    • Power Pivot & DAX
  • Power BI
  • Template Store
    • Ready to Use Templates
  • Courses
  • Academy
    • Excel + AI Mastery: 100 Formulas
    • Excel Pivot Tables & Dashboards
  • About Us
  • Contact Us

PK: An Excel Expert

Transforming Data into Decisions

Tag: Power BI dashboard

Templates

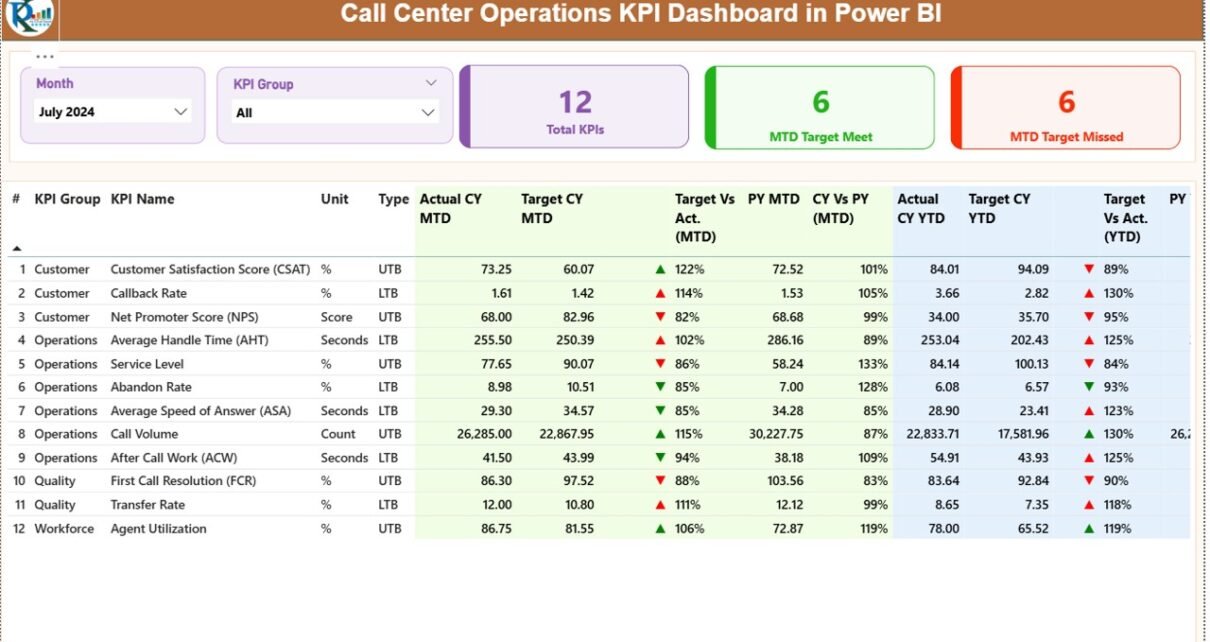
Call Center Operations KPI Dashboard in Power BI

December 1, 2025December 1, 2025 PKComments Off on Call Center Operations KPI Dashboard in Power BI
Managing a call center demands constant monitoring, fast decisions, and instant access to accurate performance data. Call volumes change every hour, customers expect quick resolutions, and managers need a real-time
Read More
Dashboard Power BI

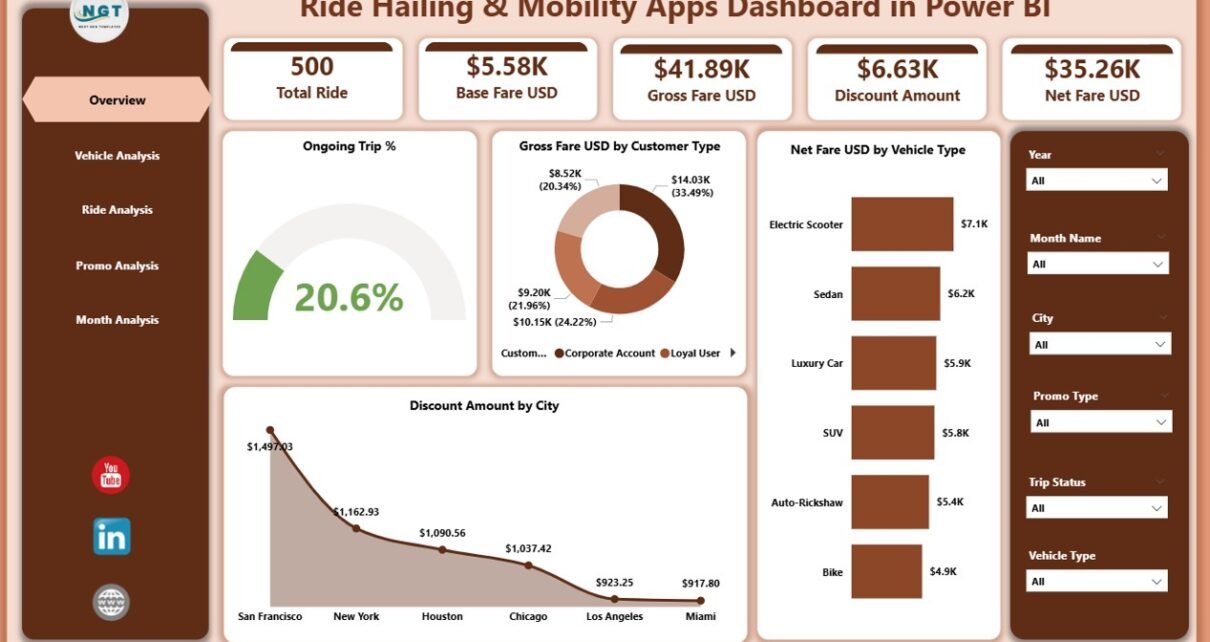
Ride Hailing & Mobility Apps Dashboard in Power BI

December 1, 2025December 1, 2025 PKComments Off on Ride Hailing & Mobility Apps Dashboard in Power BI
The ride-hailing and mobility industry grows at a fast pace, and companies need accurate insights to make smart decisions. When data spreads across different systems—such as trip logs, customer feedback,
Read More
Templates

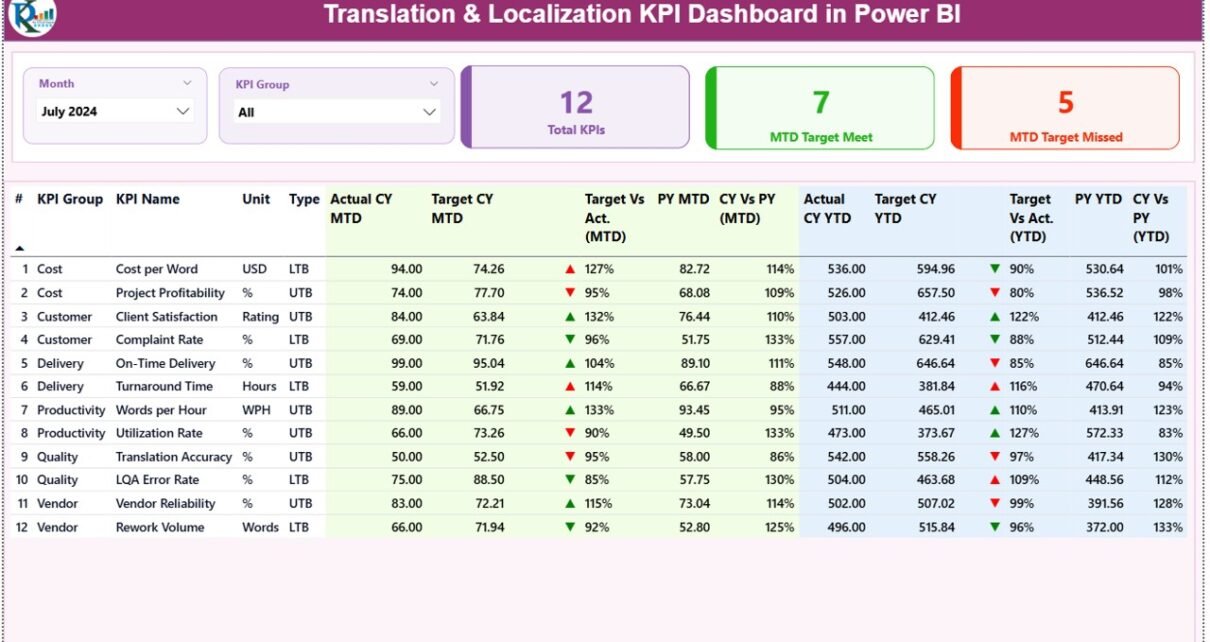
Translation & Localization KPI Dashboard in Power BI

December 1, 2025December 1, 2025 PKComments Off on Translation & Localization KPI Dashboard in Power BI
Managing translation and localization projects becomes easier when you track performance with clarity. Global companies deal with several languages, tight deadlines, skilled translators, quality standards, and fast delivery expectations. Because
Read More
Dashboard Power BI

Shipping & Cargo Dashboard in Power BI

December 1, 2025December 1, 2025 PKComments Off on Shipping & Cargo Dashboard in Power BI
Efficient shipping and cargo operations matter more than ever. Logistics companies manage thousands of shipments, multiple ports, many customer types, and a long list of operational costs. As the data
Read More
Dashboard Power BI

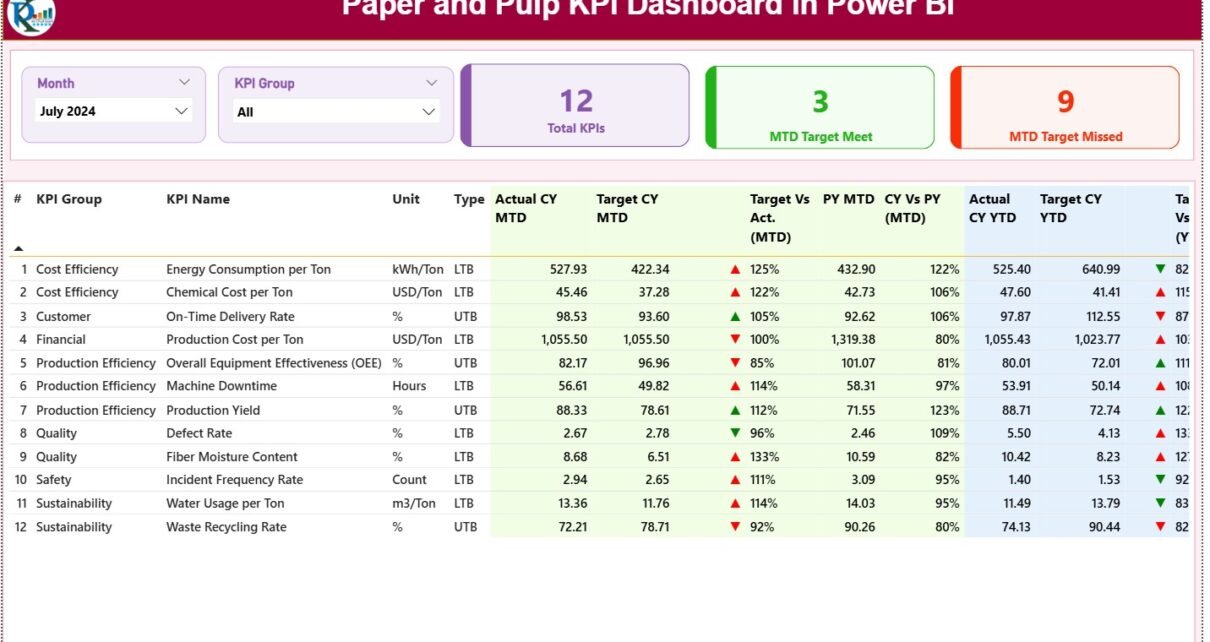
Paper and Pulp KPI Dashboard in Power BI

December 1, 2025December 1, 2025 PKComments Off on Paper and Pulp KPI Dashboard in Power BI
The paper and pulp industry runs on high production pressure, strict quality requirements, and continuous improvement. Every department works with large volumes of data—from production output and fiber loss to
Read More
Dashboard Power BI

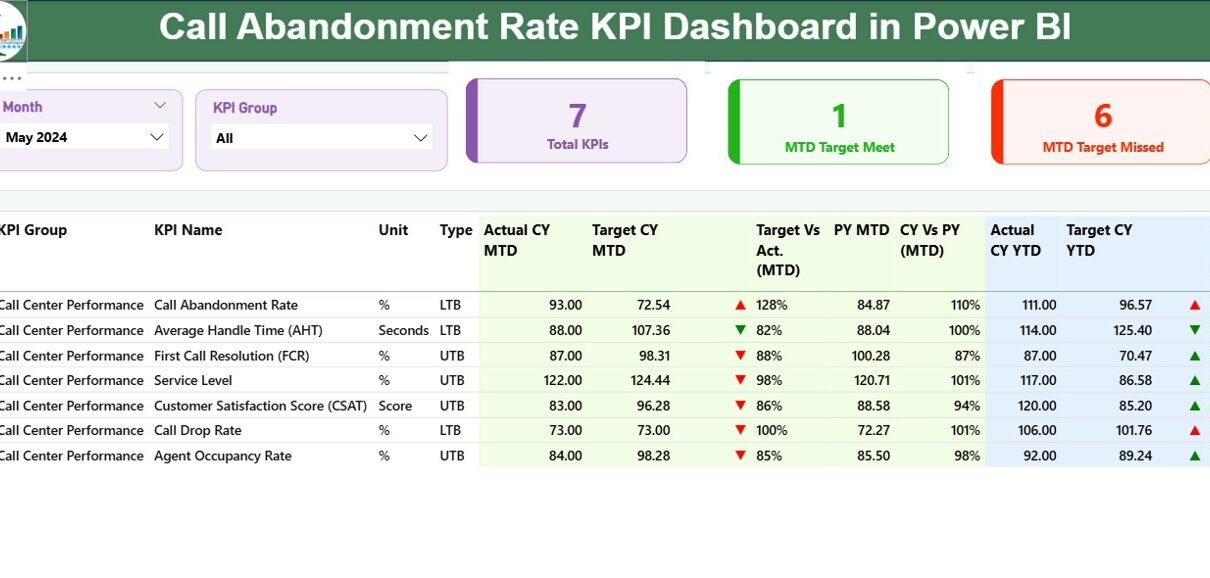
Call Abandonment Rate KPI Dashboard in Power BI

December 1, 2025December 1, 2025 PKComments Off on Call Abandonment Rate KPI Dashboard in Power BI
Call centers deal with hundreds or even thousands of customer calls every day. When the workload increases, many callers hang up before they reach an agent. This impacts customer satisfaction,
Read More
Dashboard Power BI

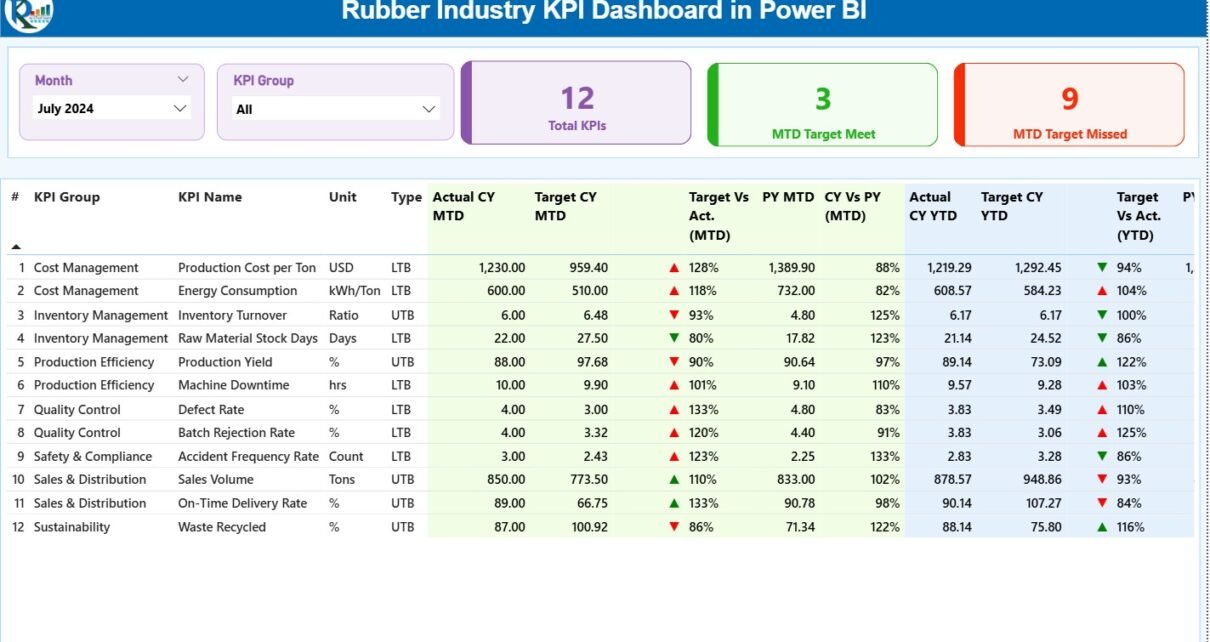
Rubber Industry KPI Dashboard in Power BI

December 1, 2025December 1, 2025 PKComments Off on Rubber Industry KPI Dashboard in Power BI
The rubber manufacturing industry runs on speed, accuracy, and continuous improvement. Production teams try to increase throughput, quality teams need to control defects, maintenance teams monitor machine health, and management
Read More
Templates

Textiles & Apparel Manufacturing KPI Dashboard in Power BI

November 30, 2025November 30, 2025 PKComments Off on Textiles & Apparel Manufacturing KPI Dashboard in Power BI
The textiles and apparel industry moves quickly and demands accurate decisions at every stage. Production teams try to meet deadlines, quality teams monitor defects, and management expects real-time performance updates.
Read More
Dashboard Power BI

Sovereign Wealth Funds Dashboard in Power BI

November 29, 2025November 29, 2025 PKComments Off on Sovereign Wealth Funds Dashboard in Power BI
Global markets move fast, and investment managers need accurate insights at the right time. Sovereign wealth funds (SWFs) deal with billions of dollars, long-term strategies, and complex portfolios spread across
Read More
Dashboard Power BI

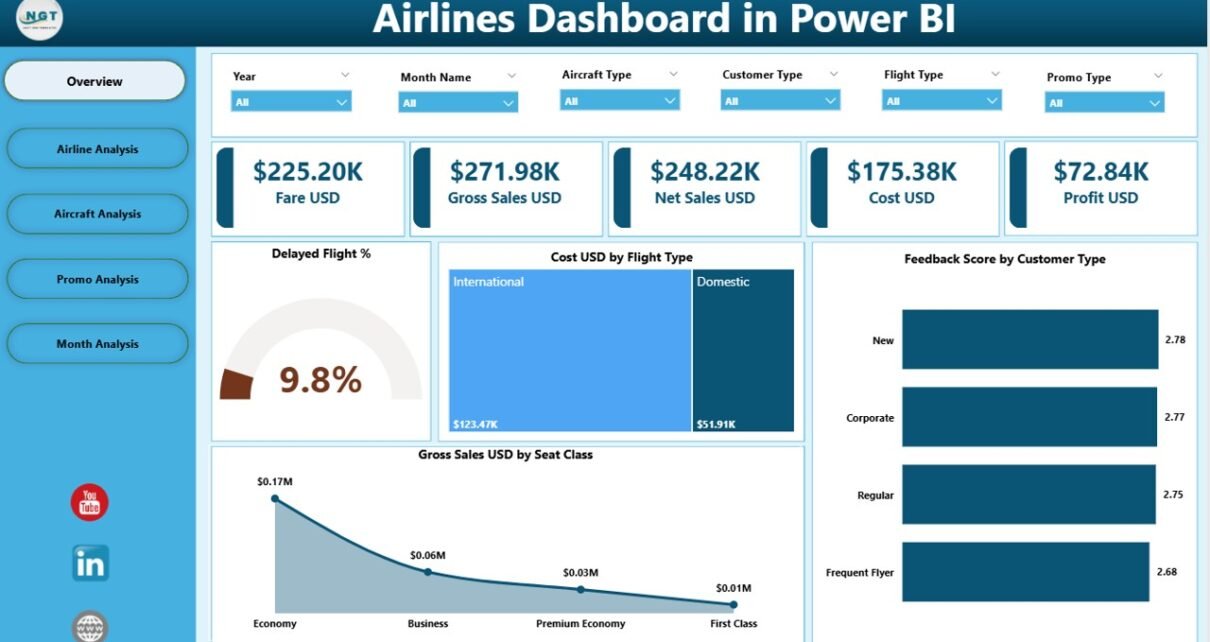
Airlines Dashboard in Power BI

November 29, 2025November 29, 2025 PKComments Off on Airlines Dashboard in Power BI
Airlines operate in one of the most competitive and fast-changing industries in the world. Every day, thousands of flights take off and land across continents, carrying millions of passengers. Because
Read More

Posts pagination

Previous 1 … 59 60 61 … 85 Next
  • Learn Excel (Free Course)
    • 1. Shortcut Keys
    • 2. Fill & Flash Fill
    • 3. Find & Replace
    • 4. Sort & Filter
    • 5. Formulas & Functions
    • 6. Data Validation
    • 7. Conditional Formatting
    • 8. Basic Charts
    • 9. Advanced Charts
    • 10. Pivot Tables
    • 11. Excel Dashboards
    • 12. VBA Course
    • 13. Excel Formulas with AI
  • Templates
  • Tutorials
    • Charts and Visualization
    • VBA
    • Excel Tips and Tricks
    • Excel Dashboards
    • Power Pivot & DAX
  • Power BI
  • Template Store
    • Ready to Use Templates
  • Courses
  • Academy
    • Excel + AI Mastery: 100 Formulas
    • Excel Pivot Tables & Dashboards
  • About Us
  • Contact Us
Copyright © 2023 PK-AnExcelExpert.com - Privacy Policy