The rubber manufacturing industry runs on speed, accuracy, and continuous improvement. Production teams try to increase throughput, quality teams need to control defects, maintenance teams monitor machine health, and management demands real-time visibility. When data stays scattered in spreadsheets, emails, or disconnected systems, decision-making slows down.
A Rubber Industry KPI Dashboard in Power BI solves this challenge with a clean, interactive, and automated reporting system. It brings all KPIs into one place so leaders can track performance with clarity. In this in-depth guide, you will learn everything about this dashboard, its features, advantages, and best practices.
Click to Purchases Rubber Industry KPI Dashboard in Power BI
What Is a Rubber Industry KPI Dashboard in Power BI?
A Rubber Industry KPI Dashboard in Power BI tracks all key performance indicators related to production, quality, efficiency, cost, and supply chain in rubber manufacturing. It converts raw Excel data into interactive insights. Because of this, teams gain real-time visibility into their operations and make decisions confidently.
This dashboard captures actual values, targets, month-to-date (MTD) numbers, year-to-date (YTD) performance, and last year comparisons. It also highlights trends, achievements, and gaps. With a few clicks, manufacturers understand how their KPIs behave during different time periods.
You do not need any coding knowledge. You only fill the Excel-based data source, and Power BI updates the visuals instantly. This makes the dashboard easy for production managers, quality heads, maintenance leaders, and finance teams.
Click to Purchases Rubber Industry KPI Dashboard in Power BI
Why Do Rubber Manufacturers Need a KPI Dashboard?
Rubber production involves multiple steps: mixing, extrusion, molding, curing, trimming, inspection, dispatch, and much more. Each step produces data, but without structure, this data becomes overwhelming.
A KPI dashboard creates a single version of truth so every department stays aligned. As a result, companies avoid delays, improve quality, reduce cost, and enhance productivity.
Some common challenges it solves:
Teams rely on manual Excel reports
Managers do not get real-time updates
Data entry takes too much time
Quality issues take too long to appear
Production delays remain hidden
Decision-making suffers due to poor transparency
A Power BI dashboard removes all these issues and shifts the entire workflow into a modern analytical environment.
Key Features of the Rubber Industry KPI Dashboard in Power BI
This dashboard includes 3 main pages inside the Power BI file. Each page gives deep insights while keeping the visuals simple and easy to interpret.
1. Summary Page – Your Central Control Panel
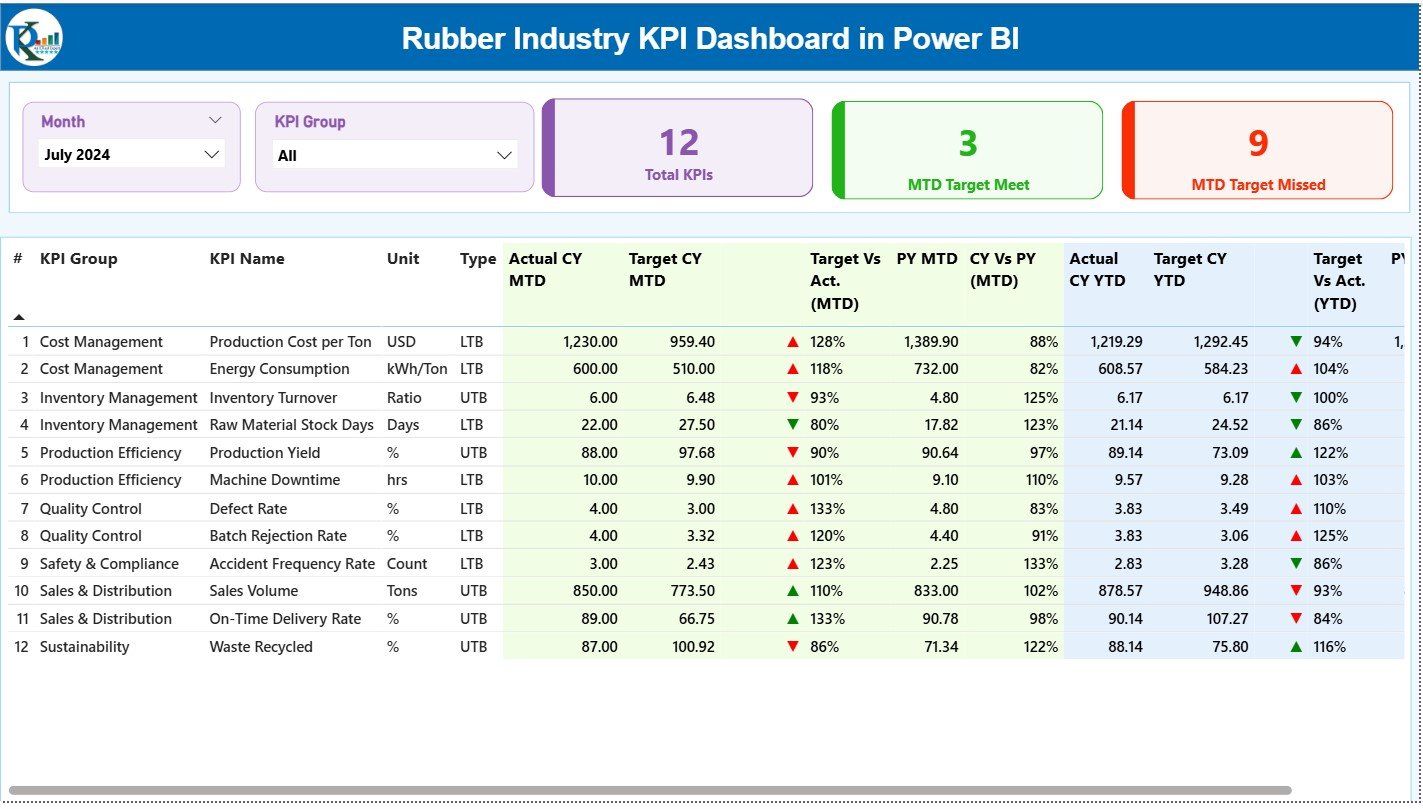
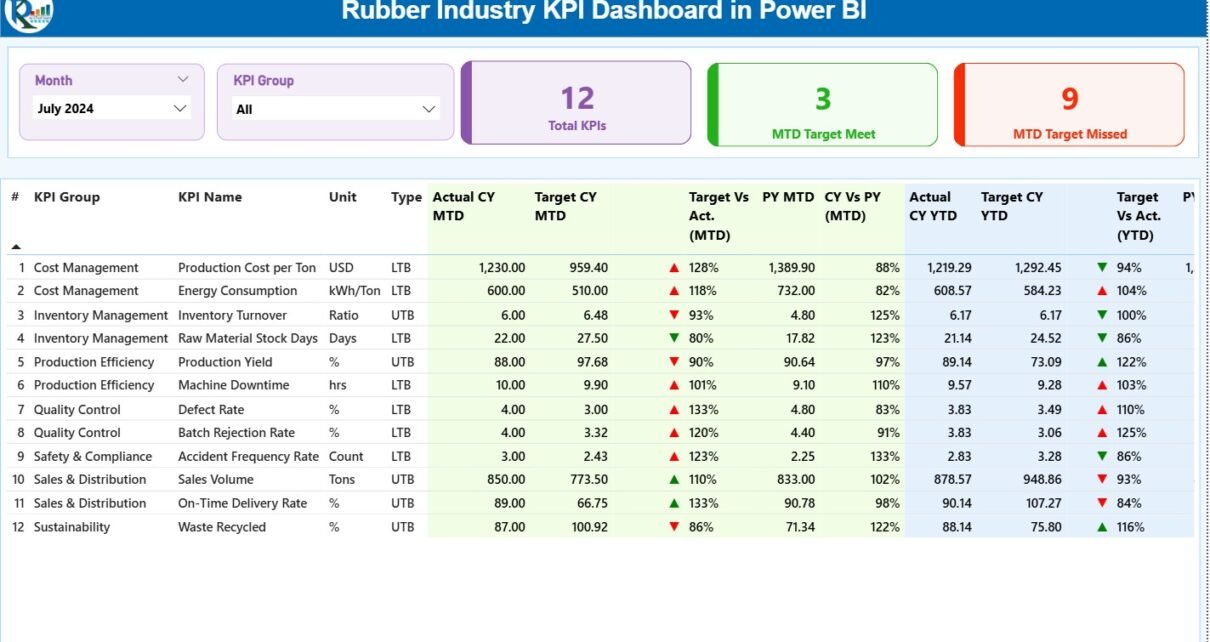
The Summary Page provides a complete monthly and YTD performance snapshot. It acts as the home page of the dashboard where decision-makers find all KPI insights quickly.
Top Section: Slicers that Filter Data Instantly
Month selector
KPI Group selector
Users select a month or KPI group and see only the relevant performance metrics. This makes analysis faster and more focused.
Performance Cards
The page shows three high-level performance cards:
Total KPIs Count
MTD Target Met
MTD Target Missed
These cards quickly reveal how well the organization performs for the selected period.
Detailed KPI Table
The lower section shows a detailed, clean, and well-structured KPI table with the following fields:
KPI Number: Sequence number of the KPI
KPI Group: Category like Production, Quality, Efficiency, Maintenance, or Cost
KPI Name: Name of the KPI
Unit: Measurement unit (Kg, %, Nos, Hours, etc.)
Type: LTB (Lower the Better) or UTB (Upper the Better)
Actual CY MTD: Actual Month-to-Date number
Target CY MTD: Target Month-to-Date number
MTD Icon: Green ▲ or Red ▼ icon to show status
Target vs Actual (MTD): % comparison using Actual ÷ Target
PY MTD: Previous Year Month-to-Date
CY vs PY (MTD): % comparison of current MTD vs last year
Actual CY YTD: Current Year YTD number
Target CY YTD: Current Year Target YTD number
YTD Icon: Green ▲ or Red ▼ for YTD performance
Target vs Actual (YTD): Actual ÷ Target formula
PY YTD: Last year YTD
CY vs PY (YTD): Performance against last year’s YTD number
This page offers a full 360-degree KPI view for both MTD and YTD periods so leaders see what improves and what needs correction.
Click to Purchases Rubber Industry KPI Dashboard in Power BI
2. KPI Trend Page – Visual Performance Comparison
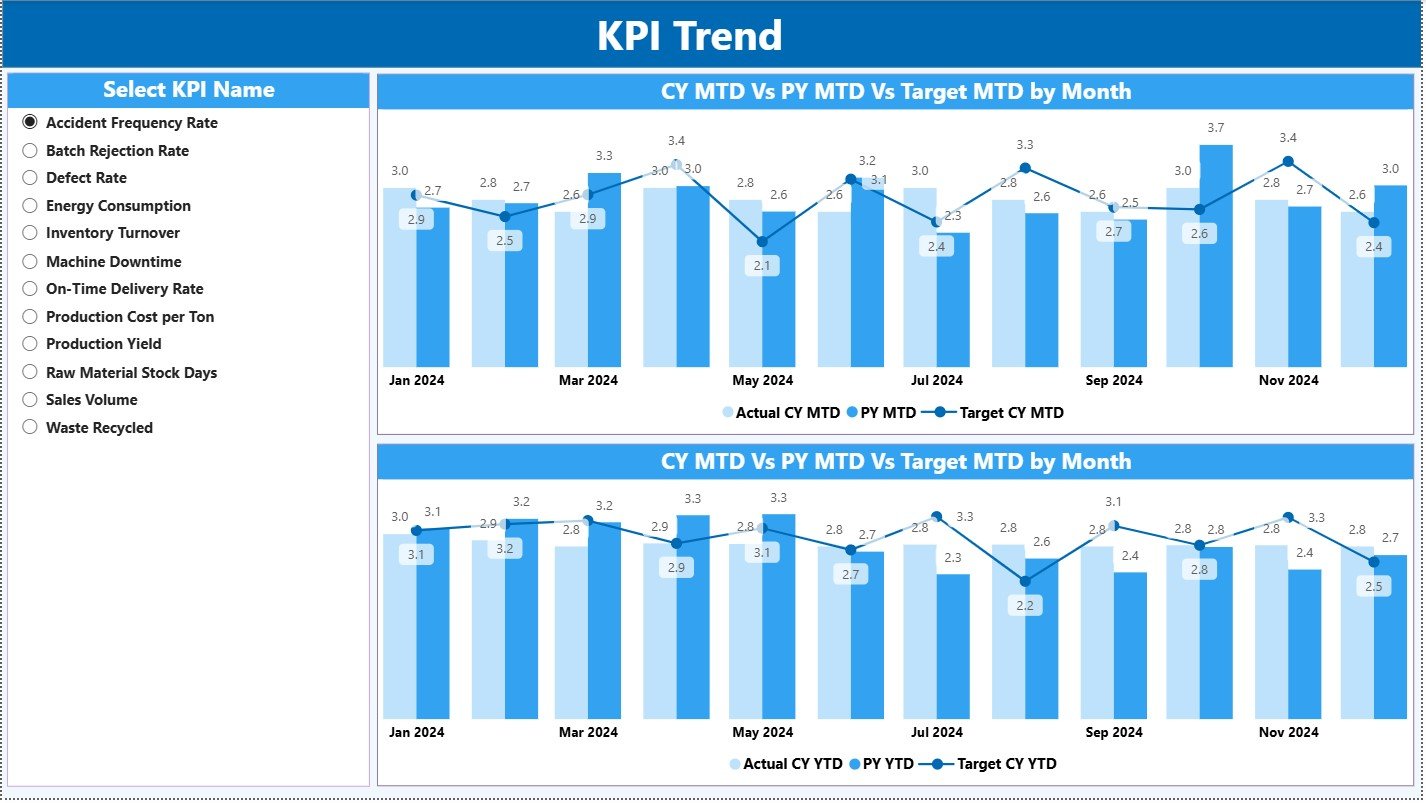
The Trends Page shows comparison charts for deep analysis.
Left-Side KPI Slicer
Users pick any KPI to view its trend. This lets teams examine individual KPIs one by one.
Two Combo Charts:
MTD Trend Combo Chart
Actual Current Year
Previous Year
Target
YTD Trend Combo Chart
Actual Current Year
Previous Year
Target
These charts help teams analyze progress, seasonality, performance gaps, and target alignment.
For example:
If “Material Yield %” declines over months, managers act quickly.
If “Machine Downtime” increases during weekends, maintenance teams plan preventive actions.
This page makes trends visible so problems never remain hidden.
3. KPI Definition Page – Drill-Through Information
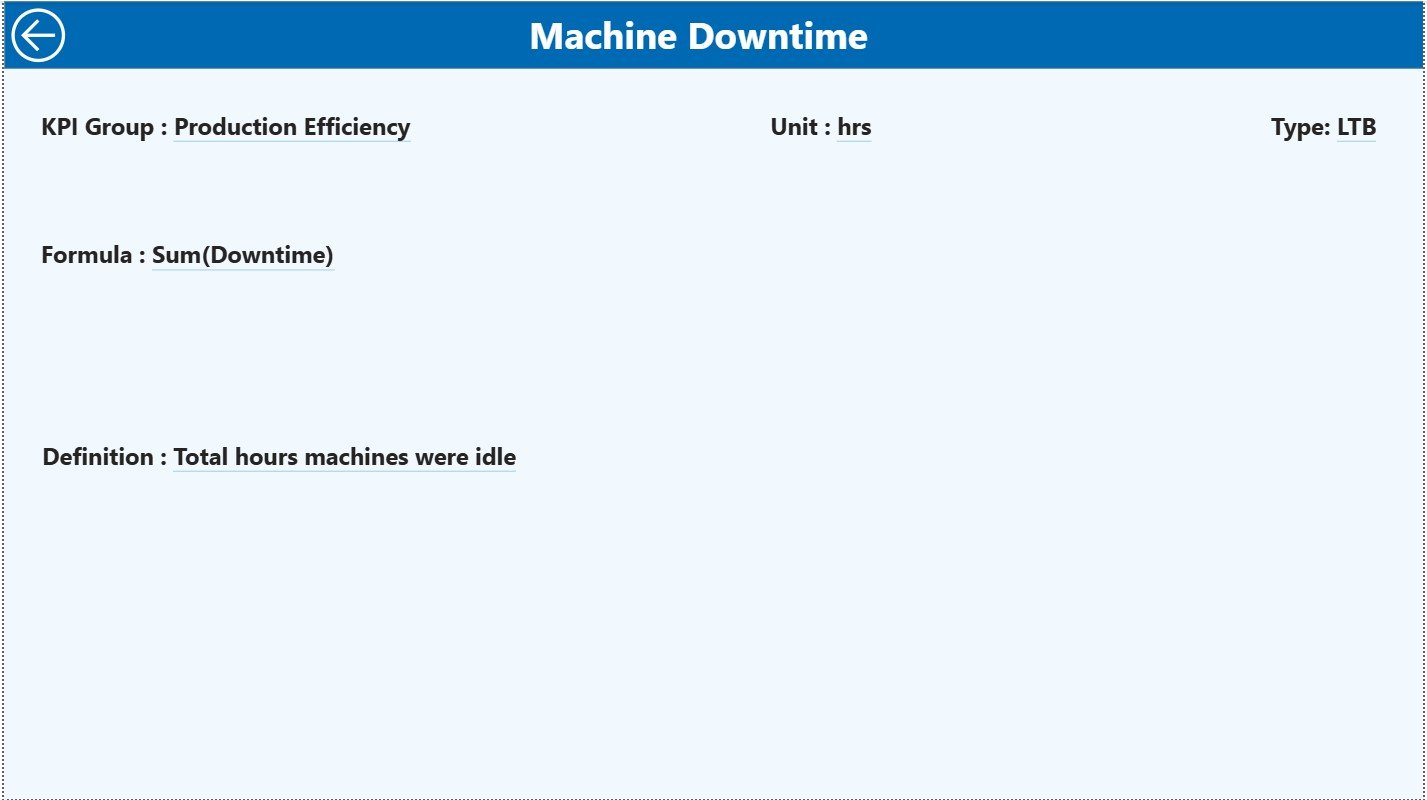
The KPI Definition Page stays hidden and appears only when users drill through from the Summary Page.
This page shows:
KPI Number
KPI Group
KPI Name
Unit
Formula used
KPI Definition
Type (UTB or LTB)
This page ensures complete transparency. Any employee understands each KPI’s meaning, calculation, and purpose.
A Back button on the top left helps users return to the Summary Page effortlessly.
Excel Data Source – Easy to Use and Maintain
The dashboard becomes powerful because the Excel file structure remains simple and clean. Users only fill three worksheets:
1. Input_Actual Sheet
Fill the following values:
KPI Name
Month (use first date of each month)
MTD Actual
YTD Actual
Since the data stays structured, Power BI loads it smoothly.
2. Input_Target Sheet
Fill:
KPI Name
Month
MTD Target
YTD Target
This sheet compares goals with actual numbers instantly.
3. KPI Definition Sheet
Fill static information like:
KPI Number
KPI Group
KPI Name
Unit
Formula
Definition
Type (LTB or UTB)
This sheet feeds the drill-through page.
Click to Purchases Rubber Industry KPI Dashboard in Power BI
What KPIs Should Rubber Manufacturers Track?
A rubber factory handles many processes, so KPIs must stay organized.
Production KPIs
Mixing Output (Kg)
Curing Cycle Time
Overall Equipment Efficiency (OEE)
Scrap %
Material Yield %
Quality KPIs
Rejection Rate
Customer Complaint Count
Defect per Batch
In-Process Defect Ratio
Maintenance KPIs
Machine Downtime Hours
MTTR – Mean Time to Repair
MTBF – Mean Time Between Failures
Cost KPIs
Cost per Kg
Energy Consumption
Material Cost Variance
Supply Chain KPIs
On-Time Delivery
Stock Turnover
Inventory Days
This dashboard supports all these KPIs and more.
Click to Purchases Rubber Industry KPI Dashboard in Power BI
Advantages of Rubber Industry KPI Dashboard in Power BI
A dashboard becomes meaningful only when it creates real improvements. This dashboard delivers many advantages that directly impact productivity, quality, and cost control.
1. You Get Full Visibility of Operations
The dashboard brings all data from production, quality, supply chain, and maintenance into one place. Managers do not wait for reports. They see live insights and act fast.
2. You Reduce Manual Work
Teams waste time creating Excel reports. With Power BI automation, reports update with one refresh. Users only update the Excel file; Power BI handles the rest.
3. You Improve KPI Tracking Accuracy
The dashboard calculates:
- Target vs Actual
- MTD vs PY
- YTD vs PY
- Trend analyses
This improves accuracy and avoids human errors.
4. You Detect Problems Early
Trend charts reveal performance dips. KPI icons highlight deviations. This helps teams take action before issues grow bigger.
5. You Make Better Decisions
With real-time insights and clean visuals, management responds faster. Better decisions lead to better output, quality, and profitability.
6. You Improve Communication Across Teams
Everyone sees the same numbers. This improves alignment between:
- Production
- Quality
- Procurement
- Maintenance
- Management
Clear data improves teamwork.
7. You Boost Productivity and Reduce Cost
When problems become visible, teams fix them quickly. This boosts productivity and cuts unnecessary costs.
Click to Purchases Rubber Industry KPI Dashboard in Power BI
How Does the Dashboard Improve the Rubber Manufacturing Workflow?
1. Operations Team
Tracks production, yield, cycle time, and downtime.
2. Quality Team
Monitors defects, customer complaints, and rejection trends.
3. Maintenance Team
Analyzes downtime, MTTR, and failure rates.
4. Management
Evaluates performance by month, year, and target comparison.
This creates a smooth workflow where decisions happen quickly.
Best Practices for Using a Rubber Industry KPI Dashboard in Power BI
To get maximum value from your dashboard, follow these best practices:
1. Keep KPI Definitions Simple
Write formulas in simple language so every employee understands the KPI.
2. Update Data Regularly
Fill the Excel sheets daily, weekly, or monthly based on your process. Consistent updates ensure accurate dashboards.
3. Use Targets That Reflect Reality
Set achievable targets based on historic data and capacity.
4. Use Colors With Meaning
Green means success
Red means deviation
This improves visualization clarity.
5. Focus on Few, High-Value KPIs
Do not overload the dashboard. Choose KPIs that drive improvement.
6. Review Trends Often
Monthly and YTD trends reveal performance shifts. Use them to plan corrective actions.
7. Train Your Team
Train teams to understand the dashboard so decisions stay data-driven.
Conclusion
A Rubber Industry KPI Dashboard in Power BI brings complete visibility, real-time insights, and structured analytics to rubber manufacturers. It transforms scattered data into actionable information so teams improve production, quality, efficiency, and cost performance. When companies adopt this dashboard, they move faster, reduce delays, and improve their decision-making structure.
With powerful visuals, automated calculations, easy drill-through views, and trend analysis, this dashboard becomes a must-have digital tool for every rubber manufacturing plant.
Click to Purchases Rubber Industry KPI Dashboard in Power BI
Frequently Asked Questions (FAQs)
1. Why should rubber manufacturers use a Power BI KPI Dashboard?
Because it gives real-time insights, reduces manual work, improves visibility, and supports fast decision-making.
2. How often should I update the Excel data?
Update it based on your operational needs—daily, weekly, or monthly—to keep the dashboard accurate.
3. Can I add more KPIs to the dashboard?
Yes. You can add more KPIs by updating the Excel sheets and adjusting visuals.
4. Do I need Power BI expertise to use this dashboard?
No. Basic Power BI usage is enough. You only fill the Excel file, and the dashboard updates automatically.
5. What KPIs are most important in the rubber industry?
Production yield, machine downtime, scrap %, defects, energy cost, and OEE are the most common.
Click to Purchases Rubber Industry KPI Dashboard in Power BI
Visit our YouTube channel to learn step-by-step video tutorials