New: NextGenTemplates Academy - video courses on Excel formulas with AI and Pivot Tables & dashboards. Early-bird: 20% off with code EARLYBIRD20 - first 20 orders only. See the courses →
  • Learn Excel (Free Course)
    • 1. Shortcut Keys
    • 2. Fill & Flash Fill
    • 3. Find & Replace
    • 4. Sort & Filter
    • 5. Formulas & Functions
    • 6. Data Validation
    • 7. Conditional Formatting
    • 8. Basic Charts
    • 9. Advanced Charts
    • 10. Pivot Tables
    • 11. Excel Dashboards
    • 12. VBA Course
    • 13. Excel Formulas with AI
  • Templates
  • Tutorials
    • Charts and Visualization
    • VBA
    • Excel Tips and Tricks
    • Excel Dashboards
    • Power Pivot & DAX
  • Power BI
  • Template Store
    • Ready to Use Templates
  • Courses
  • Academy
    • Excel + AI Mastery: 100 Formulas
    • Excel Pivot Tables & Dashboards
  • About Us
  • Contact Us

PK: An Excel Expert

Transforming Data into Decisions

Tag: Power BI reports

Dashboard Power BI

Loan Portfolio KPI Dashboard in Power BI

December 11, 2025December 11, 2025 PKComments Off on Loan Portfolio KPI Dashboard in Power BI
Managing a loan portfolio becomes harder every year. Competition rises, credit risk changes fast, customers expect quick decisions, and leadership demands accurate performance insights. Because of these challenges, financial institutions
Read More
Dashboard Power BI

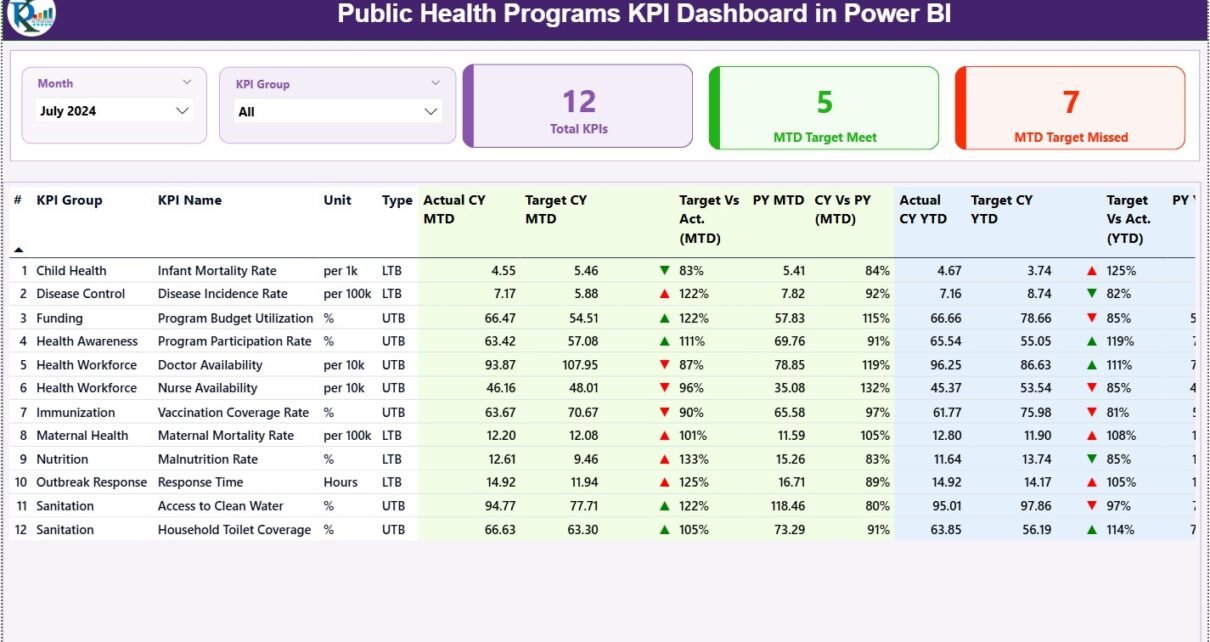
Public Health Programs KPI Dashboard in Power BI

December 10, 2025December 10, 2025 PKComments Off on Public Health Programs KPI Dashboard in Power BI
Managing public health programs without accurate performance tracking often leads to delayed interventions, inefficient resource allocation, and poor outcomes. Therefore, public health organizations increasingly rely on dashboards that convert complex
Read More
Dashboard Power BI

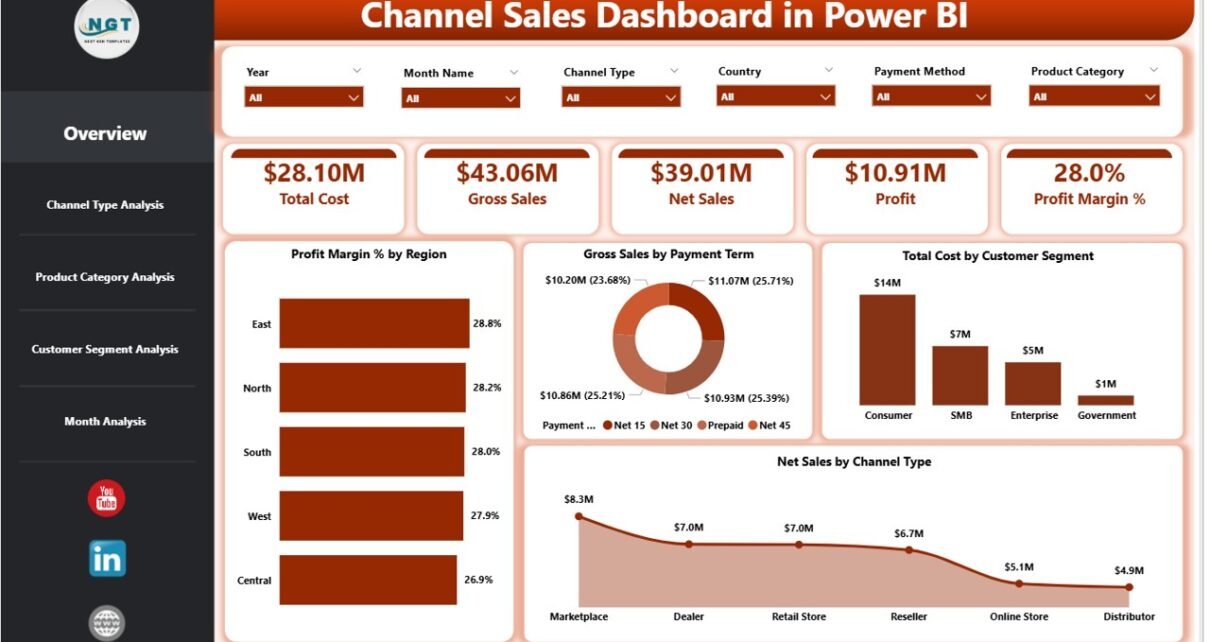
Channel Sales Dashboard in Power BI

December 9, 2025December 9, 2025 PKComments Off on Channel Sales Dashboard in Power BI
In today’s competitive business environment, companies depend heavily on indirect and multi-channel sales models. Because organizations sell through distributors, partners, resellers, and direct channels, tracking performance becomes complex and time-consuming.
Read More
Dashboard Power BI

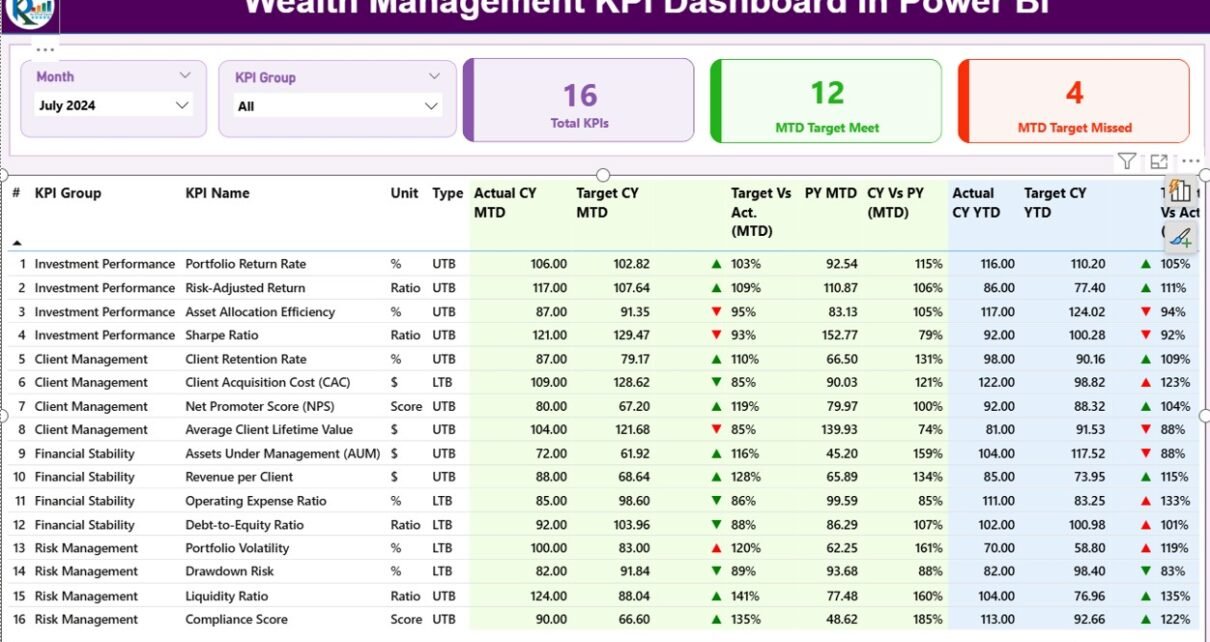
Wealth Management KPI Dashboard in Power BI

December 9, 2025December 9, 2025 PKComments Off on Wealth Management KPI Dashboard in Power BI
A Wealth Management KPI Dashboard in Power BI is a ready-to-use, interactive performance monitoring tool designed specifically for wealth managers, investment firms, private banks, and financial advisors. It helps decision-makers
Read More
Power BI

Tax Advisory KPI Dashboard in Power BI

December 7, 2025December 7, 2025 PKComments Off on Tax Advisory KPI Dashboard in Power BI
Managing tax advisory services demands accuracy, speed, and constant performance tracking. However, many tax firms still rely on scattered Excel files, manual reports, and delayed reviews. As a result, decision-makers
Read More
Dashboard Power BI

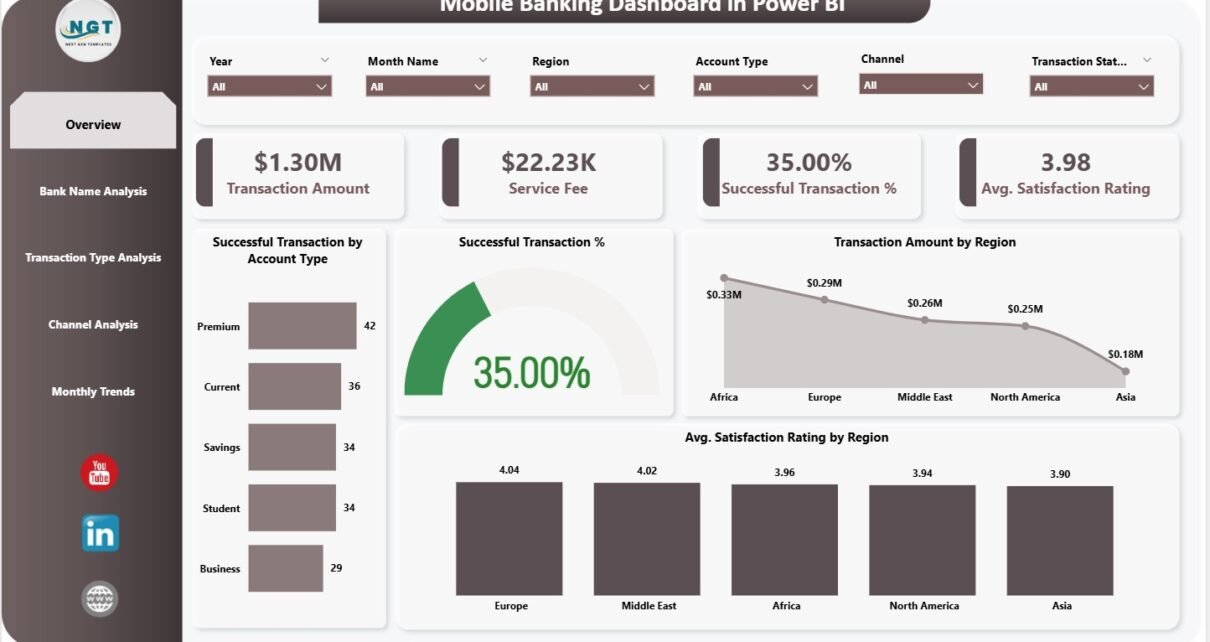
Mobile Banking Dashboard in Power BI

December 2, 2025December 2, 2025 PKComments Off on Mobile Banking Dashboard in Power BI
The mobile banking industry grows rapidly as customers demand faster, safer, and more convenient digital services. Every minute, thousands of transactions move through mobile banking apps—payments, transfers, bill settlements, deposits,
Read More
Dashboard Power BI

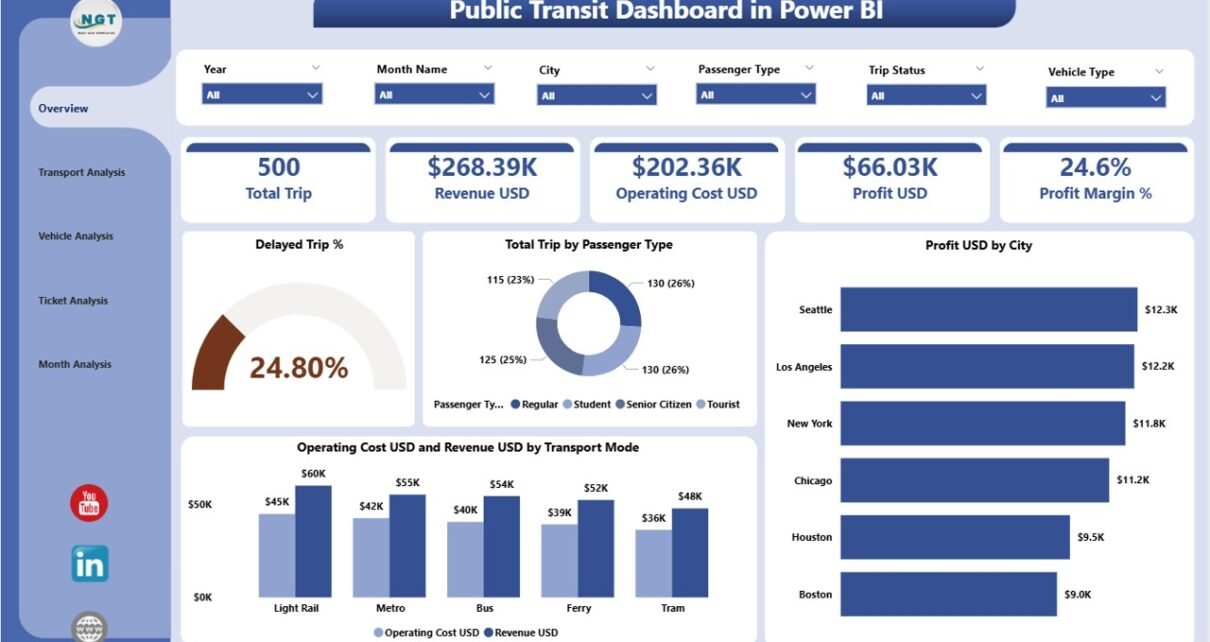
Public Transit Dashboard in Power BI

December 2, 2025December 2, 2025 PKComments Off on Public Transit Dashboard in Power BI
Public transportation systems play a big role in supporting modern cities. As more people depend on buses, trains, metros, ferries, and other transport modes, city authorities and transit operators need
Read More
Templates

Cleaning Services KPI Dashboard in Power BI

November 30, 2025November 30, 2025 PKComments Off on Cleaning Services KPI Dashboard in Power BI
Cleaning companies work in a fast and demanding environment. Every day, teams try to complete scheduled tasks, meet client standards, control costs, and maintain staff performance. Because so much happens
Read More
Dashboard Power BI

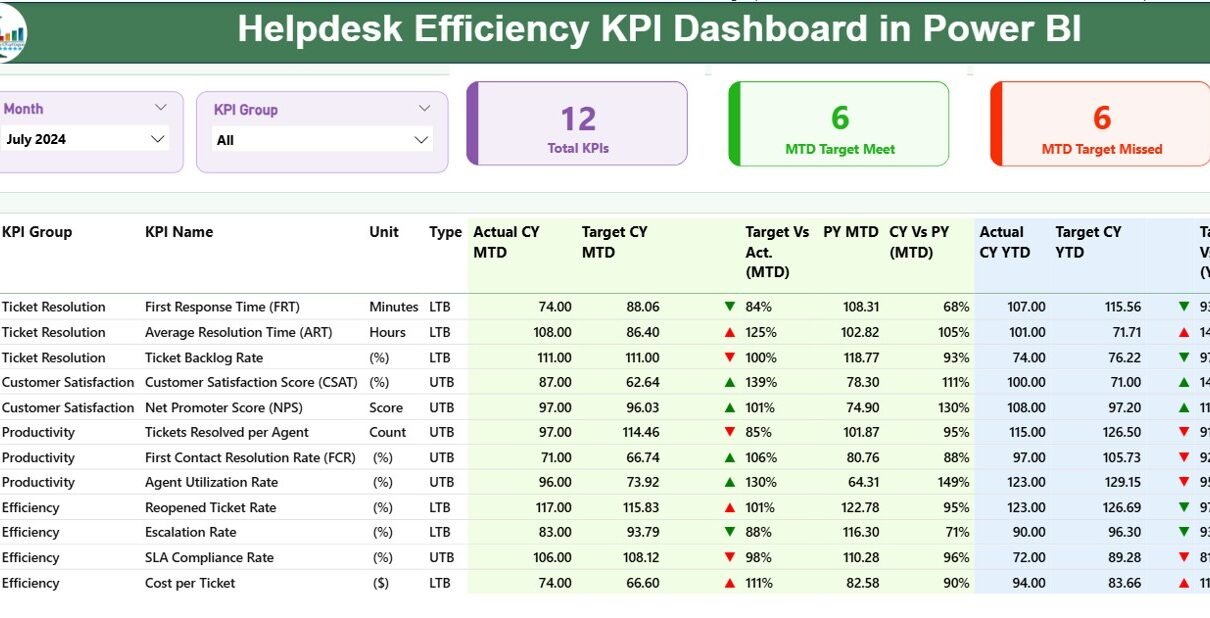
Helpdesk Efficiency KPI Dashboard in Power BI

November 29, 2025November 29, 2025 PKComments Off on Helpdesk Efficiency KPI Dashboard in Power BI
Managing a helpdesk becomes difficult when service requests grow, response times slow down, or support teams struggle with workload. However, support teams can improve their efficiency when they track each
Read More
Dashboard Power BI

Product Marketing KPI Dashboard in Power BI

November 29, 2025November 29, 2025 PKComments Off on Product Marketing KPI Dashboard in Power BI
Product marketing teams focus on one goal: drive product growth with clear insights. However, without proper metrics, teams struggle to measure performance, track results, and take quick action. Because of
Read More

Posts pagination

Previous 1 … 9 10 11 … 13 Next
  • Learn Excel (Free Course)
    • 1. Shortcut Keys
    • 2. Fill & Flash Fill
    • 3. Find & Replace
    • 4. Sort & Filter
    • 5. Formulas & Functions
    • 6. Data Validation
    • 7. Conditional Formatting
    • 8. Basic Charts
    • 9. Advanced Charts
    • 10. Pivot Tables
    • 11. Excel Dashboards
    • 12. VBA Course
    • 13. Excel Formulas with AI
  • Templates
  • Tutorials
    • Charts and Visualization
    • VBA
    • Excel Tips and Tricks
    • Excel Dashboards
    • Power Pivot & DAX
  • Power BI
  • Template Store
    • Ready to Use Templates
  • Courses
  • Academy
    • Excel + AI Mastery: 100 Formulas
    • Excel Pivot Tables & Dashboards
  • About Us
  • Contact Us
Copyright © 2023 PK-AnExcelExpert.com - Privacy Policy