New: NextGenTemplates Academy - video courses on Excel formulas with AI and Pivot Tables & dashboards. Early-bird: 20% off with code EARLYBIRD20 - first 20 orders only. See the courses →
  • Learn Excel (Free Course)
    • 1. Shortcut Keys
    • 2. Fill & Flash Fill
    • 3. Find & Replace
    • 4. Sort & Filter
    • 5. Formulas & Functions
    • 6. Data Validation
    • 7. Conditional Formatting
    • 8. Basic Charts
    • 9. Advanced Charts
    • 10. Pivot Tables
    • 11. Excel Dashboards
    • 12. VBA Course
    • 13. Excel Formulas with AI
  • Templates
  • Tutorials
    • Charts and Visualization
    • VBA
    • Excel Tips and Tricks
    • Excel Dashboards
    • Power Pivot & DAX
  • Power BI
  • Template Store
    • Ready to Use Templates
  • Courses
  • Academy
    • Excel + AI Mastery: 100 Formulas
    • Excel Pivot Tables & Dashboards
  • About Us
  • Contact Us

PK: An Excel Expert

Transforming Data into Decisions
Tag: Power BI reports

Templates

Railways KPI Dashboard in Power BI

November 28, 2025November 28, 2025 PKComments Off on Railways KPI Dashboard in Power BI
Railway operations play a huge role in the growth of any country because people use trains every day for travel, logistics, business, and essential movement. As the demand grows, the
Read More
Dashboard Power BI

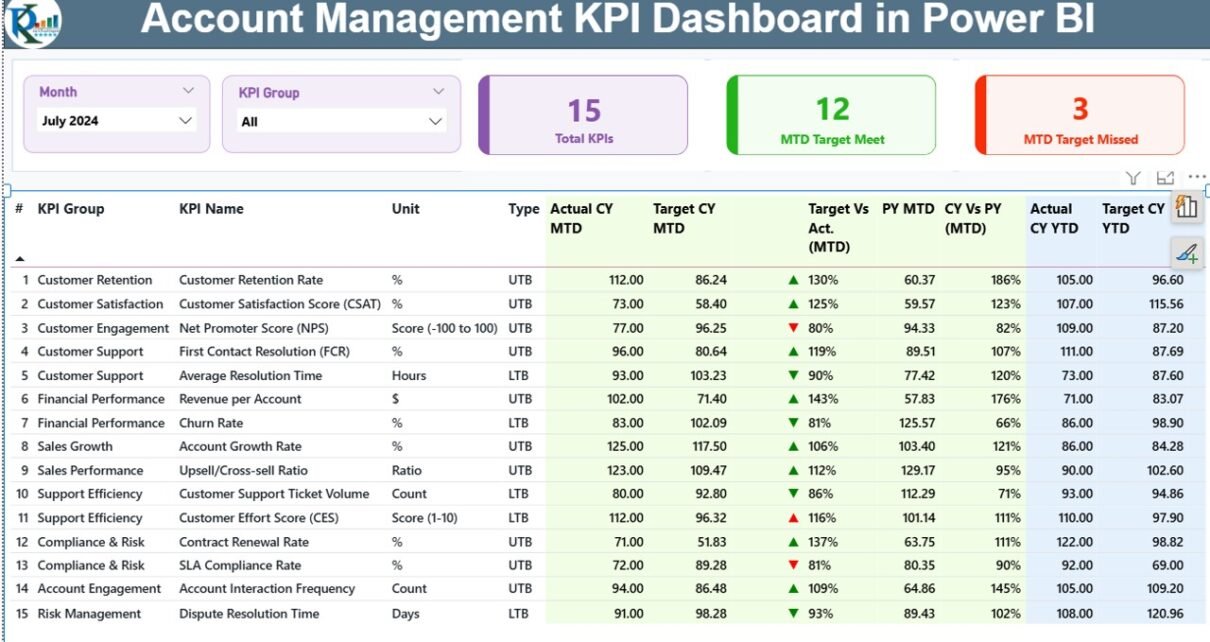
Account Management KPI Dashboard in Power BI

November 28, 2025November 28, 2025 PKComments Off on Account Management KPI Dashboard in Power BI
Monitoring account performance becomes difficult when data lives in multiple files, scattered reports, or outdated summaries. Even small account management teams handle many KPIs every month, and this often leads
Read More
Dashboard Power BI

Tech Support Efficiency KPI Dashboard in Power BI

November 26, 2025November 26, 2025 PKComments Off on Tech Support Efficiency KPI Dashboard in Power BI
Managing a tech support team demands speed, accuracy, and clear visibility. Businesses receive hundreds of support requests every day, and leaders must track performance continuously. When teams respond fast, resolve
Read More
Dashboard Power BI

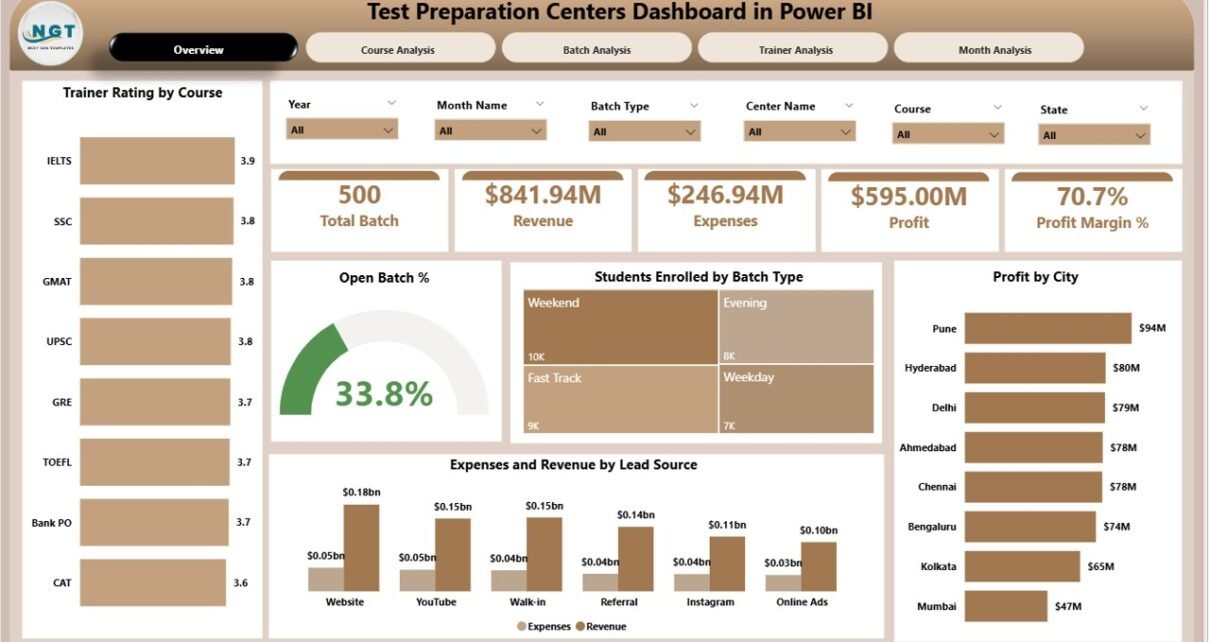
Test Preparation Centres Dashboard in Power BI

November 23, 2025November 23, 2025 PKComments Off on Test Preparation Centres Dashboard in Power BI
Running a test preparation centre demands careful planning, real-time insights, and quick decision-making. Students expect organised batches, skilled trainers, and smooth learning experiences. However, centres handle large volumes of information
Read More
Templates

Emergency Management KPI Dashboard in Power BI

November 20, 2025November 20, 2025 PKComments Off on Emergency Management KPI Dashboard in Power BI
Emergency management teams work under pressure. They respond to incidents, coordinate resources, deploy equipment, manage communication, and ensure public safety. Because emergencies happen without warning, teams need accurate performance insights
Read More
Dashboard Power BI

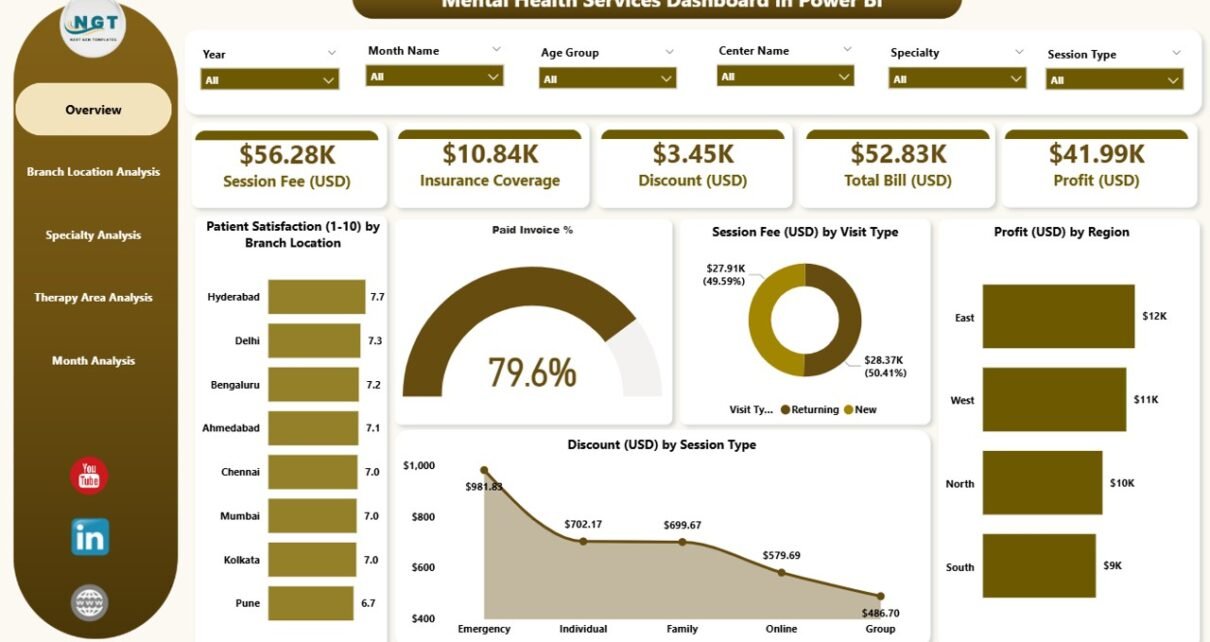
Mental Health Services Dashboard in Power BI

November 20, 2025November 20, 2025 PKComments Off on Mental Health Services Dashboard in Power BI
Mental health organizations deal with a large volume of data every day. Therapists, psychologists, and administrators track patient visits, treatment progress, session fees, branch performance, and financial outcomes. However, many
Read More
Templates

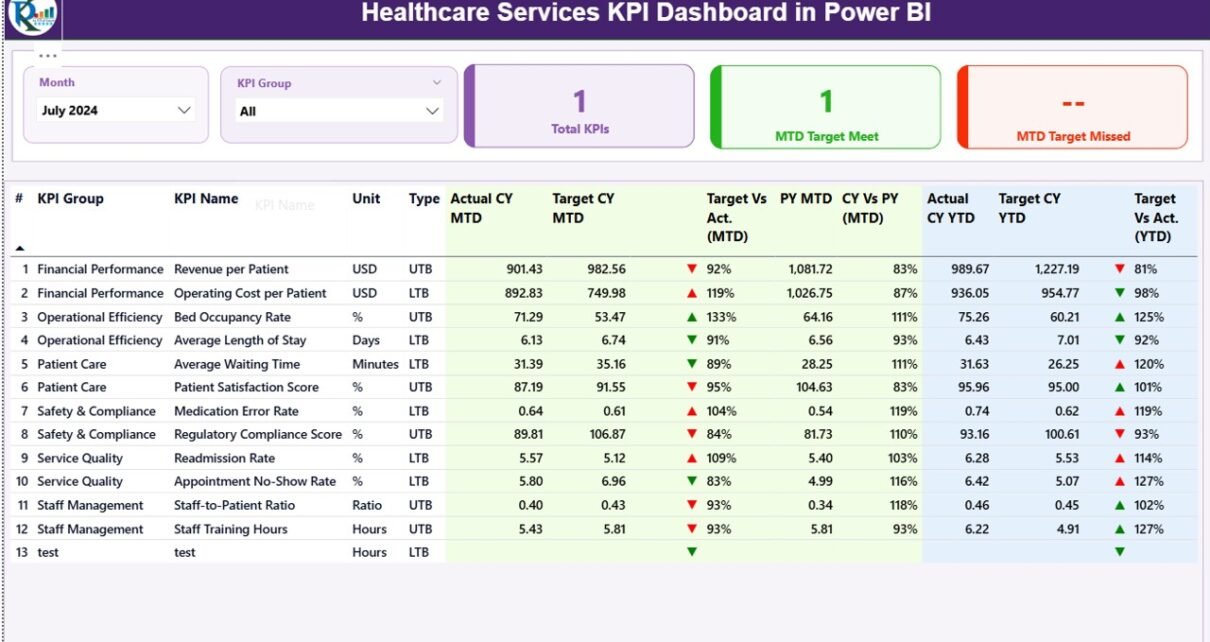
Healthcare Services KPI Dashboard in Power BI

November 17, 2025November 17, 2025 PKComments Off on Healthcare Services KPI Dashboard in Power BI
Healthcare organizations work in an environment where each day brings new challenges. Patient needs change fast, operations shift often, and teams must respond with accuracy. Because of this active and
Read More
Dashboard Power BI

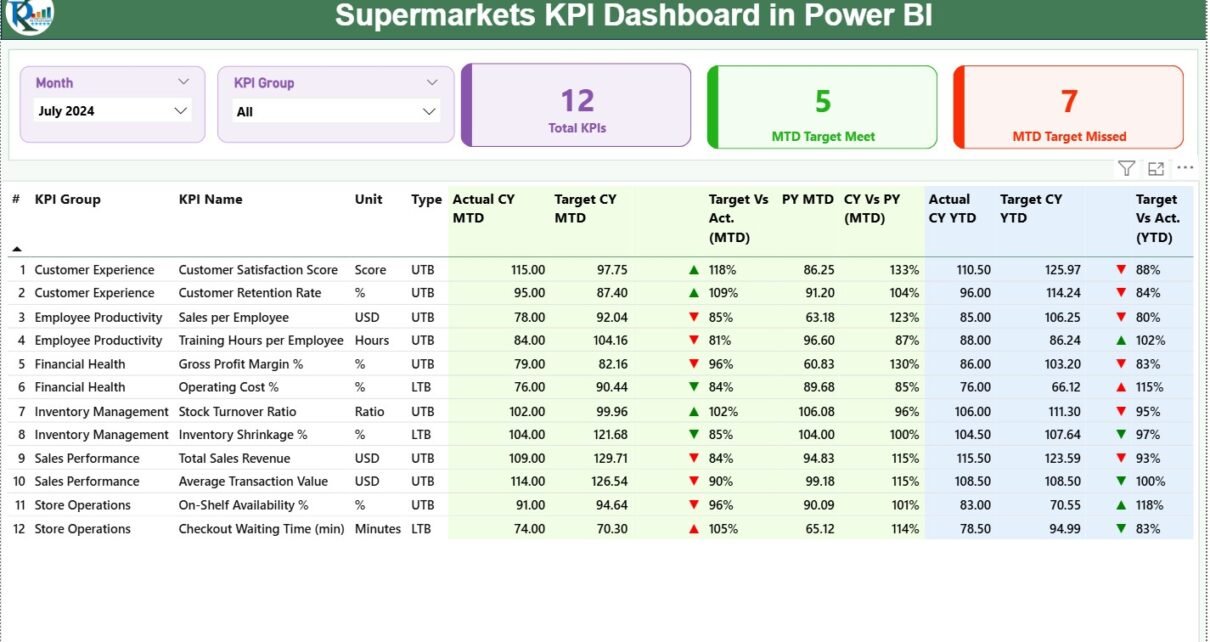
Supermarkets KPI Dashboard in Power BI

November 17, 2025November 17, 2025 PKComments Off on Supermarkets KPI Dashboard in Power BI
A supermarket runs in a fast, highly competitive, and customer-driven environment. Every day teams track sales, operations, inventory, margins, customer experience, supply chain performance, and many other metrics. Because of
Read More
Templates

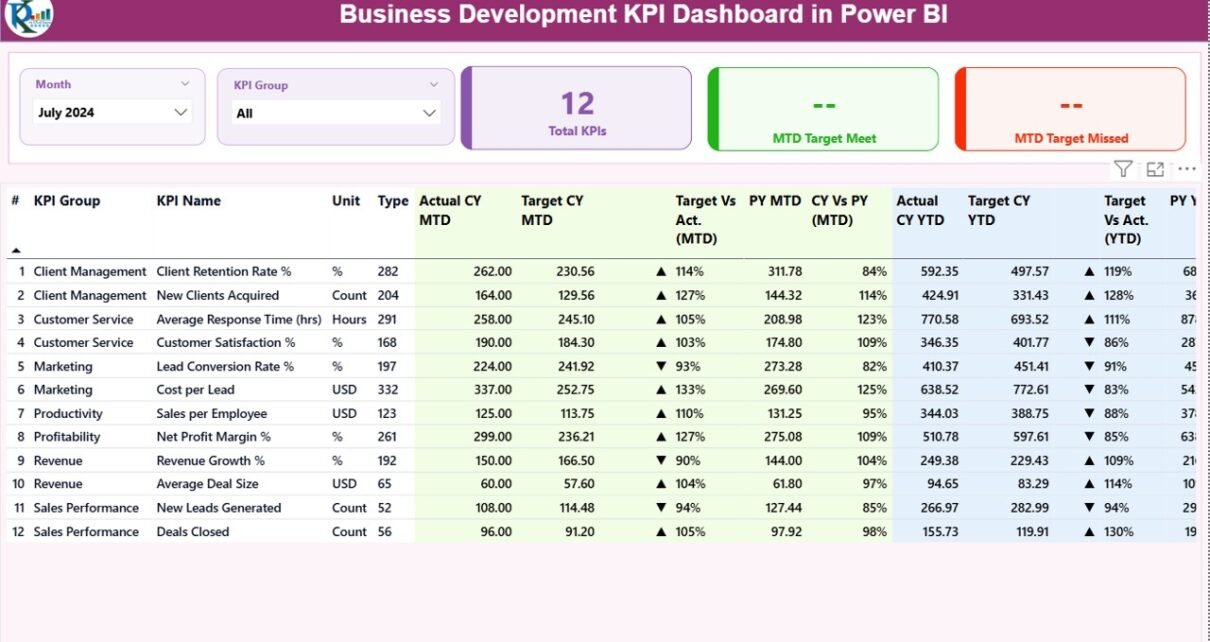
Business Development KPI Dashboard in Power BI

November 16, 2025November 16, 2025 PKComments Off on Business Development KPI Dashboard in Power BI
Business development teams work in a high-pressure environment where every lead, every opportunity, and every conversion matters. However, many organizations still track their KPIs through scattered spreadsheets, inconsistent reports, or
Read More
Power Pivot

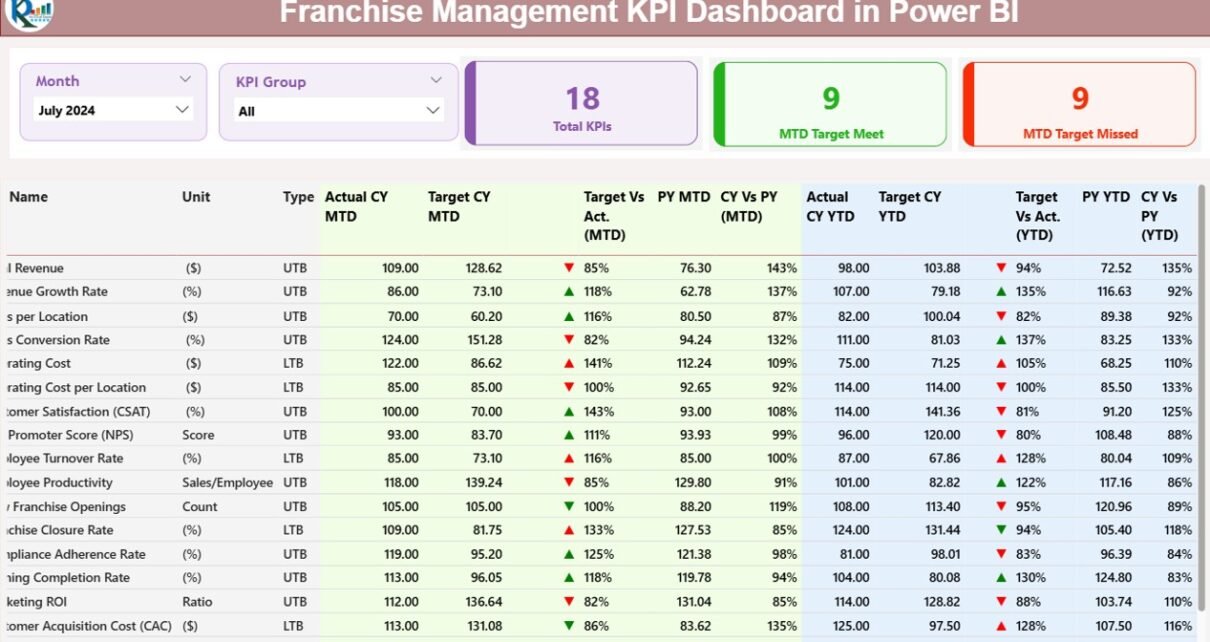
Franchise Management KPI Dashboard in Power BI

November 12, 2025November 12, 2025 PKComments Off on Franchise Management KPI Dashboard in Power BI
Running a franchise network efficiently requires more than just intuition—it demands accurate data analysis, timely decision-making, and continuous performance tracking. That’s where the Franchise Management KPI Dashboard in Power BI
Read More

Posts pagination

Previous 1 … 10 11 12 13 Next
  • Learn Excel (Free Course)
    • 1. Shortcut Keys
    • 2. Fill & Flash Fill
    • 3. Find & Replace
    • 4. Sort & Filter
    • 5. Formulas & Functions
    • 6. Data Validation
    • 7. Conditional Formatting
    • 8. Basic Charts
    • 9. Advanced Charts
    • 10. Pivot Tables
    • 11. Excel Dashboards
    • 12. VBA Course
    • 13. Excel Formulas with AI
  • Templates
  • Tutorials
    • Charts and Visualization
    • VBA
    • Excel Tips and Tricks
    • Excel Dashboards
    • Power Pivot & DAX
  • Power BI
  • Template Store
    • Ready to Use Templates
  • Courses
  • Academy
    • Excel + AI Mastery: 100 Formulas
    • Excel Pivot Tables & Dashboards
  • About Us
  • Contact Us
Copyright © 2023 PK-AnExcelExpert.com - Privacy Policy