New: NextGenTemplates Academy - video courses on Excel formulas with AI and Pivot Tables & dashboards. Early-bird: 20% off with code EARLYBIRD20 - first 20 orders only. See the courses →
  • Learn Excel (Free Course)
    • 1. Shortcut Keys
    • 2. Fill & Flash Fill
    • 3. Find & Replace
    • 4. Sort & Filter
    • 5. Formulas & Functions
    • 6. Data Validation
    • 7. Conditional Formatting
    • 8. Basic Charts
    • 9. Advanced Charts
    • 10. Pivot Tables
    • 11. Excel Dashboards
    • 12. VBA Course
    • 13. Excel Formulas with AI
  • Templates
  • Tutorials
    • Charts and Visualization
    • VBA
    • Excel Tips and Tricks
    • Excel Dashboards
    • Power Pivot & DAX
  • Power BI
  • Template Store
    • Ready to Use Templates
  • Courses
  • Academy
    • Excel + AI Mastery: 100 Formulas
    • Excel Pivot Tables & Dashboards
  • About Us
  • Contact Us

PK: An Excel Expert

Transforming Data into Decisions

Tag: Power BI reports

Dashboard Power BI

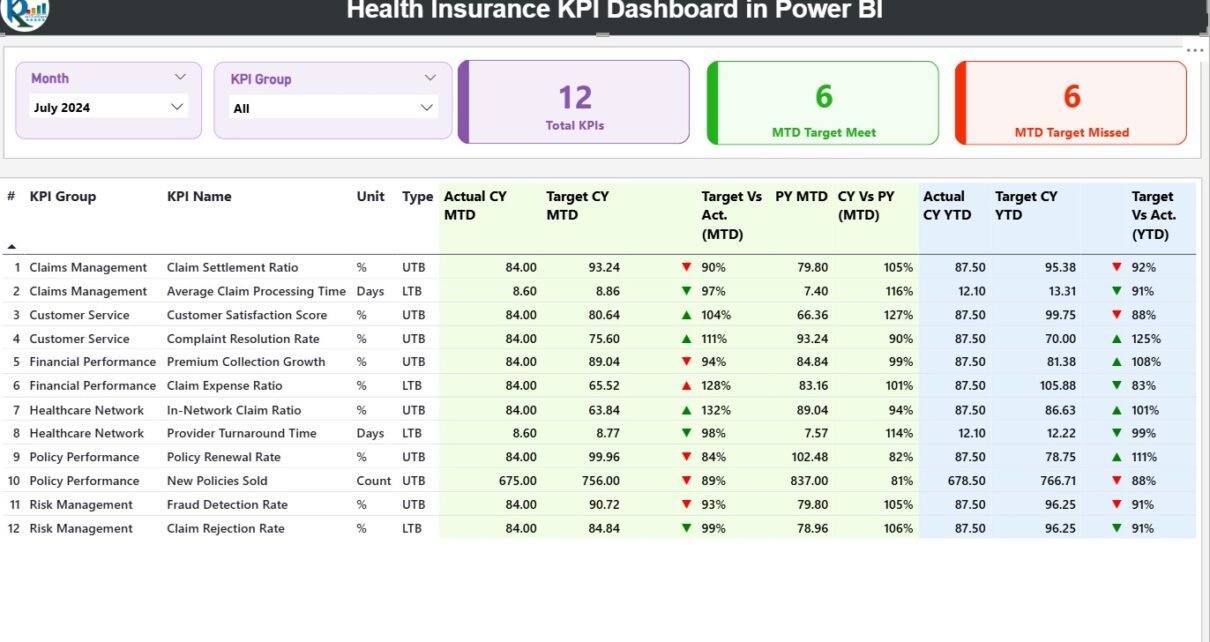
Health Insurance KPI Dashboard in Power BI

November 11, 2025November 11, 2025 PKComments Off on Health Insurance KPI Dashboard in Power BI
In the modern healthcare landscape, data plays a crucial role in managing insurance operations efficiently. Whether you’re analyzing claim trends, member satisfaction, or premium performance, understanding the story behind your
Read More
Dashboard Power BI

Personal Care & Beauty Dashboard in Power BI

November 5, 2025November 5, 2025 PKComments Off on Personal Care & Beauty Dashboard in Power BI
A Personal Care & Beauty Dashboard in Power BI is a dynamic reporting tool designed to analyze data related to beauty services, products, and operations. It connects with Excel-based data
Read More
Dashboard Power BI

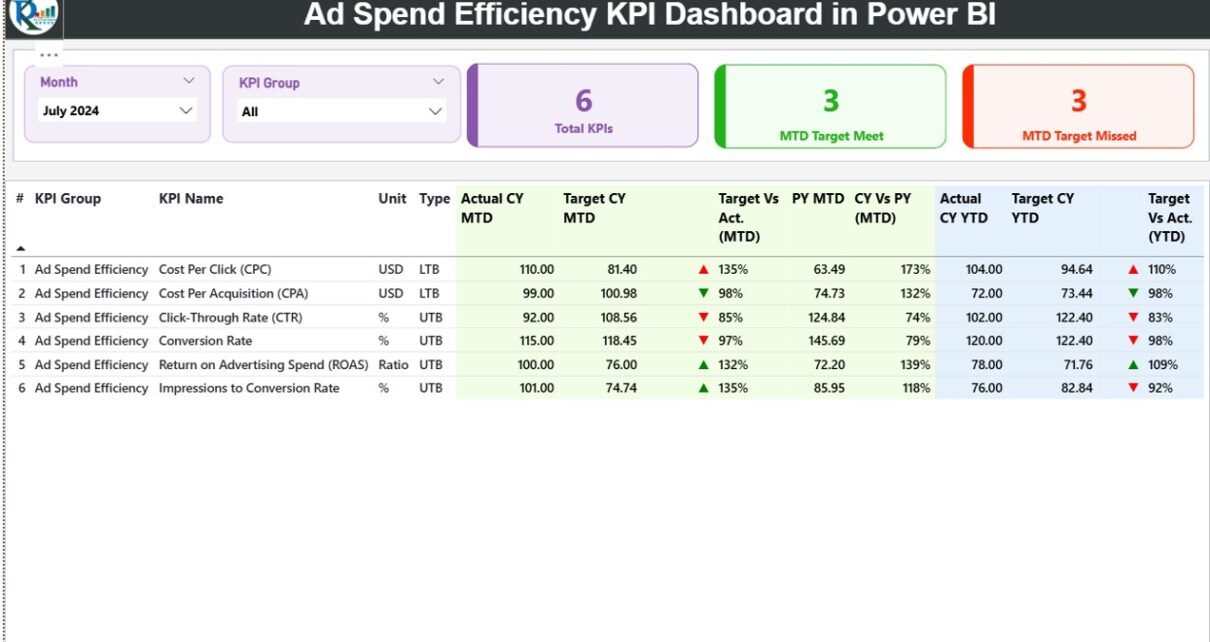
Ad Spend Efficiency KPI Dashboard in Power BI

November 2, 2025November 2, 2025 PKComments Off on Ad Spend Efficiency KPI Dashboard in Power BI
In today’s fast-moving digital landscape, advertising has become more data-driven than ever. Companies spend millions of dollars across different marketing channels—Google Ads, Meta Ads, LinkedIn, YouTube, and more. But how
Read More
Dashboard Power BI

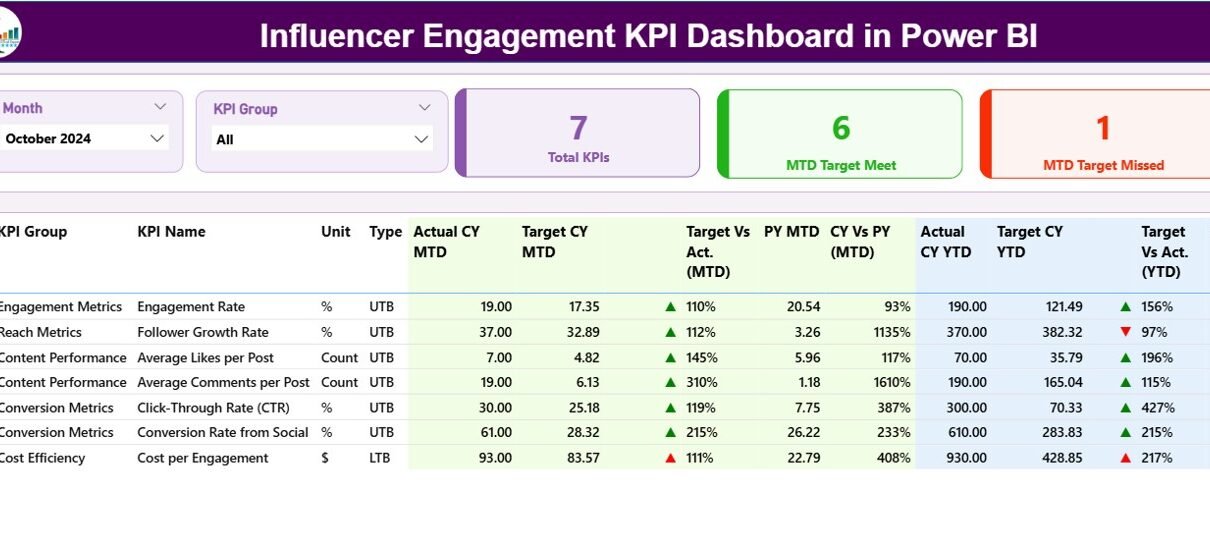
Influencer Engagement KPI Dashboard in Power BI

October 31, 2025October 31, 2025 PKComments Off on Influencer Engagement KPI Dashboard in Power BI
In today’s digital-first world, influencer marketing has become one of the most powerful ways for brands to build trust, reach new audiences, and drive conversions. However, managing multiple influencers, tracking
Read More
Dashboard Power BI

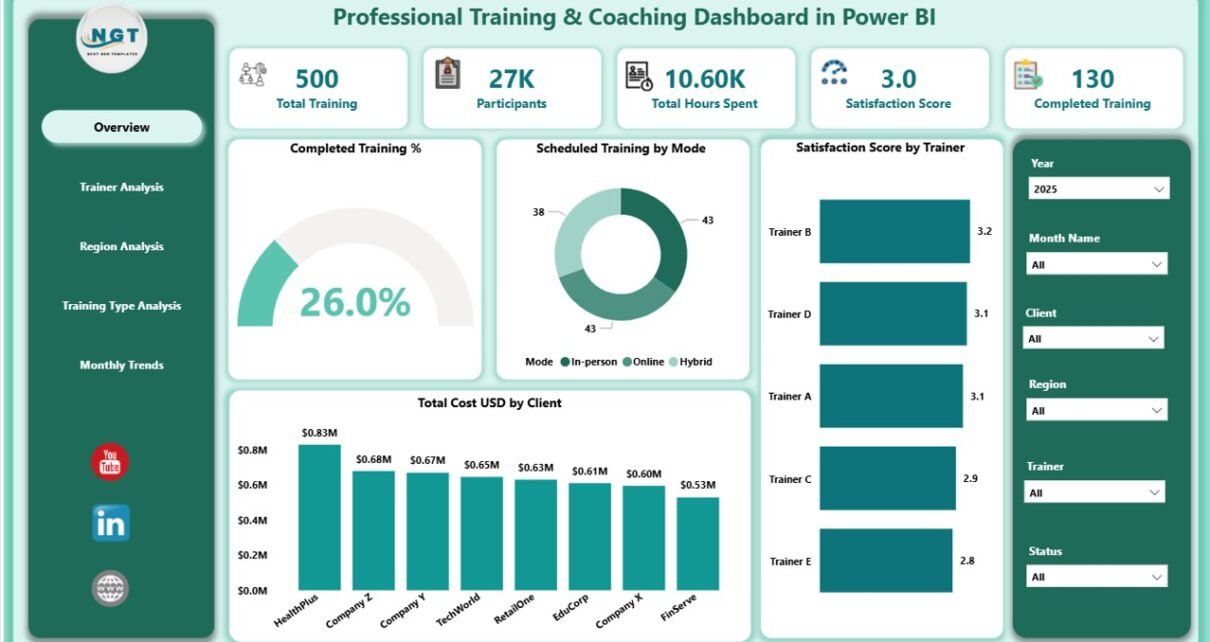
Professional Training & Coaching Dashboard in Power BI

October 27, 2025October 27, 2025 PKComments Off on Professional Training & Coaching Dashboard in Power BI
In today’s competitive and fast-changing business environment, professional training and coaching have become essential for success. Organizations that invest in employee development not only boost productivity but also increase retention
Read More
Templates

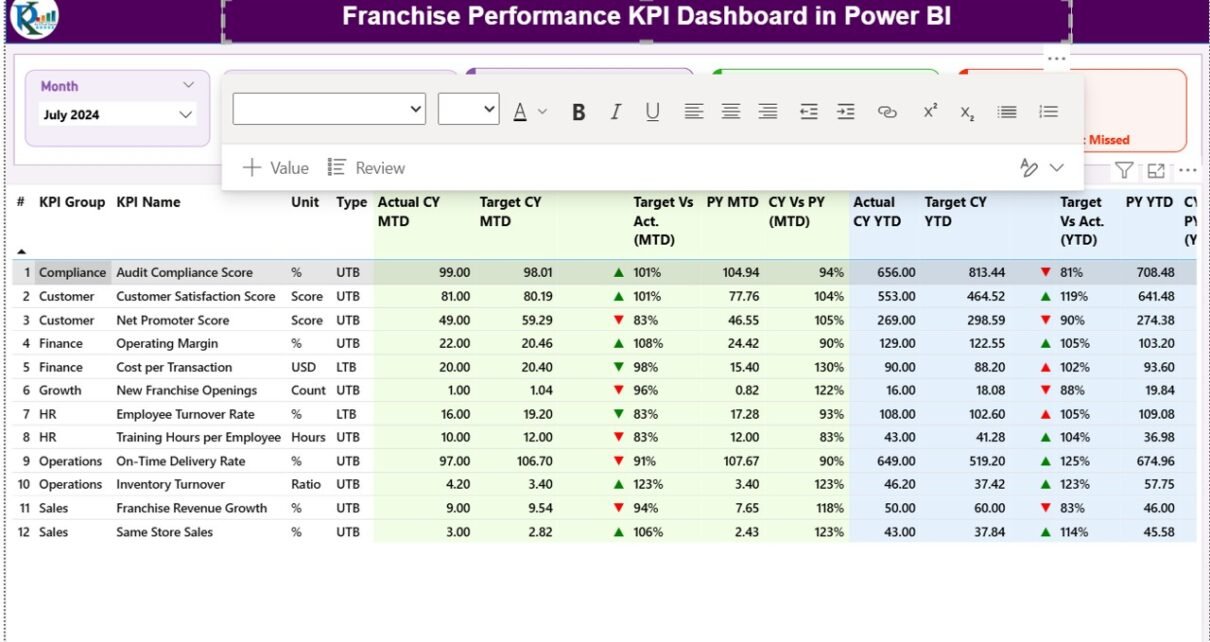
Franchise Performance KPI Dashboard in Power BI

October 27, 2025October 27, 2025 PKComments Off on Franchise Performance KPI Dashboard in Power BI
In today’s competitive franchise industry, monitoring performance across multiple branches or outlets is crucial. Whether you manage a global restaurant chain, a fitness brand, or a retail network, having clear
Read More
Dashboard Power BI

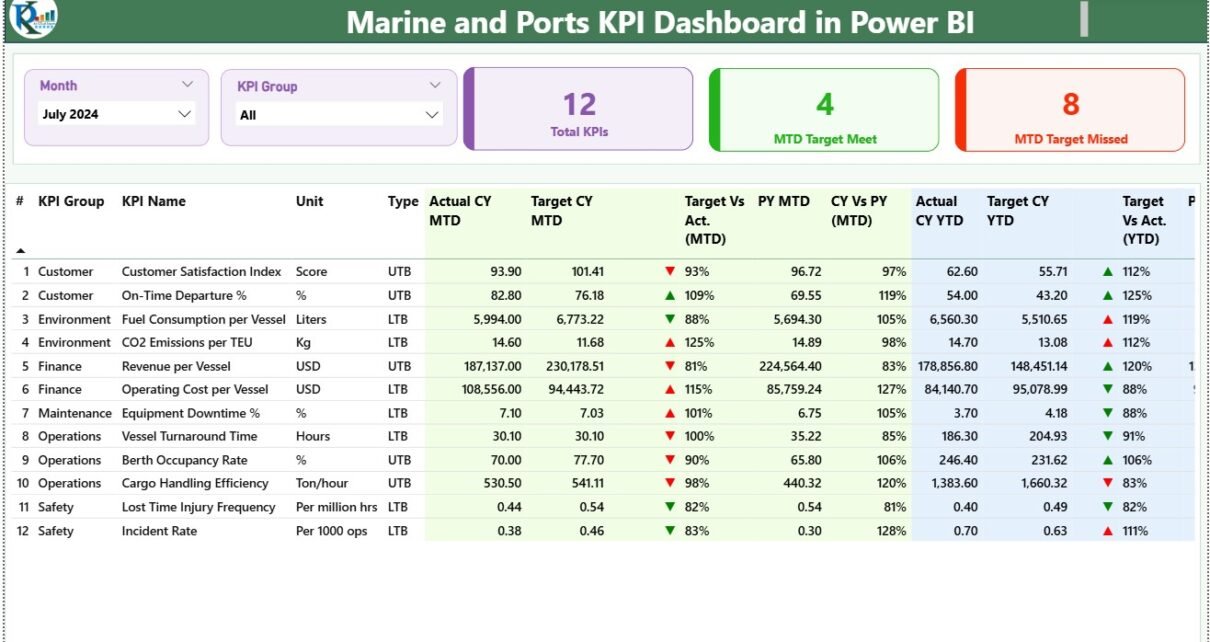
Marine and Ports KPI Dashboard in Power BI

October 27, 2025October 27, 2025 PKComments Off on Marine and Ports KPI Dashboard in Power BI
The maritime and port industry is one of the most complex and globally connected sectors. Every day, hundreds of ships, containers, and logistics operations move across ports and terminals worldwide.
Read More
Dashboard Power BI

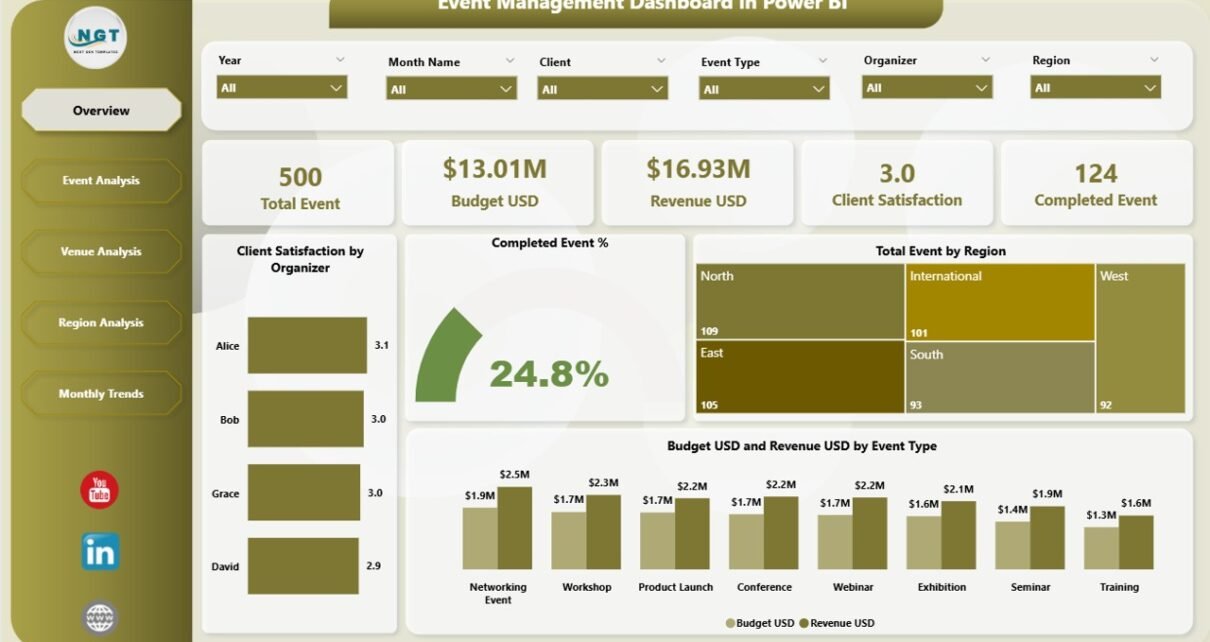
Event Management Dashboard in Power BI

October 26, 2025October 26, 2025 PKComments Off on Event Management Dashboard in Power BI
Managing events successfully requires more than just planning and coordination — it requires data-driven insights. Whether you're organizing corporate conferences, exhibitions, concerts, or workshops, having access to accurate, real-time information
Read More
Dashboard Power BI

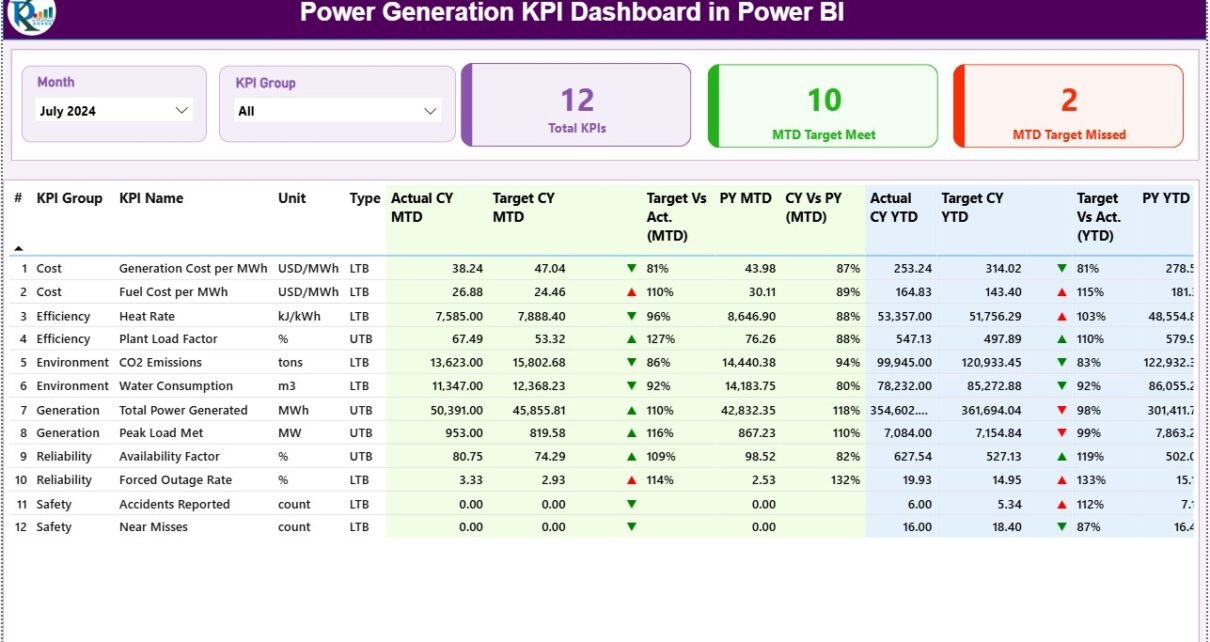
Power Generation KPI Dashboard in Power BI

October 26, 2025October 26, 2025 PKComments Off on Power Generation KPI Dashboard in Power BI
In the modern energy industry, data-driven decision-making is no longer optional — it’s essential. Power generation companies must track multiple performance indicators across plants, equipment, safety standards, and efficiency levels
Read More
Templates

Store Operations KPI Dashboard in Power BI

October 18, 2025October 18, 2025 PKComments Off on Store Operations KPI Dashboard in Power BI
In today’s fast-moving retail industry, store operations play a crucial role in driving customer satisfaction, efficiency, and profitability. Managing hundreds of performance metrics across multiple outlets can become overwhelming —
Read More

Posts pagination

Previous 1 … 11 12 13 Next
  • Learn Excel (Free Course)
    • 1. Shortcut Keys
    • 2. Fill & Flash Fill
    • 3. Find & Replace
    • 4. Sort & Filter
    • 5. Formulas & Functions
    • 6. Data Validation
    • 7. Conditional Formatting
    • 8. Basic Charts
    • 9. Advanced Charts
    • 10. Pivot Tables
    • 11. Excel Dashboards
    • 12. VBA Course
    • 13. Excel Formulas with AI
  • Templates
  • Tutorials
    • Charts and Visualization
    • VBA
    • Excel Tips and Tricks
    • Excel Dashboards
    • Power Pivot & DAX
  • Power BI
  • Template Store
    • Ready to Use Templates
  • Courses
  • Academy
    • Excel + AI Mastery: 100 Formulas
    • Excel Pivot Tables & Dashboards
  • About Us
  • Contact Us
Copyright © 2023 PK-AnExcelExpert.com - Privacy Policy