New: NextGenTemplates Academy - video courses on Excel formulas with AI and Pivot Tables & dashboards. Early-bird: 20% off with code EARLYBIRD20 - first 20 orders only. See the courses →
  • Learn Excel (Free Course)
    • 1. Shortcut Keys
    • 2. Fill & Flash Fill
    • 3. Find & Replace
    • 4. Sort & Filter
    • 5. Formulas & Functions
    • 6. Data Validation
    • 7. Conditional Formatting
    • 8. Basic Charts
    • 9. Advanced Charts
    • 10. Pivot Tables
    • 11. Excel Dashboards
    • 12. VBA Course
    • 13. Excel Formulas with AI
  • Templates
  • Tutorials
    • Charts and Visualization
    • VBA
    • Excel Tips and Tricks
    • Excel Dashboards
    • Power Pivot & DAX
  • Power BI
  • Template Store
    • Ready to Use Templates
  • Courses
  • Academy
    • Excel + AI Mastery: 100 Formulas
    • Excel Pivot Tables & Dashboards
  • About Us
  • Contact Us

PK: An Excel Expert

Transforming Data into Decisions

Tag: Power BI reports

Dashboard Power BI

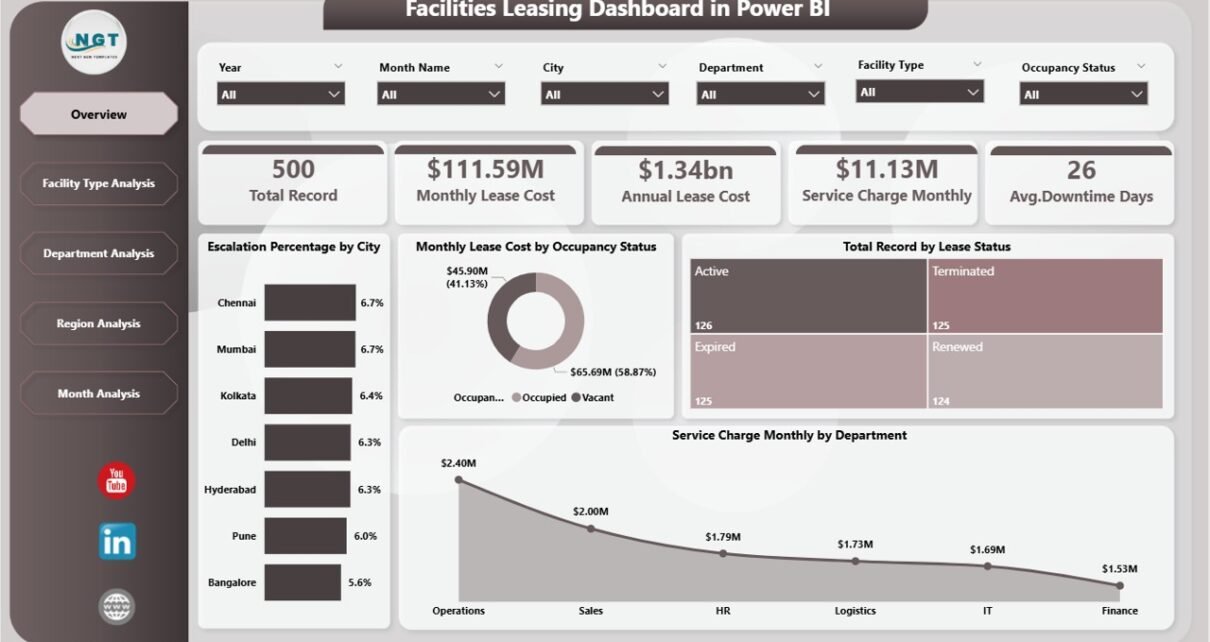
Facilities Leasing Dashboard in Power BI

February 19, 2026February 19, 2026 PKComments Off on Facilities Leasing Dashboard in Power BI
Managing facility leases across multiple locations often becomes complicated. Many organizations still depend on scattered spreadsheets and manual tracking. As a result, teams struggle to monitor lease costs, escalation trends,
Read More
Dashboard Power BI

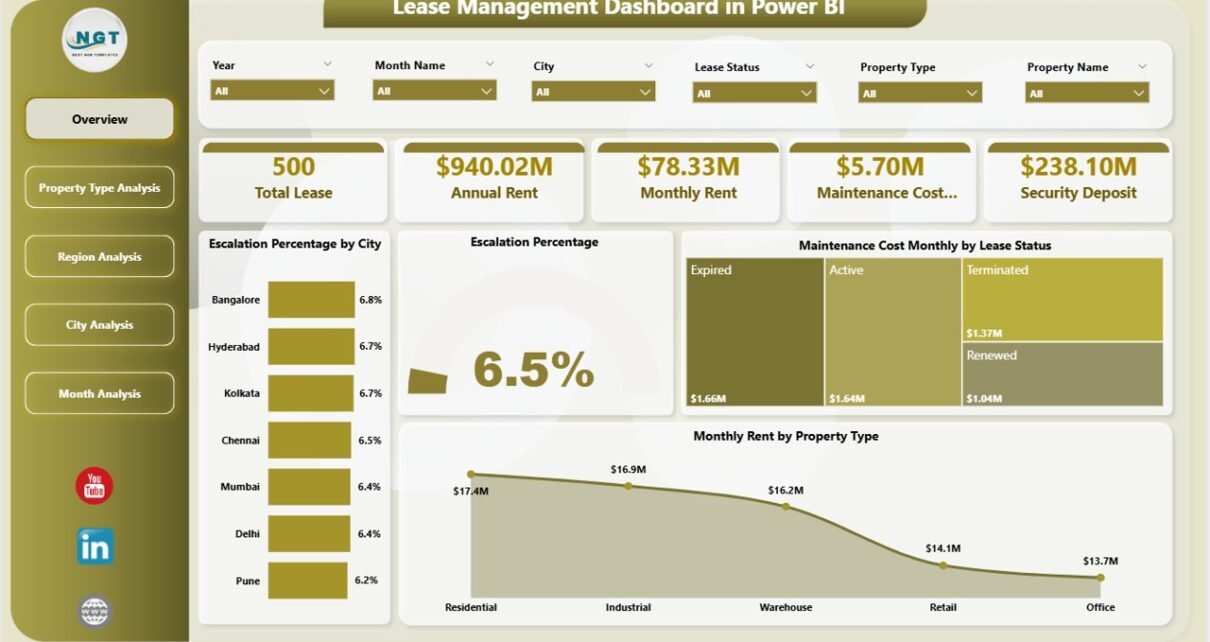
Lease Management Dashboard in Power BI

February 19, 2026February 19, 2026 PKComments Off on Lease Management Dashboard in Power BI
Managing leases across multiple properties, cities, and regions often becomes complicated. Many organizations still rely on scattered spreadsheets. As a result, they struggle to track rent, maintenance costs, escalation percentages,
Read More
Dashboard Power BI

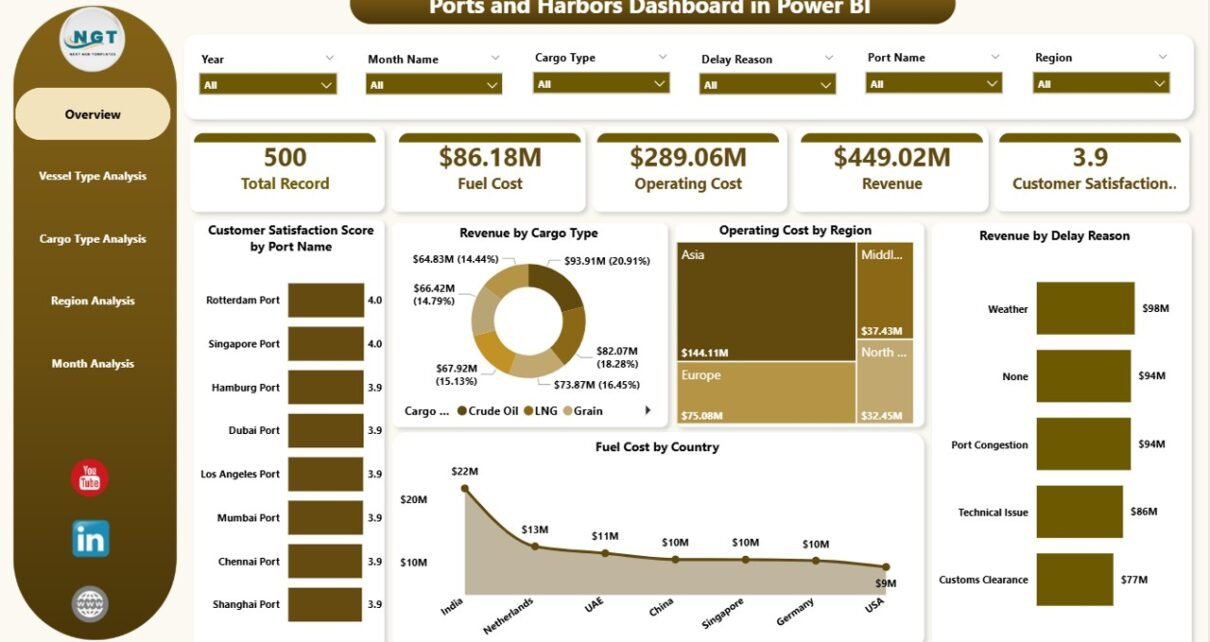
Ports and Harbors Dashboard in Power BI

February 17, 2026February 17, 2026 PKComments Off on Ports and Harbors Dashboard in Power BI
Ports and harbors play a critical role in global trade. Every day, thousands of vessels move cargo across continents. However, managing port operations becomes complex very quickly. Revenue fluctuates. Fuel
Read More
Dashboard Power BI

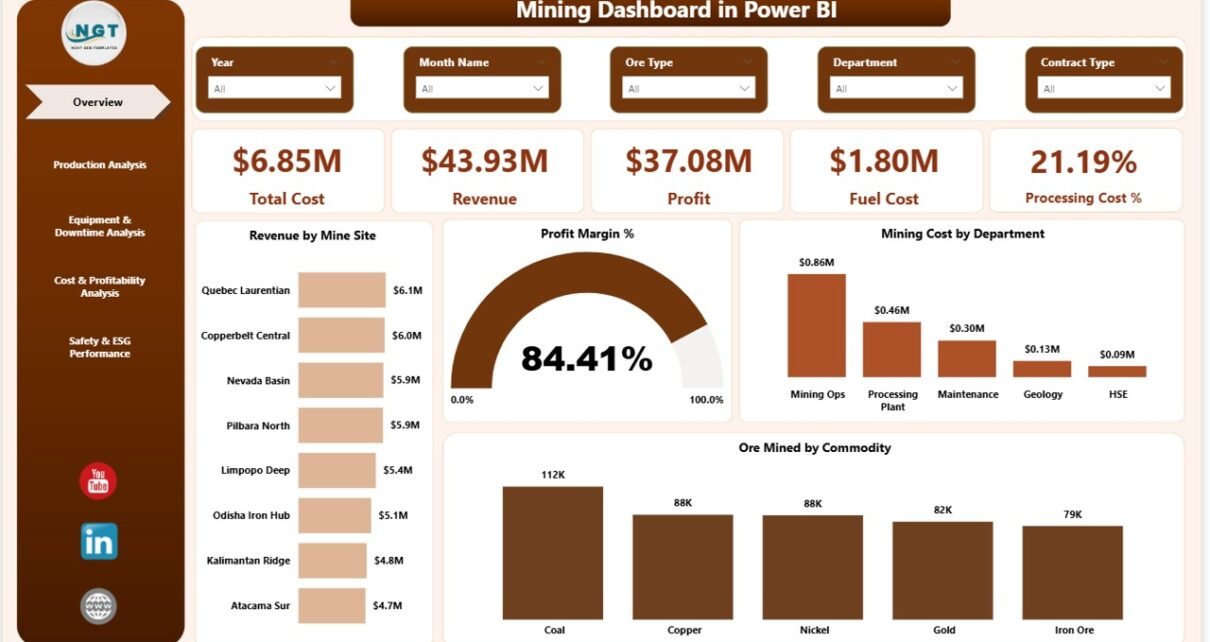
Mining Dashboard in Power BI

February 15, 2026February 15, 2026 PKComments Off on Mining Dashboard in Power BI
The mining industry works in one of the toughest environments in the world. Companies handle heavy equipment, complex operations, rising fuel costs, strict safety rules, and environmental responsibilities. Therefore, leaders
Read More
Dashboard Power BI

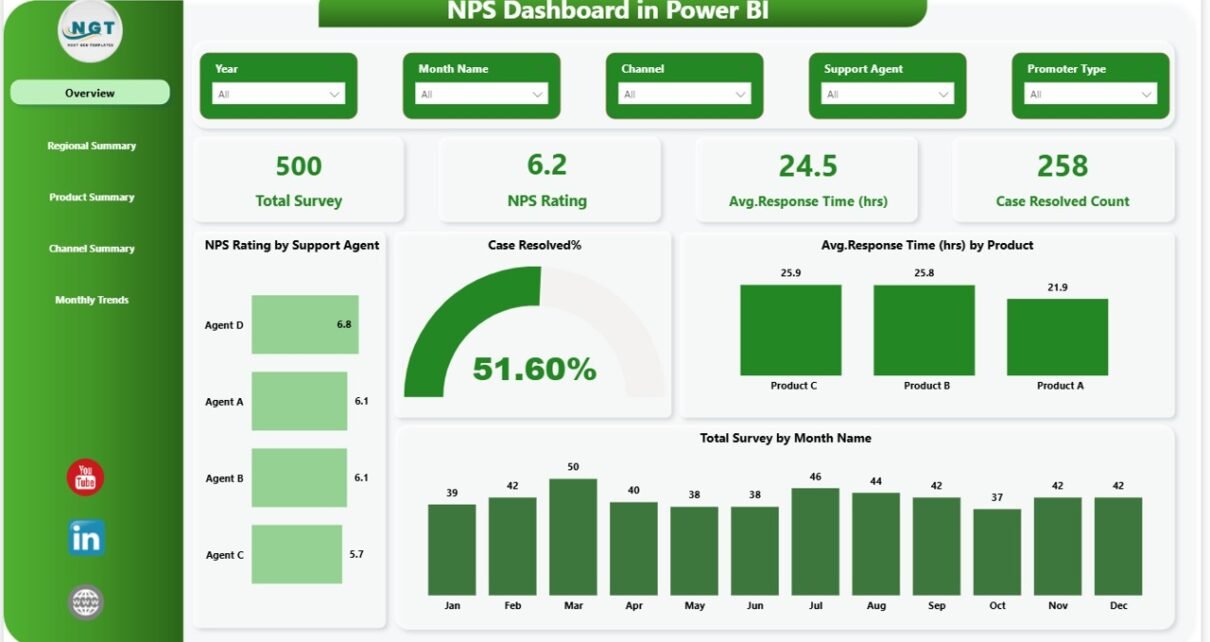
NPS Dashboard in Power BI

February 12, 2026February 12, 2026 PKComments Off on NPS Dashboard in Power BI
Customer loyalty decides business growth. However, many organizations still track customer feedback in scattered spreadsheets. As a result, leaders struggle to measure satisfaction, response time, and resolution rates clearly.So, how
Read More
Dashboard Power BI

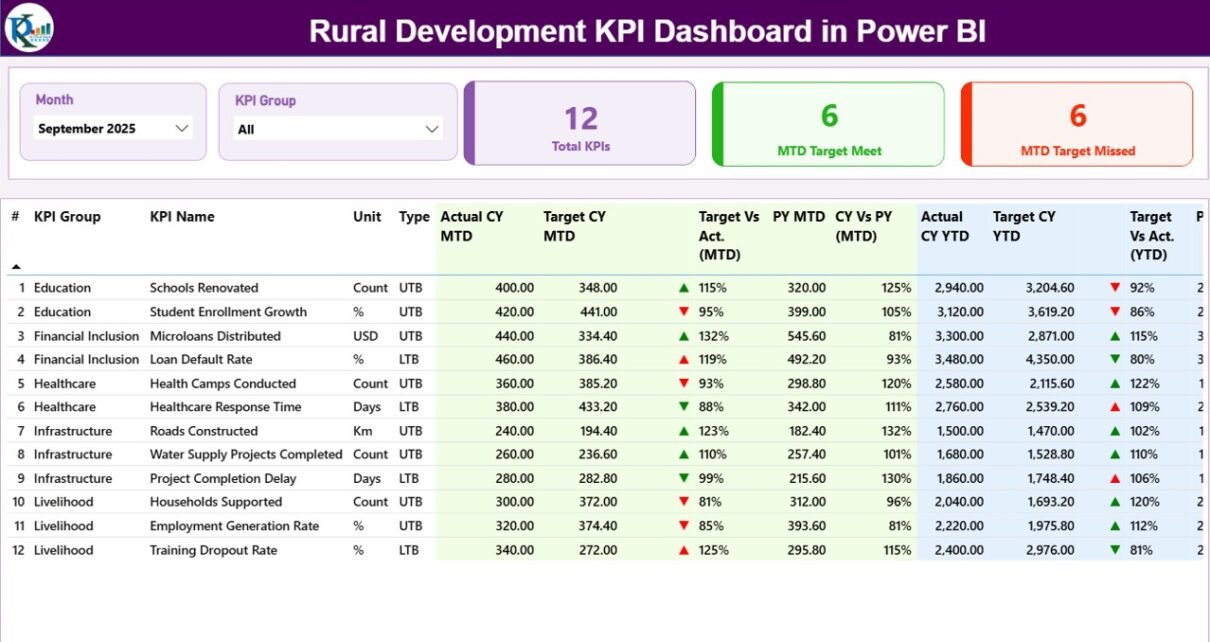
Rural Development KPI Dashboard in Power BI

February 12, 2026February 12, 2026 PKComments Off on Rural Development KPI Dashboard in Power BI
Rural development drives economic stability, social growth, and long-term sustainability. However, many government bodies and NGOs still track rural programs using scattered spreadsheets. As a result, decision-makers struggle to measure
Read More
Dashboard Power BI

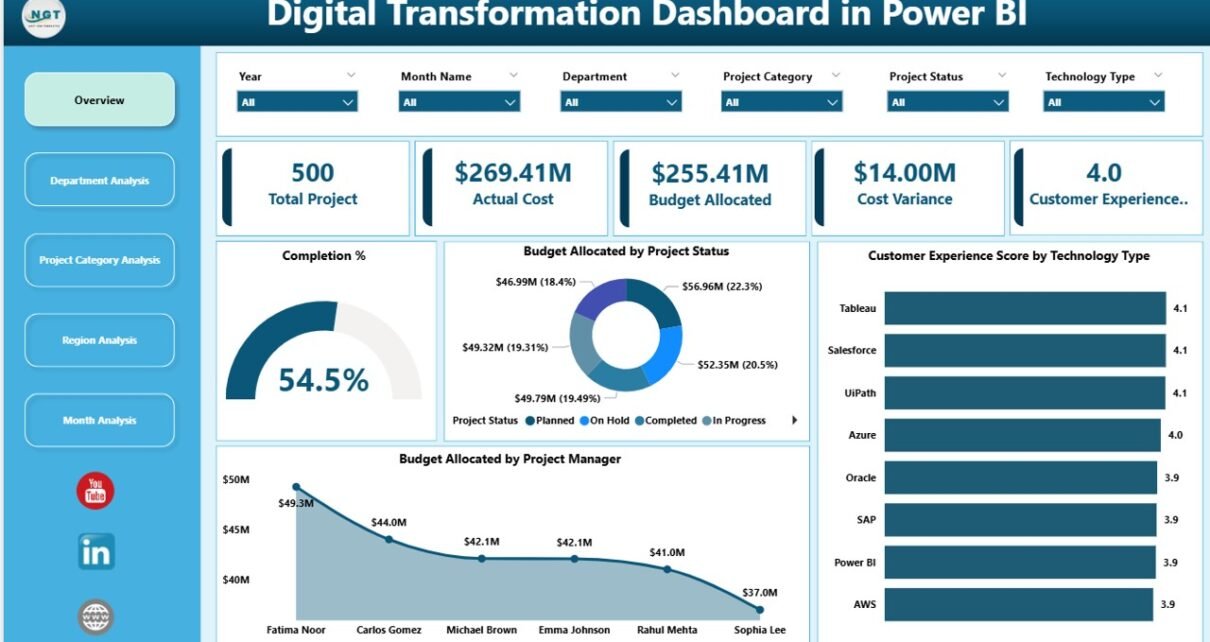
Digital Transformation Dashboard in Power BI

February 11, 2026February 11, 2026 PKComments Off on Digital Transformation Dashboard in Power BI
Digital transformation is no longer optional. Organizations compete in a fast-moving world. Customers expect speed. Teams demand automation. Leaders need visibility. However, many companies still track digital projects using scattered
Read More
Dashboard Power BI

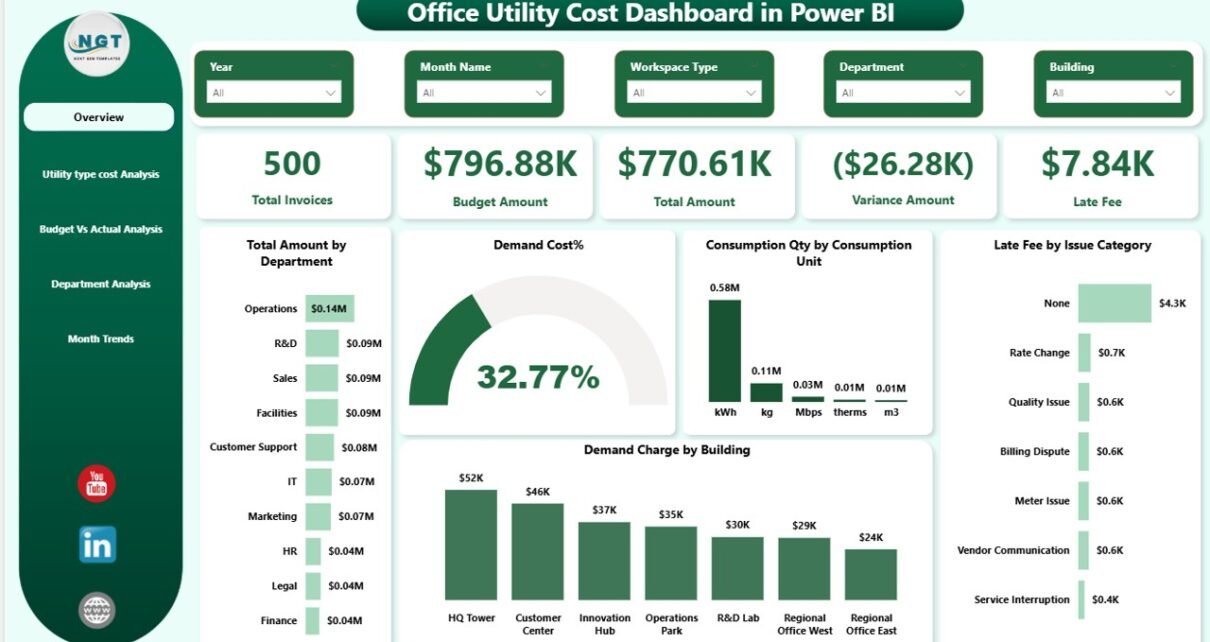
Office Utility Cost Dashboard in Power BI

February 10, 2026February 10, 2026 PKComments Off on Office Utility Cost Dashboard in Power BI
Managing office utility costs has become more important than ever. Energy prices continue to rise. Water tariffs keep changing. Demand charges increase without warning. As a result, businesses struggle to
Read More
Dashboard Power BI

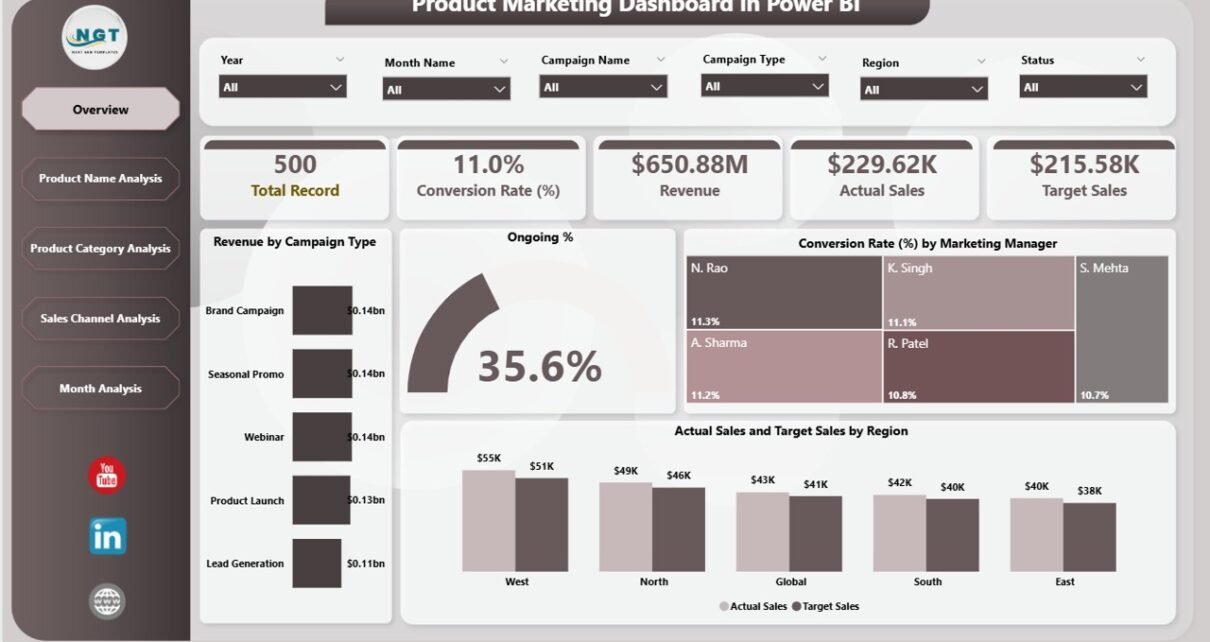
Product Marketing Dashboard in Power BI

February 10, 2026February 10, 2026 PKComments Off on Product Marketing Dashboard in Power BI
Marketing today moves fast. Campaigns launch every week. Products compete for attention. Teams spend budgets across channels. However, without clear data, even the best marketing strategy can fail. So, how
Read More
Dashboard Power BI

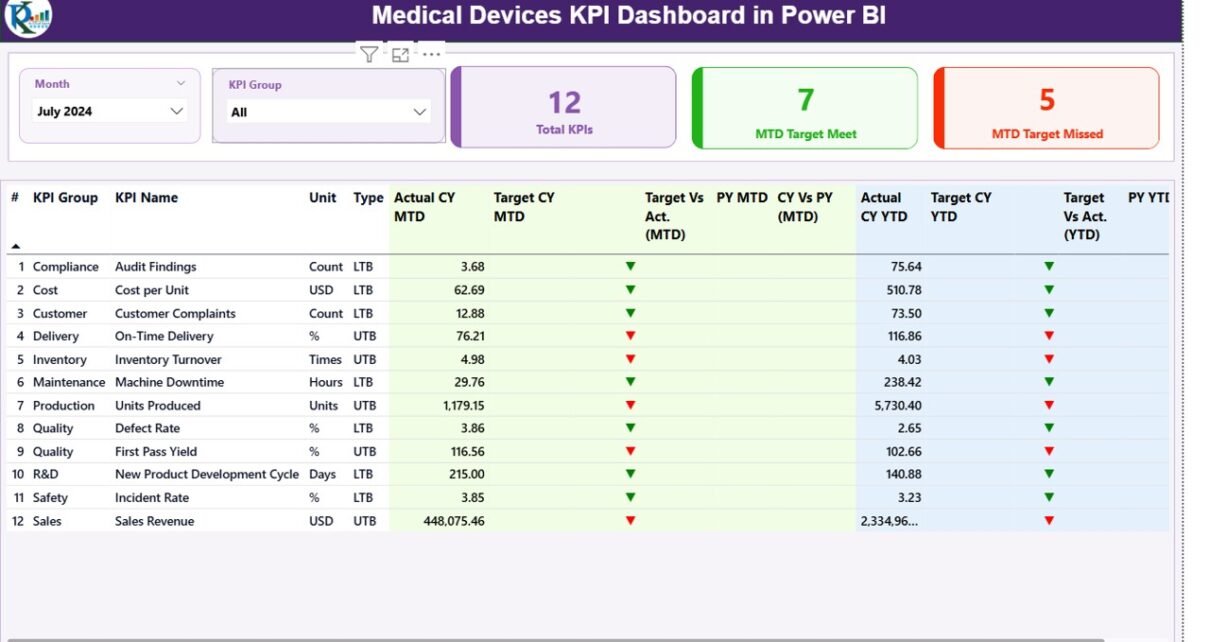
Medical Devices KPI Dashboard in Power BI

February 10, 2026February 10, 2026 PKComments Off on Medical Devices KPI Dashboard in Power BI
The medical devices industry demands precision, compliance, and consistent performance. Every month, teams monitor production output, defect rates, regulatory metrics, sales growth, and service performance. However, many organizations still rely
Read More

Posts pagination

Previous 1 … 4 5 6 … 13 Next
  • Learn Excel (Free Course)
    • 1. Shortcut Keys
    • 2. Fill & Flash Fill
    • 3. Find & Replace
    • 4. Sort & Filter
    • 5. Formulas & Functions
    • 6. Data Validation
    • 7. Conditional Formatting
    • 8. Basic Charts
    • 9. Advanced Charts
    • 10. Pivot Tables
    • 11. Excel Dashboards
    • 12. VBA Course
    • 13. Excel Formulas with AI
  • Templates
  • Tutorials
    • Charts and Visualization
    • VBA
    • Excel Tips and Tricks
    • Excel Dashboards
    • Power Pivot & DAX
  • Power BI
  • Template Store
    • Ready to Use Templates
  • Courses
  • Academy
    • Excel + AI Mastery: 100 Formulas
    • Excel Pivot Tables & Dashboards
  • About Us
  • Contact Us
Copyright © 2023 PK-AnExcelExpert.com - Privacy Policy