New: NextGenTemplates Academy - video courses on Excel formulas with AI and Pivot Tables & dashboards. Early-bird: 20% off with code EARLYBIRD20 - first 20 orders only. See the courses →
  • Learn Excel (Free Course)
    • 1. Shortcut Keys
    • 2. Fill & Flash Fill
    • 3. Find & Replace
    • 4. Sort & Filter
    • 5. Formulas & Functions
    • 6. Data Validation
    • 7. Conditional Formatting
    • 8. Basic Charts
    • 9. Advanced Charts
    • 10. Pivot Tables
    • 11. Excel Dashboards
    • 12. VBA Course
    • 13. Excel Formulas with AI
  • Templates
  • Tutorials
    • Charts and Visualization
    • VBA
    • Excel Tips and Tricks
    • Excel Dashboards
    • Power Pivot & DAX
  • Power BI
  • Template Store
    • Ready to Use Templates
  • Courses
  • Academy
    • Excel + AI Mastery: 100 Formulas
    • Excel Pivot Tables & Dashboards
  • About Us
  • Contact Us

PK: An Excel Expert

Transforming Data into Decisions

Tag: Power BI reports

Dashboard Power BI

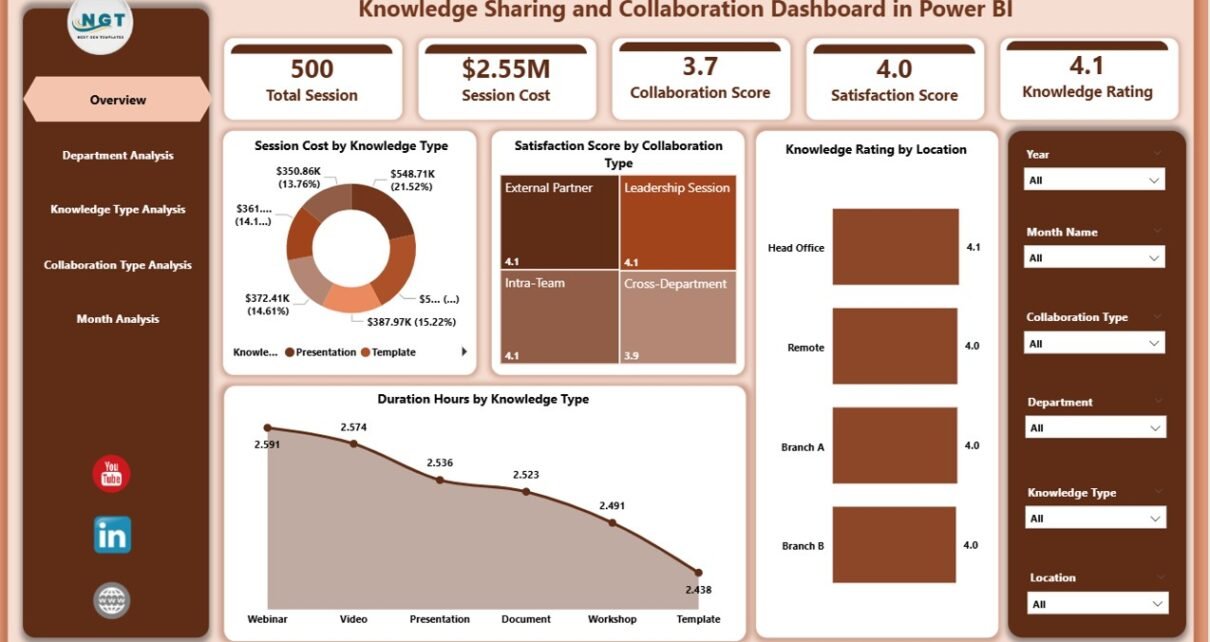
Knowledge Sharing and Collaboration Dashboard in Power BI

February 9, 2026February 9, 2026 PKComments Off on Knowledge Sharing and Collaboration Dashboard in Power BI
In today’s fast-moving Knowledge Sharing and Collaboration Dashboard, companies must share knowledge quickly. Teams work across departments. Employees join from different locations. Moreover, organizations rely on collaboration to drive innovation.
Read More
Dashboard Power BI

Employee Workload Dashboard in Power BI

February 8, 2026February 8, 2026 PKComments Off on Employee Workload Dashboard in Power BI
Managing employee workload has become more challenging than ever. Teams handle multiple projects. Deadlines move quickly. Priorities change daily. Meanwhile, managers struggle to understand who feels overloaded and who has
Read More
Dashboard Power BI

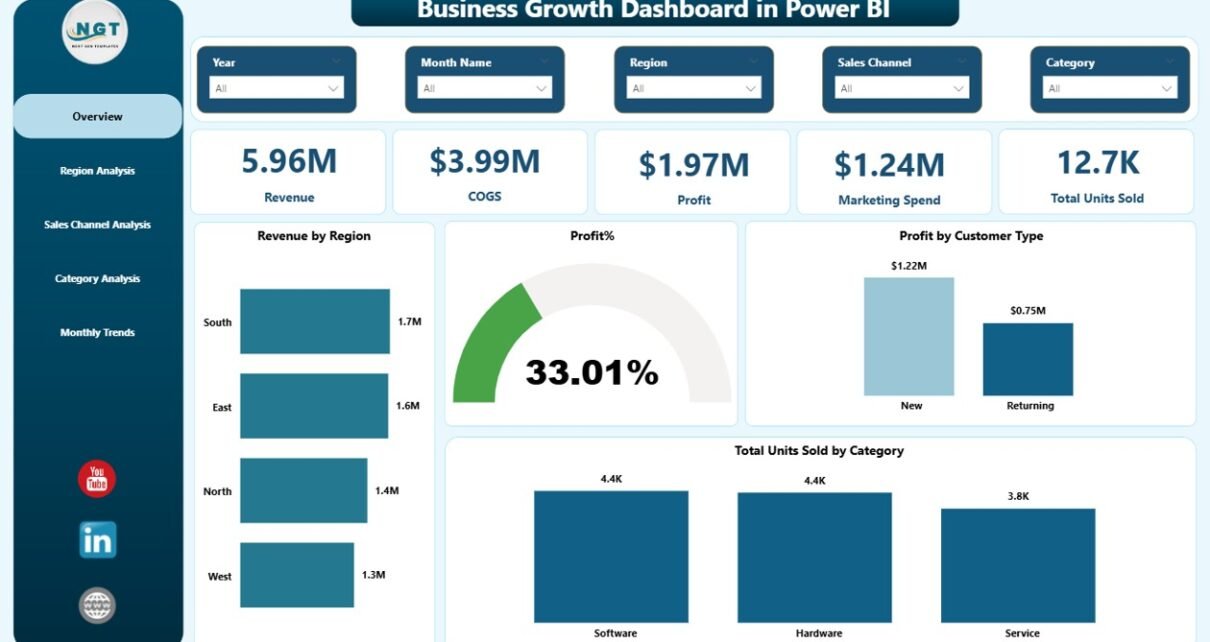
Business Growth Dashboard in Power BI

February 8, 2026February 8, 2026 PKComments Off on Business Growth Dashboard in Power BI
In today’s competitive market, businesses must move fast. Markets change quickly. Customer preferences shift constantly. Costs rise unexpectedly. Therefore, companies must track performance in real time. However, many organizations still
Read More
Dashboard Power BI

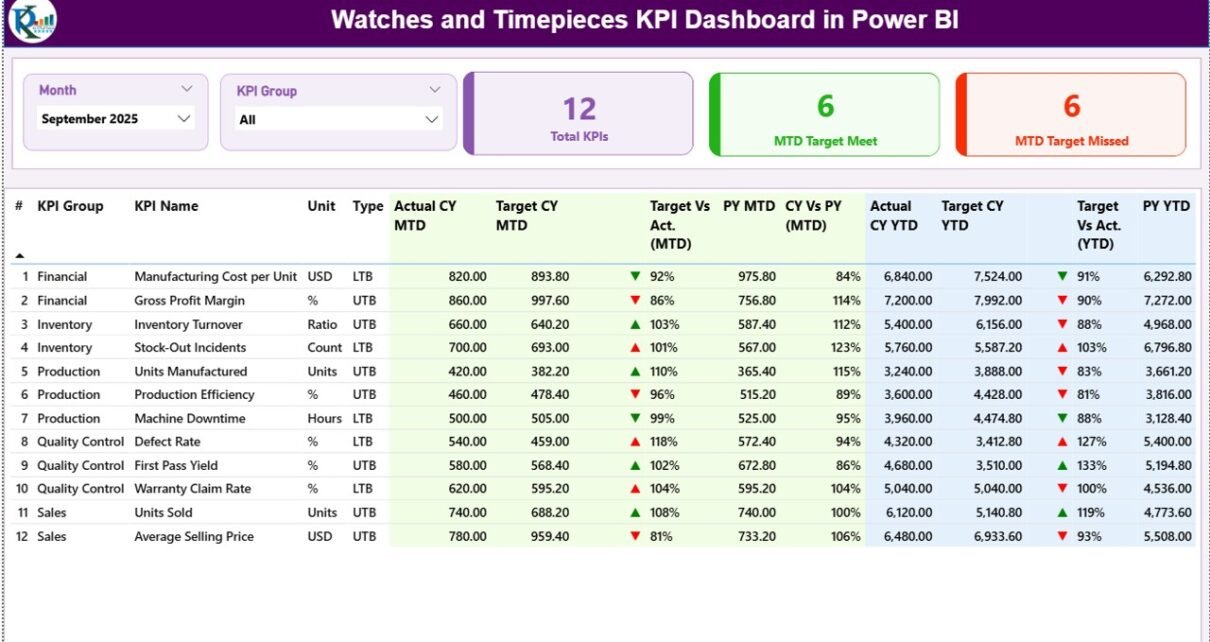
Watches and Timepieces KPI Dashboard in Power BI

February 8, 2026February 8, 2026 PKComments Off on Watches and Timepieces KPI Dashboard in Power BI
The watches and timepieces industry moves fast. Trends change every season. Customer preferences shift quickly. Luxury buyers expect premium quality. Meanwhile, mass-market customers focus on price and value. Therefore, watch
Read More
Dashboard Power BI

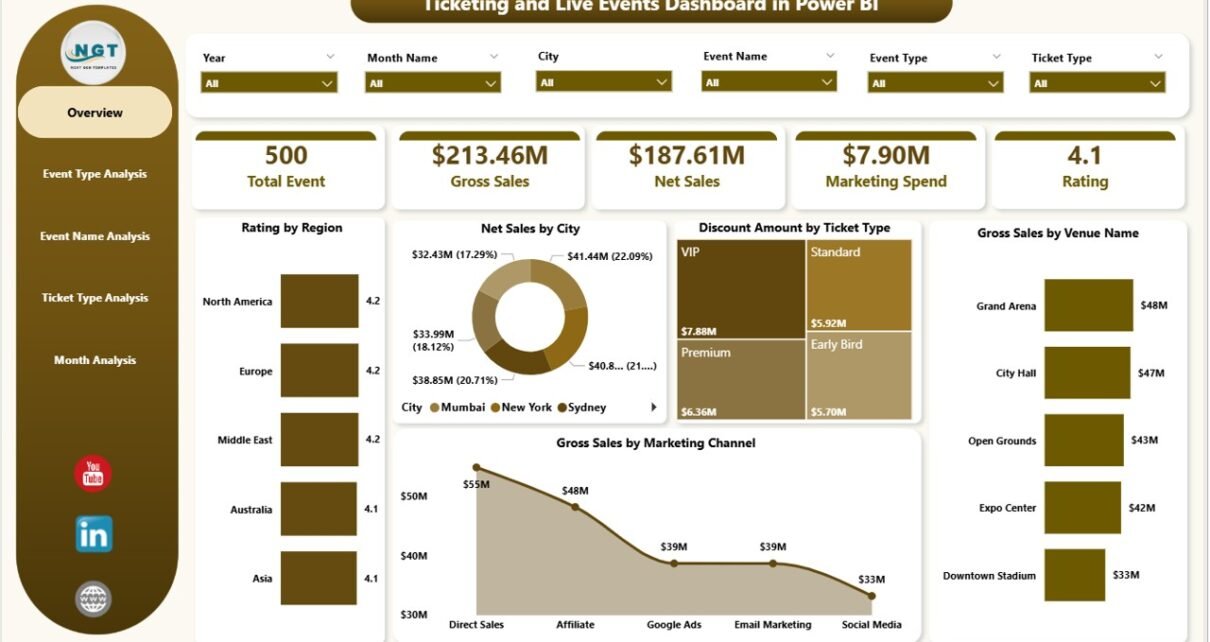
Ticketing and Live Events Dashboard in Power BI

February 6, 2026February 6, 2026 PKComments Off on Ticketing and Live Events Dashboard in Power BI
The live events industry moves fast. Ticket sales change daily. Marketing campaigns impact revenue instantly. Audience ratings influence future bookings. Therefore, event organizers must track everything in real time. However,
Read More
Dashboard Power BI

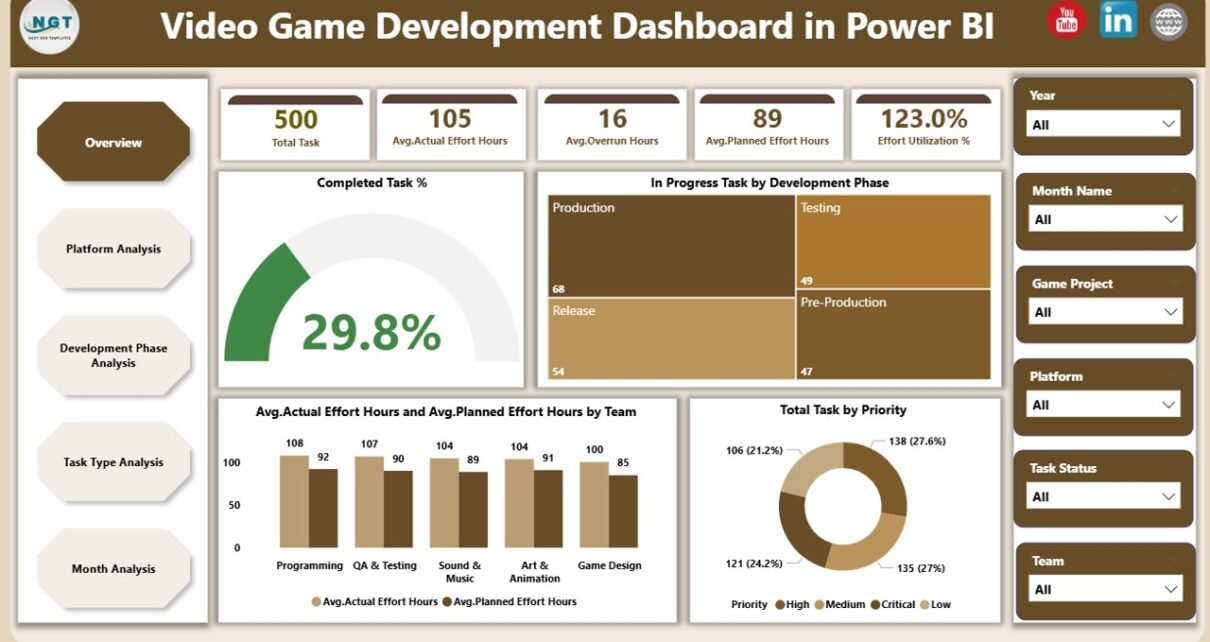
Video Game Development Dashboard in Power BI

February 5, 2026February 5, 2026 PKComments Off on Video Game Development Dashboard in Power BI
The video game industry continues to grow at an extraordinary pace. Game studios now manage complex development pipelines, large creative teams, multiple platforms, tight deadlines, and rising player expectations. However,
Read More
Dashboard Power BI

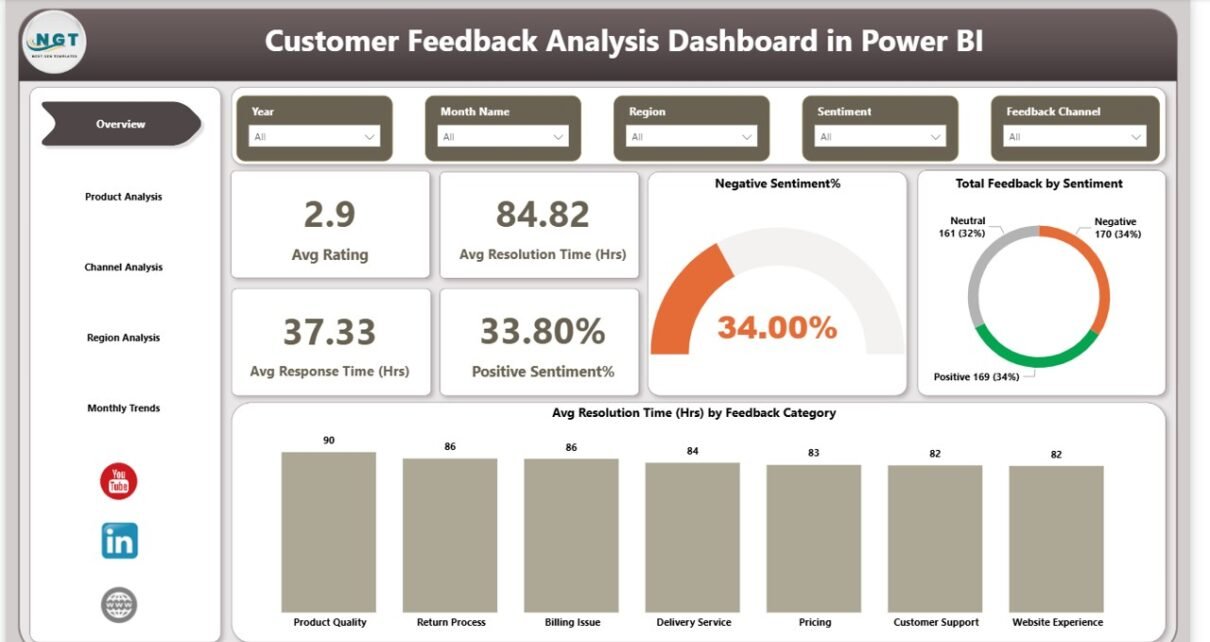
Customer Feedback Analysis Dashboard in Power BI

February 3, 2026February 3, 2026 PKComments Off on Customer Feedback Analysis Dashboard in Power BI
Customer feedback plays a critical role in shaping products, services, and overall customer experience. However, collecting feedback alone does not create value. Instead, businesses must analyze, interpret, and act on
Read More
Dashboard Power BI

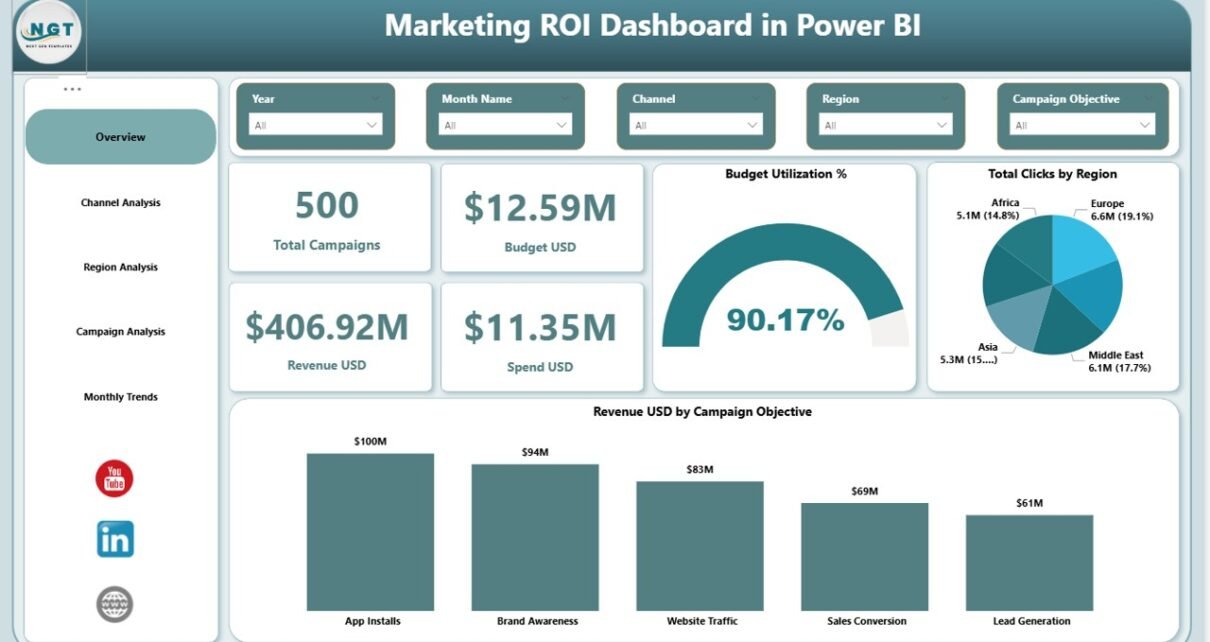
Marketing ROI Dashboard in Power BI

February 2, 2026February 2, 2026 PKComments Off on Marketing ROI Dashboard in Power BI
Marketing teams invest heavily in campaigns, channels, and regions. However, without a clear measurement system, budgets often disappear without clear results. Because of this challenge, organizations now rely on analytics-driven
Read More
Dashboard Power BI

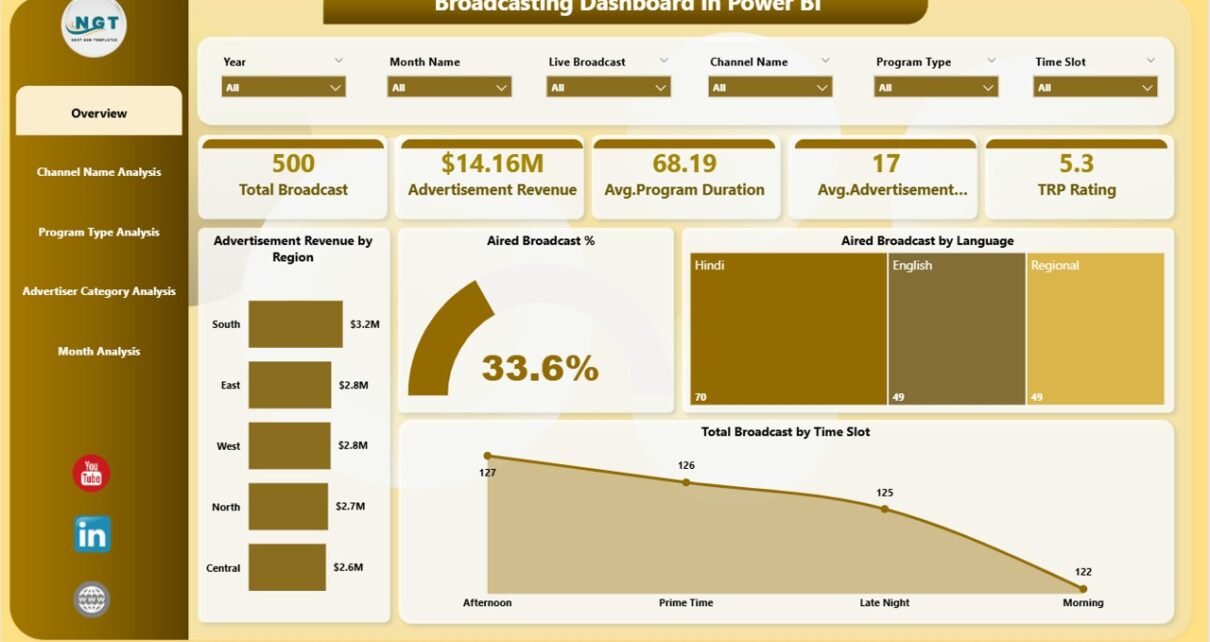
Broadcasting Dashboard in Power BI

February 2, 2026February 2, 2026 PKComments Off on Broadcasting Dashboard in Power BI
Broadcasting businesses operate in a fast-moving and highly competitive environment. Every day, broadcasters manage channels, programs, advertisers, time slots, regions, and revenue streams. However, when teams rely on static reports
Read More
Dashboard Power BI

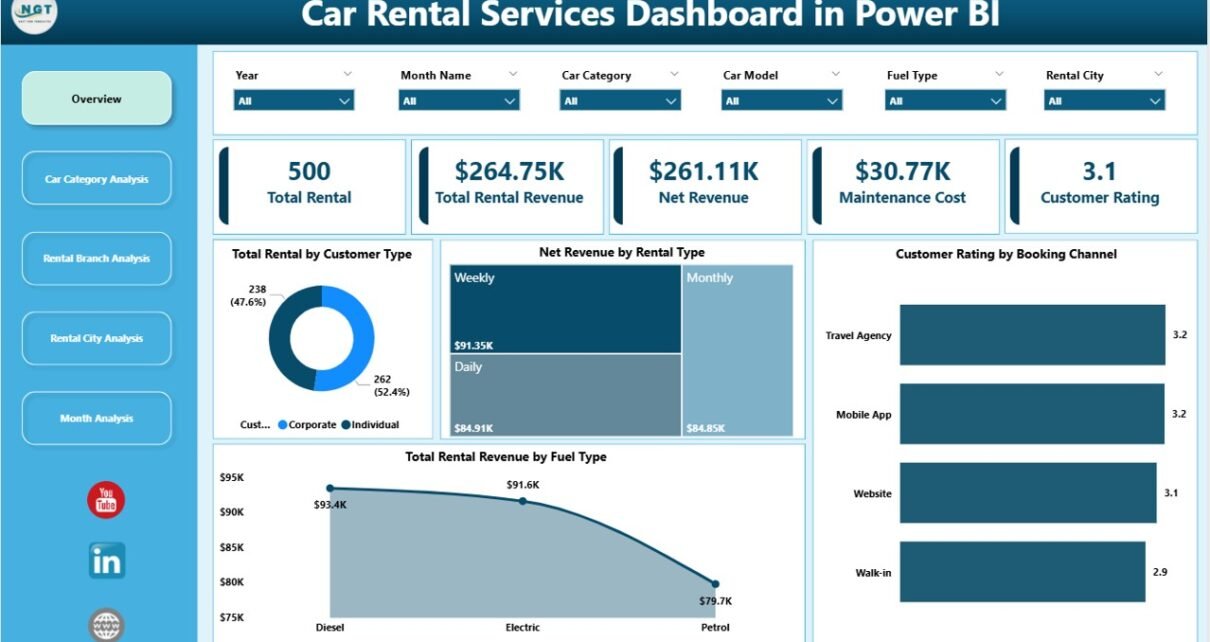
Car Rental Services Dashboard in Power BI

January 31, 2026January 31, 2026 PKComments Off on Car Rental Services Dashboard in Power BI
Managing a car rental business involves more than just renting vehicles. Every day, teams must track rentals, revenue, maintenance costs, customer behavior, and city-wise demand. However, when data remains scattered
Read More

Posts pagination

Previous 1 … 5 6 7 … 13 Next
  • Learn Excel (Free Course)
    • 1. Shortcut Keys
    • 2. Fill & Flash Fill
    • 3. Find & Replace
    • 4. Sort & Filter
    • 5. Formulas & Functions
    • 6. Data Validation
    • 7. Conditional Formatting
    • 8. Basic Charts
    • 9. Advanced Charts
    • 10. Pivot Tables
    • 11. Excel Dashboards
    • 12. VBA Course
    • 13. Excel Formulas with AI
  • Templates
  • Tutorials
    • Charts and Visualization
    • VBA
    • Excel Tips and Tricks
    • Excel Dashboards
    • Power Pivot & DAX
  • Power BI
  • Template Store
    • Ready to Use Templates
  • Courses
  • Academy
    • Excel + AI Mastery: 100 Formulas
    • Excel Pivot Tables & Dashboards
  • About Us
  • Contact Us
Copyright © 2023 PK-AnExcelExpert.com - Privacy Policy