New: NextGenTemplates Academy - video courses on Excel formulas with AI and Pivot Tables & dashboards. Early-bird: 20% off with code EARLYBIRD20 - first 20 orders only. See the courses →
  • Learn Excel (Free Course)
    • 1. Shortcut Keys
    • 2. Fill & Flash Fill
    • 3. Find & Replace
    • 4. Sort & Filter
    • 5. Formulas & Functions
    • 6. Data Validation
    • 7. Conditional Formatting
    • 8. Basic Charts
    • 9. Advanced Charts
    • 10. Pivot Tables
    • 11. Excel Dashboards
    • 12. VBA Course
    • 13. Excel Formulas with AI
  • Templates
  • Tutorials
    • Charts and Visualization
    • VBA
    • Excel Tips and Tricks
    • Excel Dashboards
    • Power Pivot & DAX
  • Power BI
  • Template Store
    • Ready to Use Templates
  • Courses
  • Academy
    • Excel + AI Mastery: 100 Formulas
    • Excel Pivot Tables & Dashboards
  • About Us
  • Contact Us

PK: An Excel Expert

Transforming Data into Decisions
Tag: Power BI Templates

Dashboard Power BI

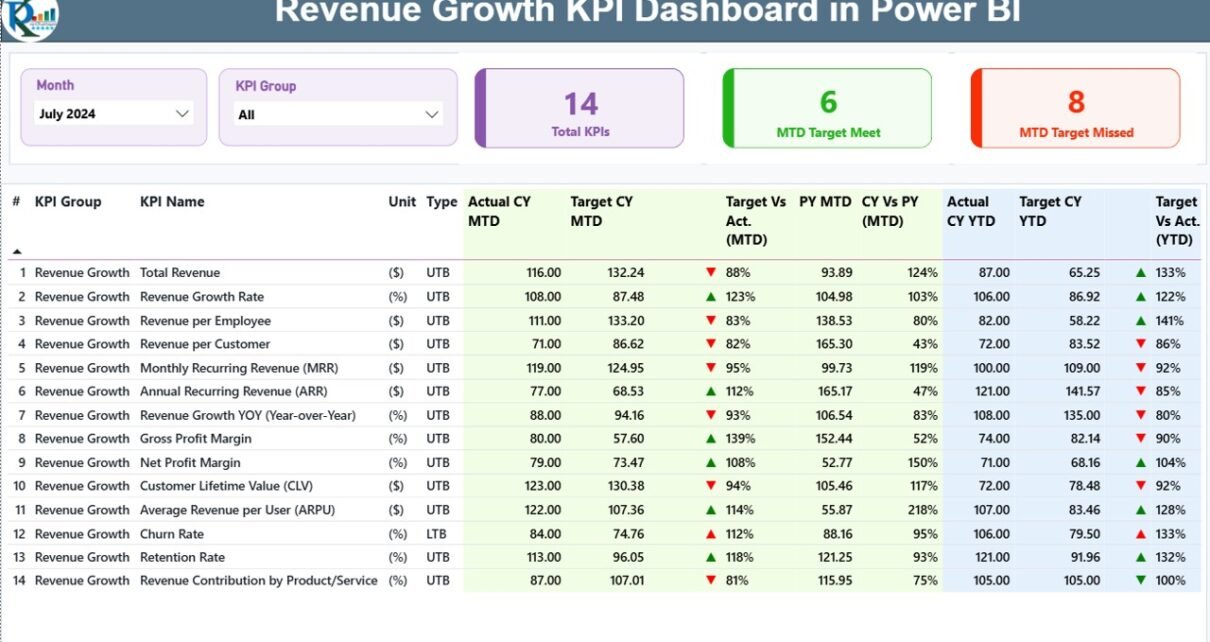
Revenue Growth KPI Dashboard in Power BI

December 3, 2025December 3, 2025 PKComments Off on Revenue Growth KPI Dashboard in Power BI
Businesses need fast and clear insights to grow their revenue. Sales change every month, new products enter the market, customer behaviour shifts often, and marketing teams run many campaigns. Because
Read More
Dashboard Power BI

Water Utilities KPI Dashboard in Power BI

December 3, 2025December 3, 2025 PKComments Off on Water Utilities KPI Dashboard in Power BI
Managing water utilities demands accuracy, speed, and complete visibility. Teams monitor water production, distribution, losses, energy usage, quality, billing, and operational efficiency every day. When the data stays in different
Read More
Dashboard Power BI

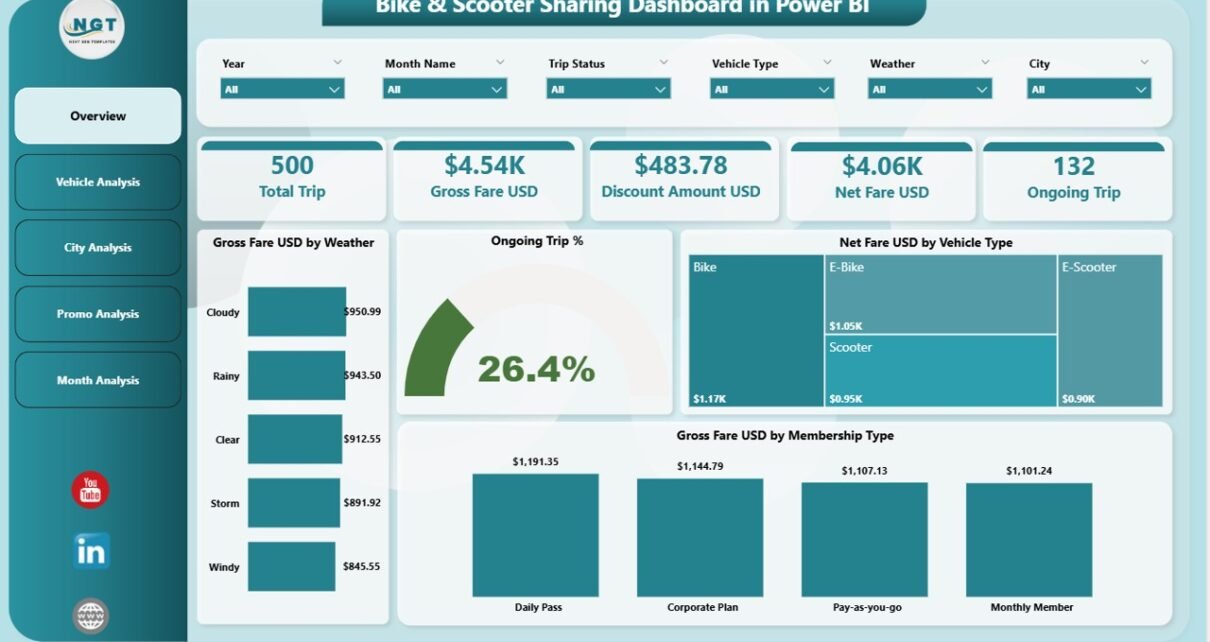
Bike & Scooter Sharing Dashboard in Power BI

December 2, 2025December 2, 2025 PKComments Off on Bike & Scooter Sharing Dashboard in Power BI
Urban mobility changes rapidly, and bike and scooter sharing systems continue to grow across major cities. Operators handle huge volumes of trip data every hour—weather conditions, membership types, trip durations,
Read More
Dashboard Power BI

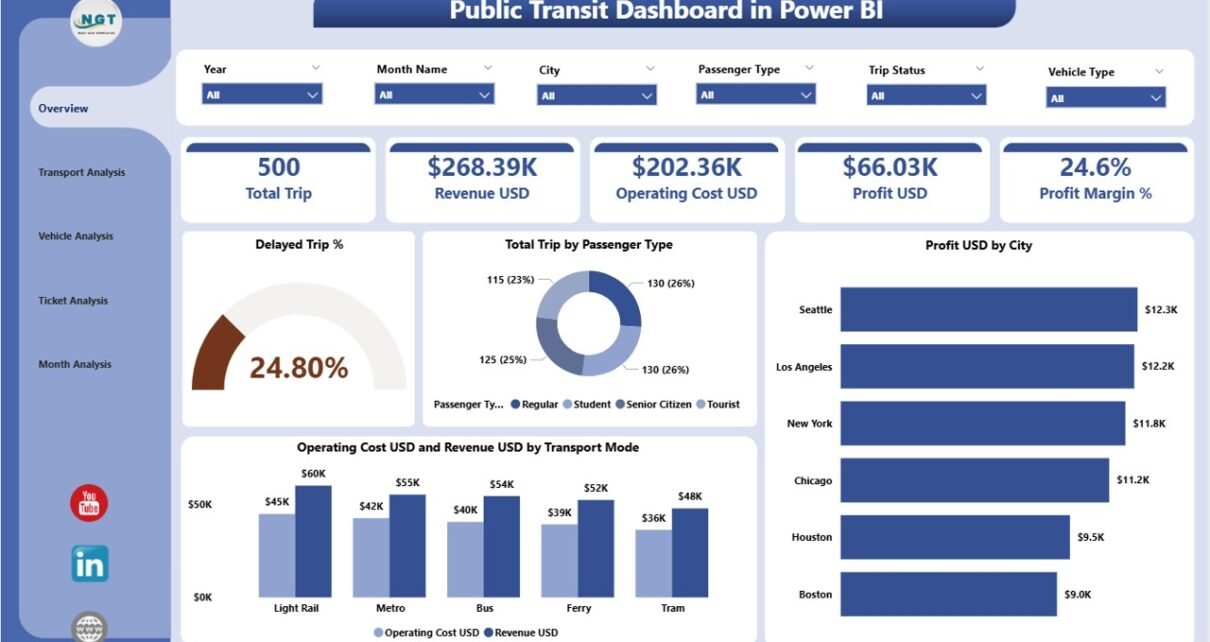
Public Transit Dashboard in Power BI

December 2, 2025December 2, 2025 PKComments Off on Public Transit Dashboard in Power BI
Public transportation systems play a big role in supporting modern cities. As more people depend on buses, trains, metros, ferries, and other transport modes, city authorities and transit operators need
Read More
Dashboard Power BI

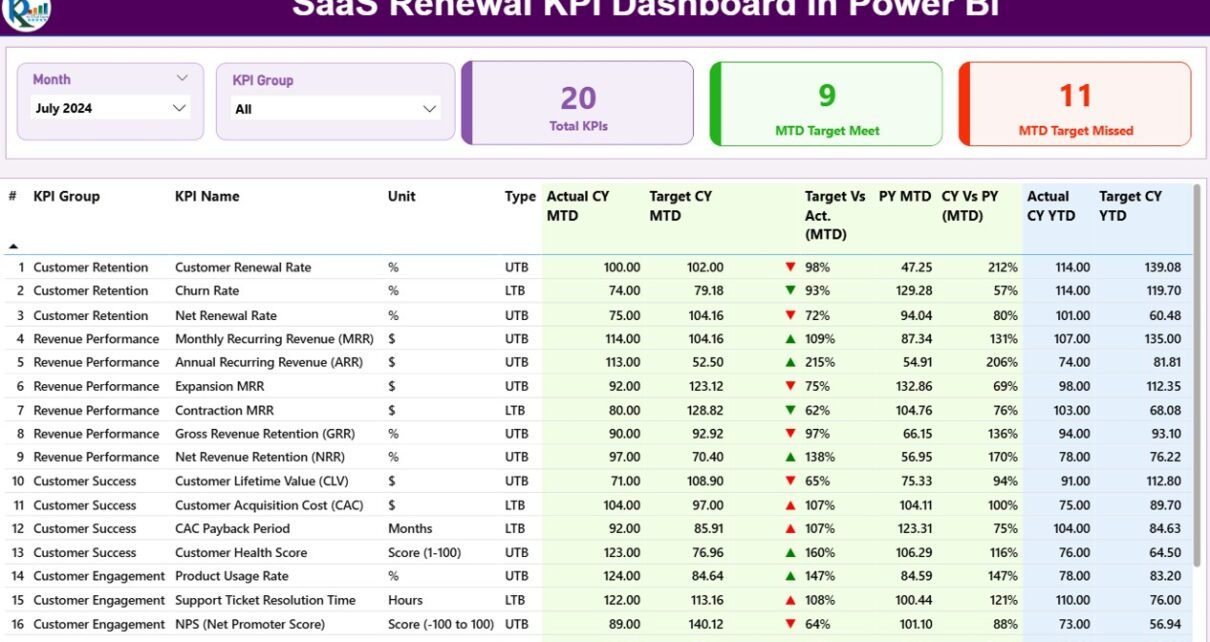
SaaS Renewal KPI Dashboard in Power BI

December 2, 2025December 2, 2025 PKComments Off on SaaS Renewal KPI Dashboard in Power BI
Software-as-a-Service (SaaS) companies work in a fast, competitive market. Customers expect reliable service, constant improvements, and smooth experiences. Because of this, SaaS companies must measure performance continuously. Renewal rates, churn
Read More
Templates

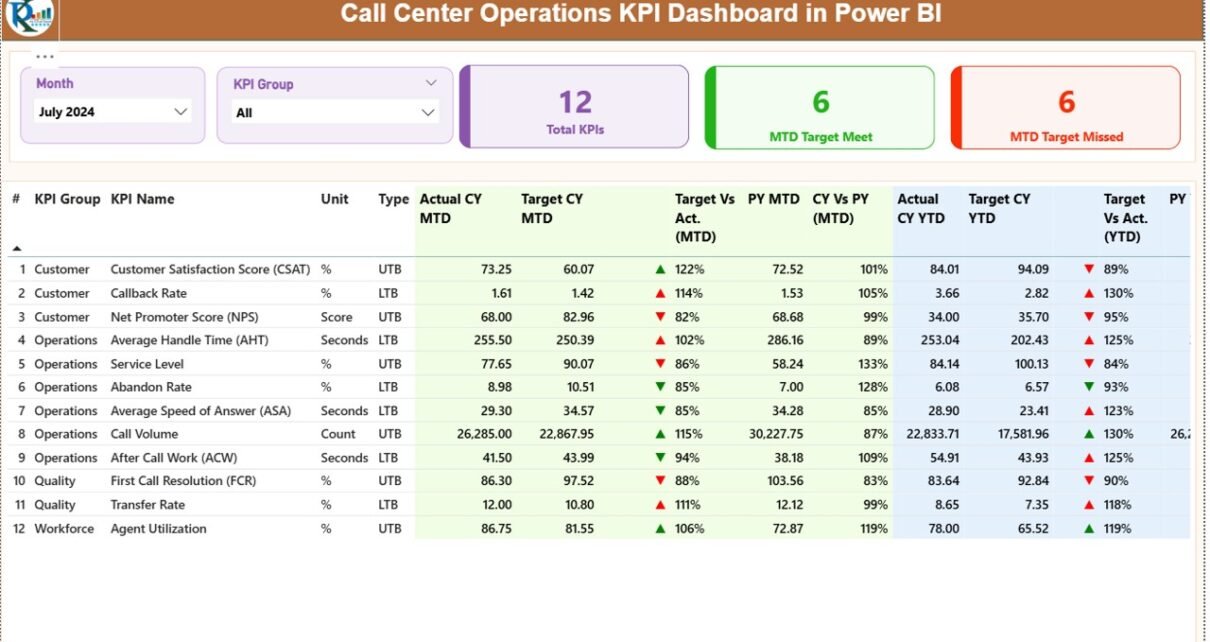
Call Center Operations KPI Dashboard in Power BI

December 1, 2025December 1, 2025 PKComments Off on Call Center Operations KPI Dashboard in Power BI
Managing a call center demands constant monitoring, fast decisions, and instant access to accurate performance data. Call volumes change every hour, customers expect quick resolutions, and managers need a real-time
Read More
Dashboard Power BI

Shipping & Cargo Dashboard in Power BI

December 1, 2025December 1, 2025 PKComments Off on Shipping & Cargo Dashboard in Power BI
Efficient shipping and cargo operations matter more than ever. Logistics companies manage thousands of shipments, multiple ports, many customer types, and a long list of operational costs. As the data
Read More
Dashboard Power BI

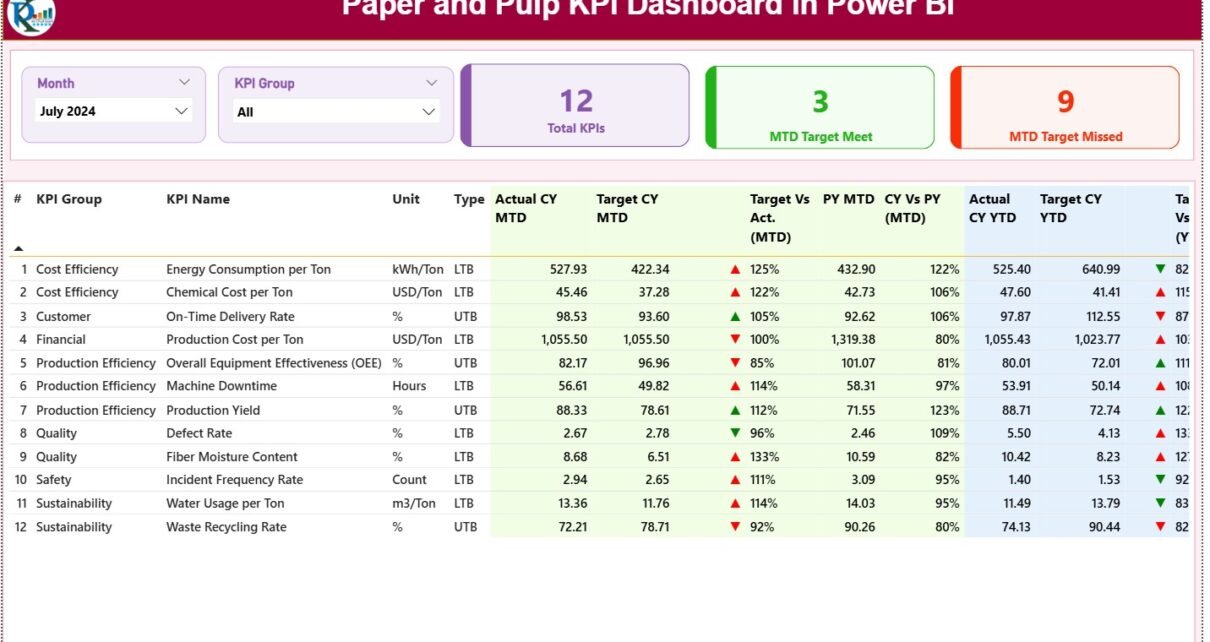
Paper and Pulp KPI Dashboard in Power BI

December 1, 2025December 1, 2025 PKComments Off on Paper and Pulp KPI Dashboard in Power BI
The paper and pulp industry runs on high production pressure, strict quality requirements, and continuous improvement. Every department works with large volumes of data—from production output and fiber loss to
Read More
Dashboard Power BI

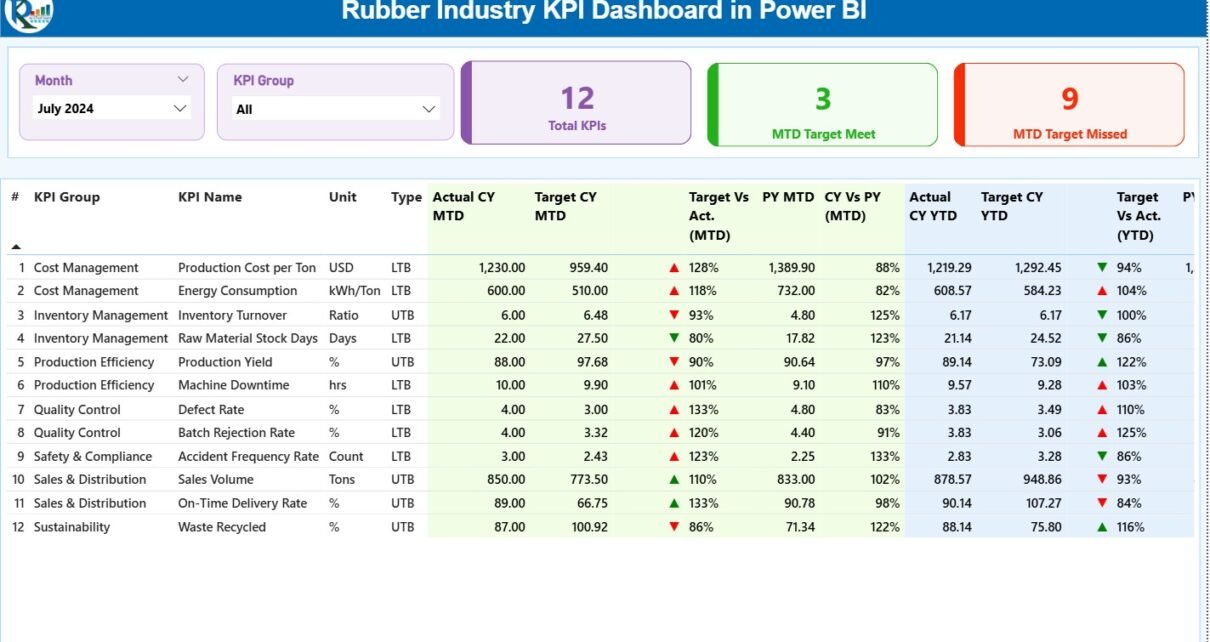
Rubber Industry KPI Dashboard in Power BI

December 1, 2025December 1, 2025 PKComments Off on Rubber Industry KPI Dashboard in Power BI
The rubber manufacturing industry runs on speed, accuracy, and continuous improvement. Production teams try to increase throughput, quality teams need to control defects, maintenance teams monitor machine health, and management
Read More
Templates

Textiles & Apparel Manufacturing KPI Dashboard in Power BI

November 30, 2025November 30, 2025 PKComments Off on Textiles & Apparel Manufacturing KPI Dashboard in Power BI
The textiles and apparel industry moves quickly and demands accurate decisions at every stage. Production teams try to meet deadlines, quality teams monitor defects, and management expects real-time performance updates.
Read More

Posts pagination

Previous 1 … 18 19 20 … 32 Next
  • Learn Excel (Free Course)
    • 1. Shortcut Keys
    • 2. Fill & Flash Fill
    • 3. Find & Replace
    • 4. Sort & Filter
    • 5. Formulas & Functions
    • 6. Data Validation
    • 7. Conditional Formatting
    • 8. Basic Charts
    • 9. Advanced Charts
    • 10. Pivot Tables
    • 11. Excel Dashboards
    • 12. VBA Course
    • 13. Excel Formulas with AI
  • Templates
  • Tutorials
    • Charts and Visualization
    • VBA
    • Excel Tips and Tricks
    • Excel Dashboards
    • Power Pivot & DAX
  • Power BI
  • Template Store
    • Ready to Use Templates
  • Courses
  • Academy
    • Excel + AI Mastery: 100 Formulas
    • Excel Pivot Tables & Dashboards
  • About Us
  • Contact Us
Copyright © 2023 PK-AnExcelExpert.com - Privacy Policy