New: NextGenTemplates Academy - video courses on Excel formulas with AI and Pivot Tables & dashboards. Early-bird: 20% off with code EARLYBIRD20 - first 20 orders only. See the courses →
  • Learn Excel (Free Course)
    • 1. Shortcut Keys
    • 2. Fill & Flash Fill
    • 3. Find & Replace
    • 4. Sort & Filter
    • 5. Formulas & Functions
    • 6. Data Validation
    • 7. Conditional Formatting
    • 8. Basic Charts
    • 9. Advanced Charts
    • 10. Pivot Tables
    • 11. Excel Dashboards
    • 12. VBA Course
    • 13. Excel Formulas with AI
  • Templates
  • Tutorials
    • Charts and Visualization
    • VBA
    • Excel Tips and Tricks
    • Excel Dashboards
    • Power Pivot & DAX
  • Power BI
  • Template Store
    • Ready to Use Templates
  • Courses
  • Academy
    • Excel + AI Mastery: 100 Formulas
    • Excel Pivot Tables & Dashboards
  • About Us
  • Contact Us

PK: An Excel Expert

Transforming Data into Decisions

Tag: Production Analytics

Dashboard

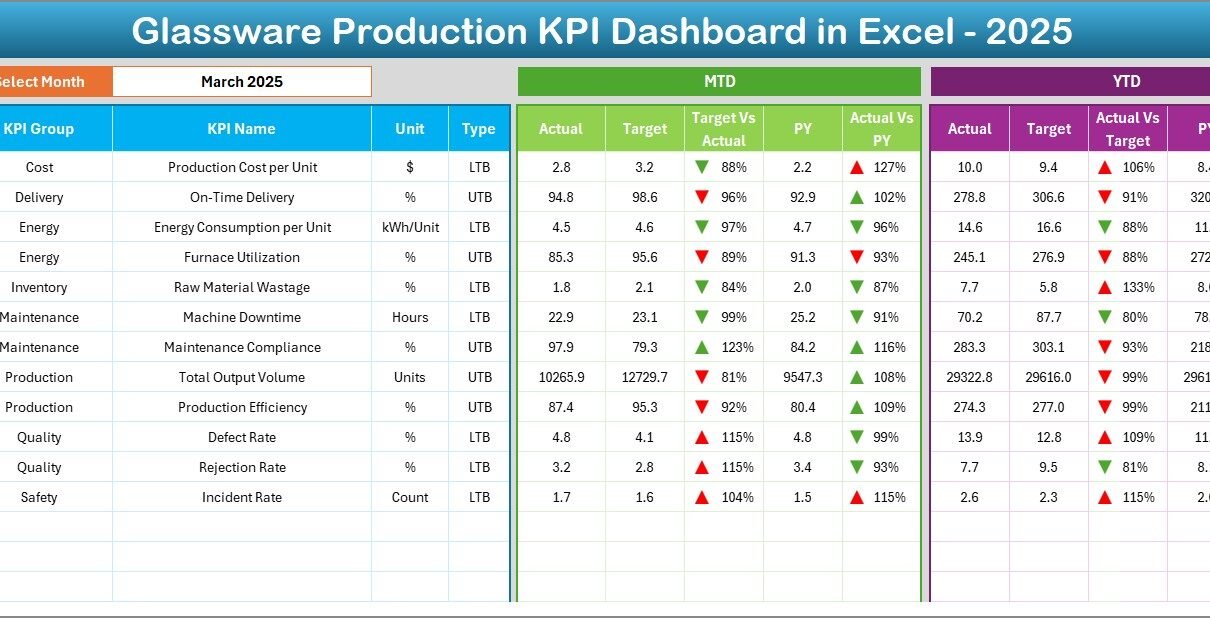
Glassware Production KPI Dashboard in Excel

February 27, 2026February 27, 2026 PKComments Off on Glassware Production KPI Dashboard in Excel
In today’s competitive manufacturing environment, glassware production companies must monitor performance closely to maintain quality, reduce waste, and improve operational efficiency. Manufacturers continuously face challenges such as production losses, quality
Read More
Dashboard Power BI

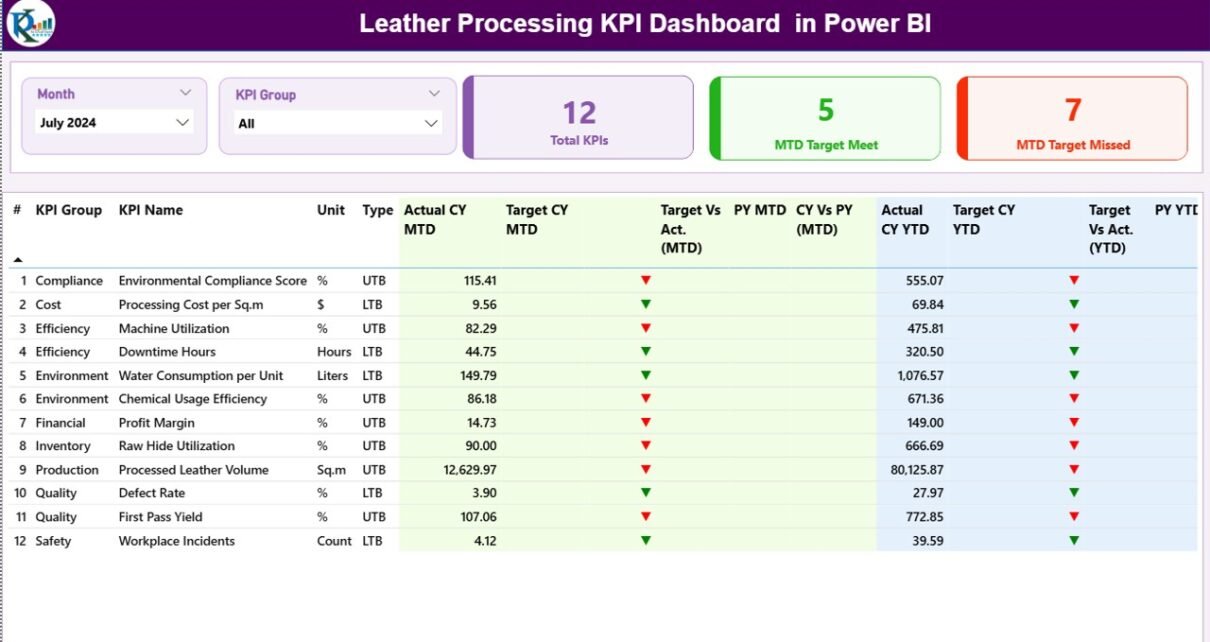
Leather Processing KPI Dashboard in Power BI

February 24, 2026February 24, 2026 PKComments Off on Leather Processing KPI Dashboard in Power BI
The leather industry plays a vital role in global manufacturing. Companies process raw hides into finished leather products used in footwear, furniture, automotive interiors, garments, and accessories. However, leather processing
Read More
Dashboard Power BI

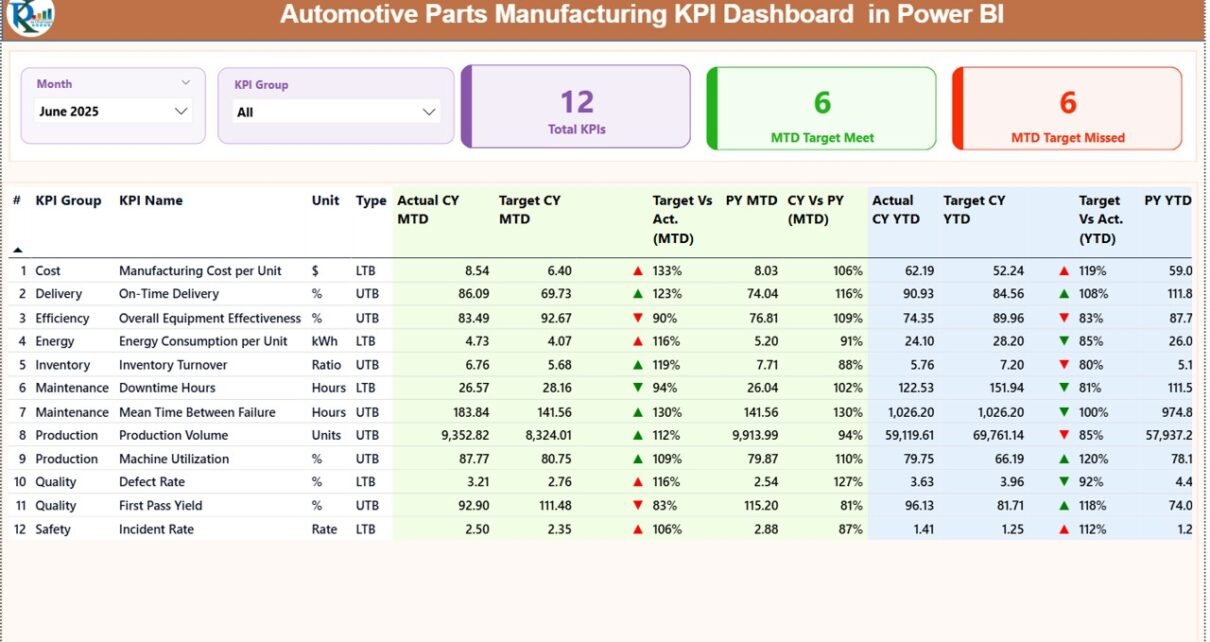
Automotive Parts Manufacturing KPI Dashboard in Power BI

February 22, 2026February 22, 2026 PKComments Off on Automotive Parts Manufacturing KPI Dashboard in Power BI
The automotive parts manufacturing industry depends heavily on efficiency, precision, and continuous improvement. Every production unit must monitor machine performance, quality standards, production output, operational costs, and delivery timelines. Therefore,
Read More
Dashboard Power BI

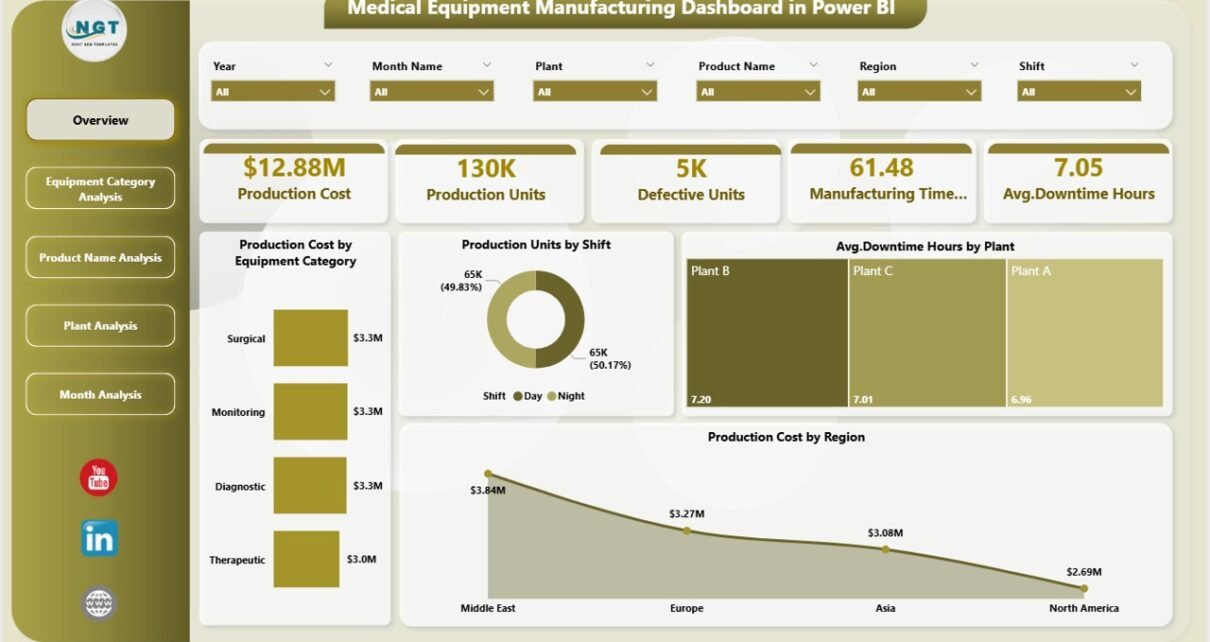
Medical Equipment Manufacturing Dashboard in Power BI

January 20, 2026January 20, 2026 PKComments Off on Medical Equipment Manufacturing Dashboard in Power BI
The medical equipment manufacturing industry runs on precision, compliance, and performance. Every delay, defect, or cost overrun directly affects patient safety, regulatory adherence, and profitability. Because of this, manufacturers must
Read More
Dashboard Power BI

Refinery Dashboard in Power BI

January 3, 2026January 3, 2026 PKComments Off on Refinery Dashboard in Power BI
Managing a refinery involves thousands of daily decisions. Leaders must control costs, reduce downtime, optimize energy usage, and increase output at the same time. However, when teams rely on scattered
Read More
Dashboard Power BI

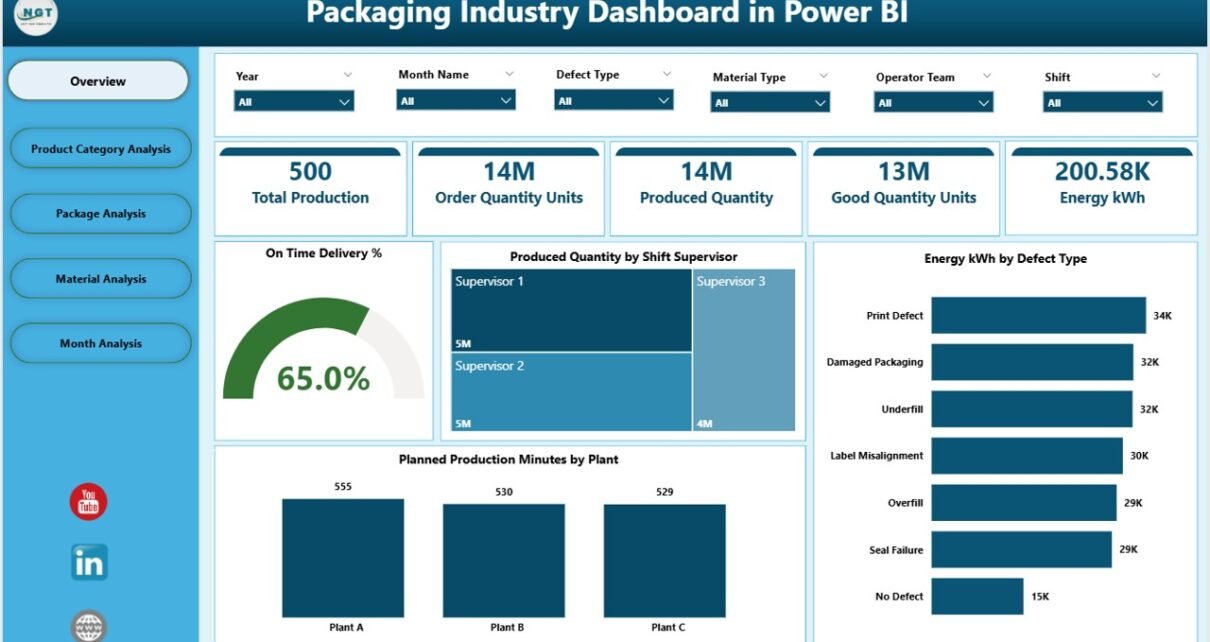
Packaging Industry Dashboard in Power BI

December 11, 2025December 11, 2025 PKComments Off on Packaging Industry Dashboard in Power BI
The packaging industry runs on speed, accuracy, and real-time decision-making. Every day, teams monitor production volumes, energy usage, material performance, defect levels, and delivery timelines. When managers track these KPIs
Read More
Dashboard Power BI

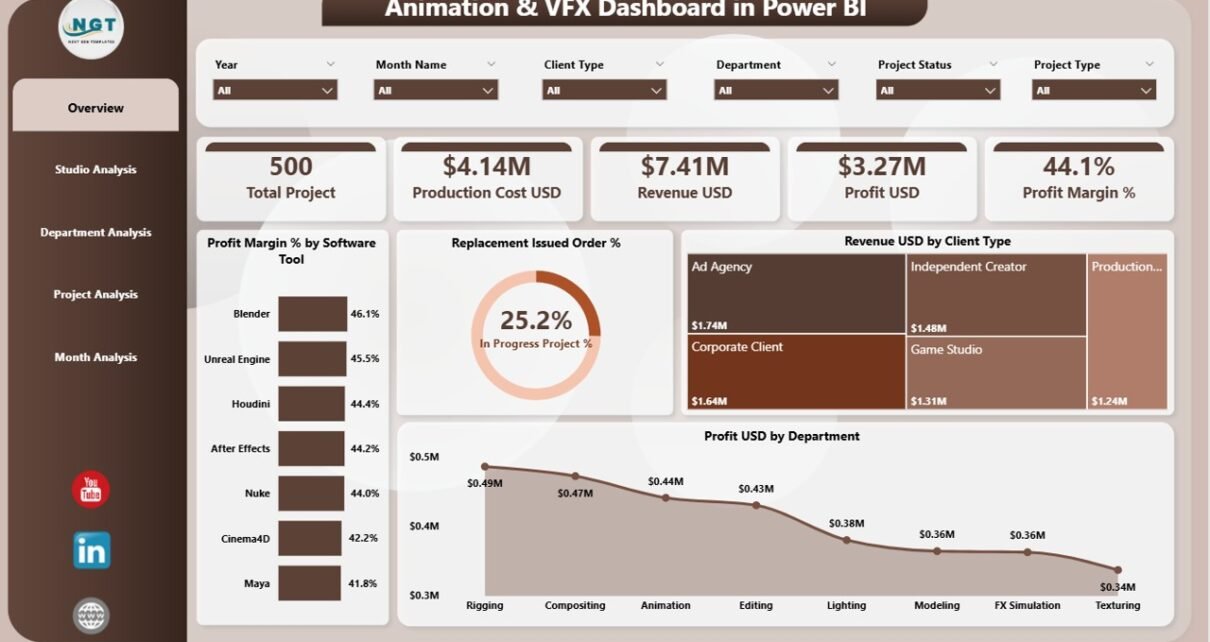
Animation & VFX Dashboard in Power BI

December 4, 2025December 4, 2025 PKComments Off on Animation & VFX Dashboard in Power BI
The animation and VFX industry grows every year because global demand for digital content keeps rising. However, studios face many challenges such as complex workflows, tight deadlines, high production costs,
Read More
Dashboard

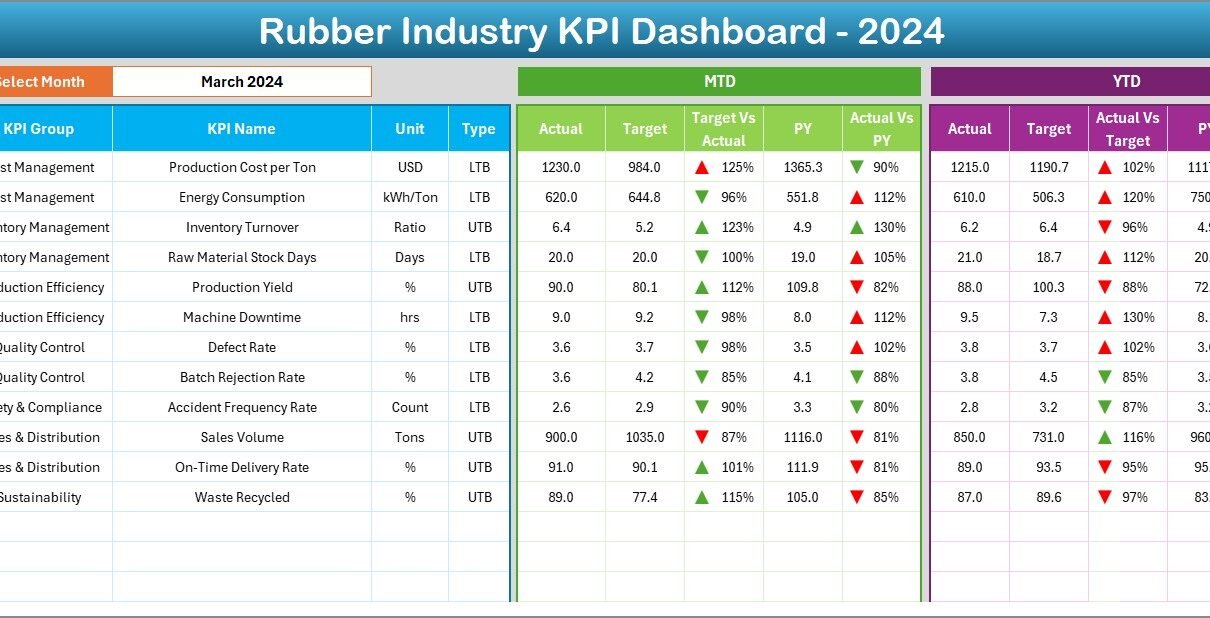
Rubber Industry KPI Dashboard in Excel

November 11, 2025November 11, 2025 PKComments Off on Rubber Industry KPI Dashboard in Excel
The rubber industry plays a critical role in manufacturing, automotive, and industrial supply chains worldwide. However, monitoring production, quality, and financial performance can become complex without a structured approach. That’s
Read More
Templates

Manufacturing KPI Dashboard in Power BI

November 8, 2025November 8, 2025 PKComments Off on Manufacturing KPI Dashboard in Power BI
In today’s competitive manufacturing world, data is the key driver of efficiency, profitability, and decision-making. Every process — from production and inventory to quality control and delivery — generates valuable
Read More
Power BI

Film Production KPI Dashboard in Power BI

January 29, 2025March 31, 2025 PKComments Off on Film Production KPI Dashboard in Power BI
The Film Production KPI Dashboard in Power BI is a powerful tool that helps film production companies track, analyze, and optimize key performance indicators (KPIs) for their projects. With real-time
Read More

Posts pagination

Previous 1 2
  • Learn Excel (Free Course)
    • 1. Shortcut Keys
    • 2. Fill & Flash Fill
    • 3. Find & Replace
    • 4. Sort & Filter
    • 5. Formulas & Functions
    • 6. Data Validation
    • 7. Conditional Formatting
    • 8. Basic Charts
    • 9. Advanced Charts
    • 10. Pivot Tables
    • 11. Excel Dashboards
    • 12. VBA Course
    • 13. Excel Formulas with AI
  • Templates
  • Tutorials
    • Charts and Visualization
    • VBA
    • Excel Tips and Tricks
    • Excel Dashboards
    • Power Pivot & DAX
  • Power BI
  • Template Store
    • Ready to Use Templates
  • Courses
  • Academy
    • Excel + AI Mastery: 100 Formulas
    • Excel Pivot Tables & Dashboards
  • About Us
  • Contact Us
Copyright © 2023 PK-AnExcelExpert.com - Privacy Policy