New: NextGenTemplates Academy - video courses on Excel formulas with AI and Pivot Tables & dashboards. Early-bird: 20% off with code EARLYBIRD20 - first 20 orders only. See the courses →
  • Learn Excel (Free Course)
    • 1. Shortcut Keys
    • 2. Fill & Flash Fill
    • 3. Find & Replace
    • 4. Sort & Filter
    • 5. Formulas & Functions
    • 6. Data Validation
    • 7. Conditional Formatting
    • 8. Basic Charts
    • 9. Advanced Charts
    • 10. Pivot Tables
    • 11. Excel Dashboards
    • 12. VBA Course
    • 13. Excel Formulas with AI
  • Templates
  • Tutorials
    • Charts and Visualization
    • VBA
    • Excel Tips and Tricks
    • Excel Dashboards
    • Power Pivot & DAX
  • Power BI
  • Template Store
    • Ready to Use Templates
  • Courses
  • Academy
    • Excel + AI Mastery: 100 Formulas
    • Excel Pivot Tables & Dashboards
  • About Us
  • Contact Us

PK: An Excel Expert

Transforming Data into Decisions

Tag: Project Performance Dashboard

Dashboard

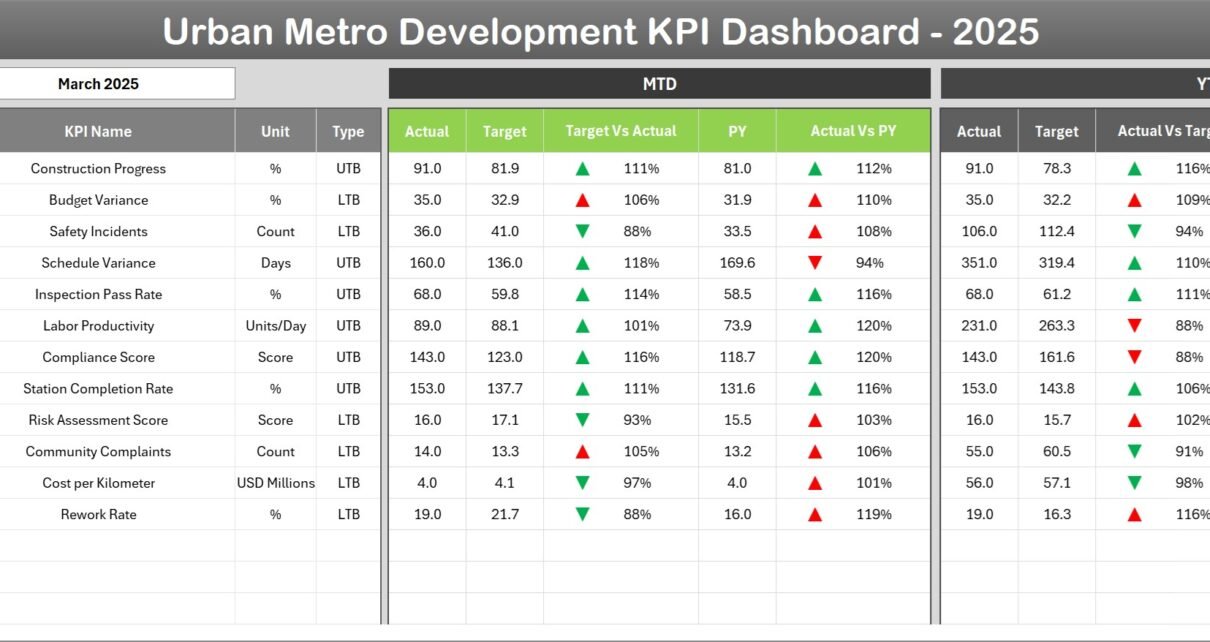
Urban Metro Development KPI Dashboard in Excel

March 8, 2026March 8, 2026 PKComments Off on Urban Metro Development KPI Dashboard in Excel
Urban metro systems play a crucial role in modern cities. As urban populations grow rapidly, governments and transportation authorities must manage complex metro infrastructure projects efficiently. These projects involve multiple
Read More
Dashboard Power BI

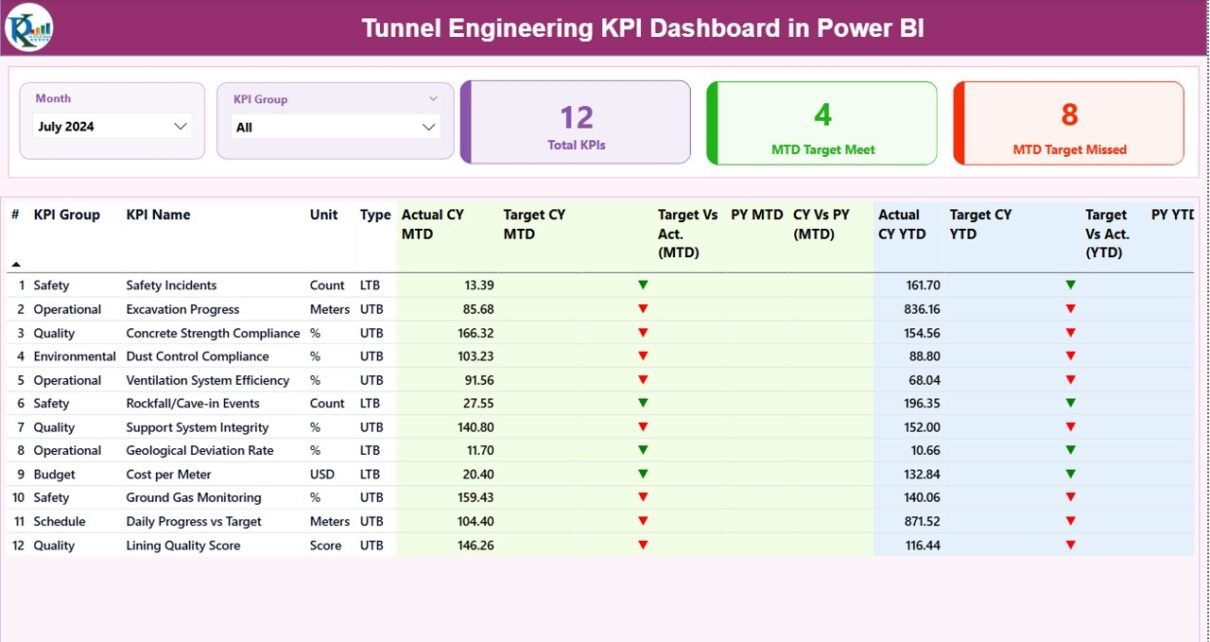
Tunnel Engineering KPI Dashboard in Power BI

March 7, 2026March 7, 2026 PKComments Off on Tunnel Engineering KPI Dashboard in Power BI
Tunnel engineering projects require precise planning, strict safety monitoring, and continuous performance tracking. Engineers, project managers, and infrastructure authorities must monitor dozens of operational metrics every day. However, many organizations
Read More
Dashboard Power BI

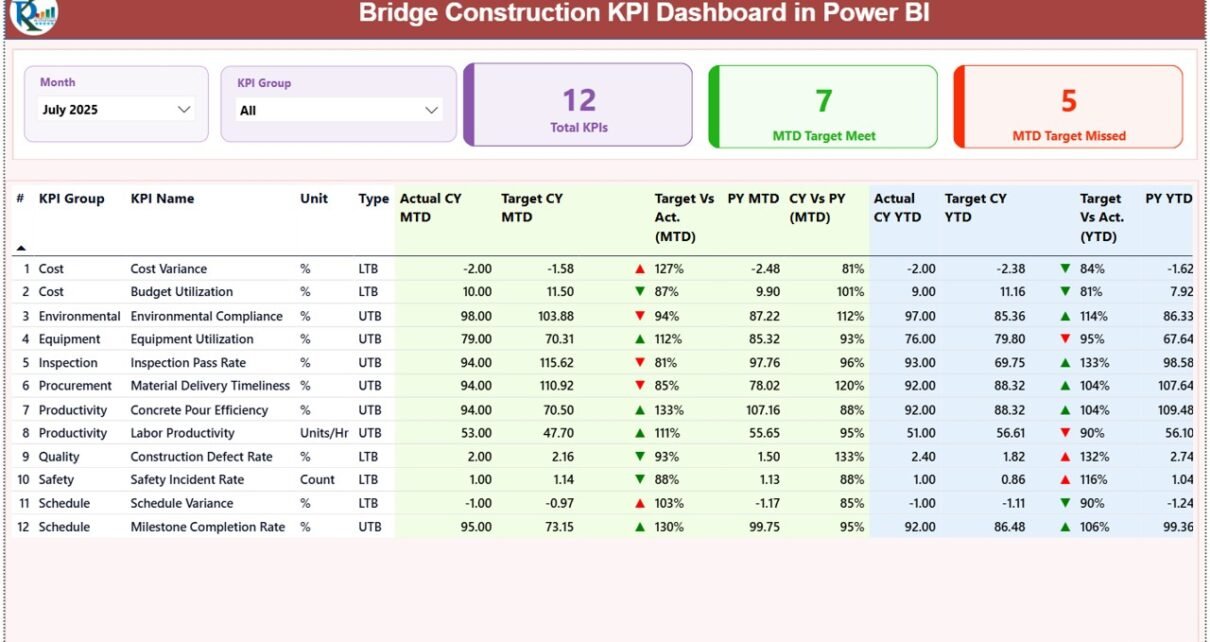
Bridge Construction KPI Dashboard in Power BI

March 6, 2026March 6, 2026 PKComments Off on Bridge Construction KPI Dashboard in Power BI
Bridge construction projects require precise planning, strict monitoring, and continuous performance tracking. However, many construction companies still rely on scattered spreadsheets and manual reports. As a result, project managers often
Read More
Dashboard Power BI

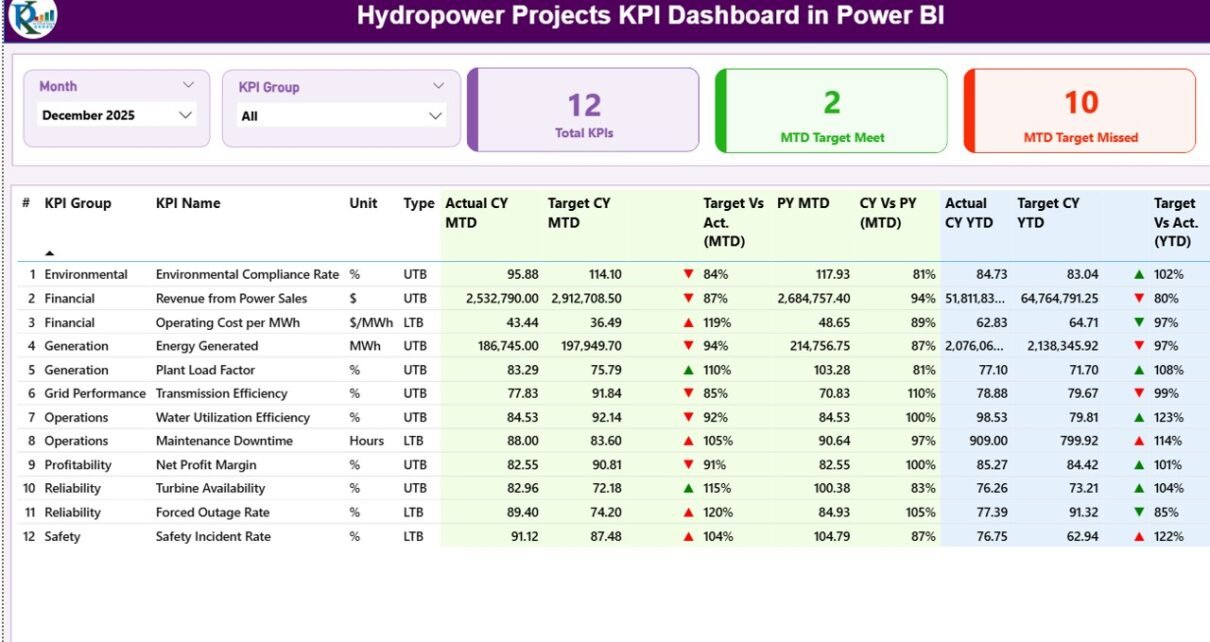
Hydropower Projects KPI Dashboard in Power BI

March 2, 2026March 2, 2026 PKComments Off on Hydropower Projects KPI Dashboard in Power BI
Hydropower projects play a vital role in renewable energy generation across the world. However, managing hydropower operations requires continuous monitoring of performance, efficiency, targets, and operational outcomes. Without structured reporting,
Read More
Dashboard

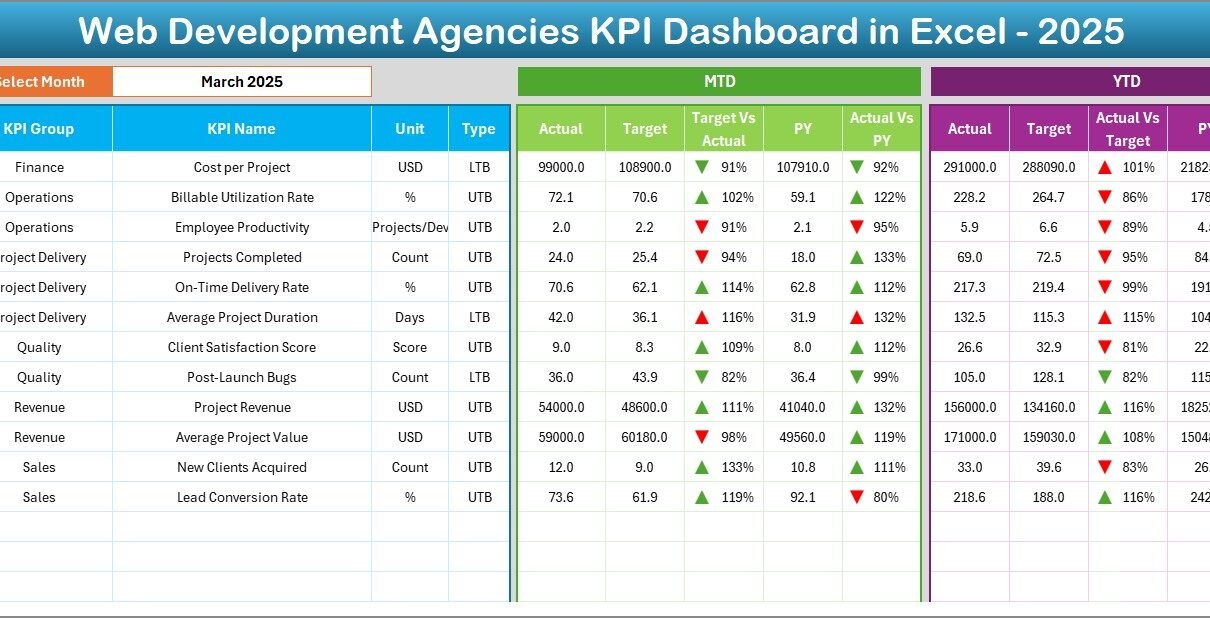
Web Development Agencies KPI Dashboard in Excel

February 17, 2026February 17, 2026 PKComments Off on Web Development Agencies KPI Dashboard in Excel
In today’s fast-moving digital world, web development agencies face intense competition. Clients expect fast delivery. Projects demand quality code. Teams must manage timelines, budgets, and client satisfaction at the same
Read More
Dashboard

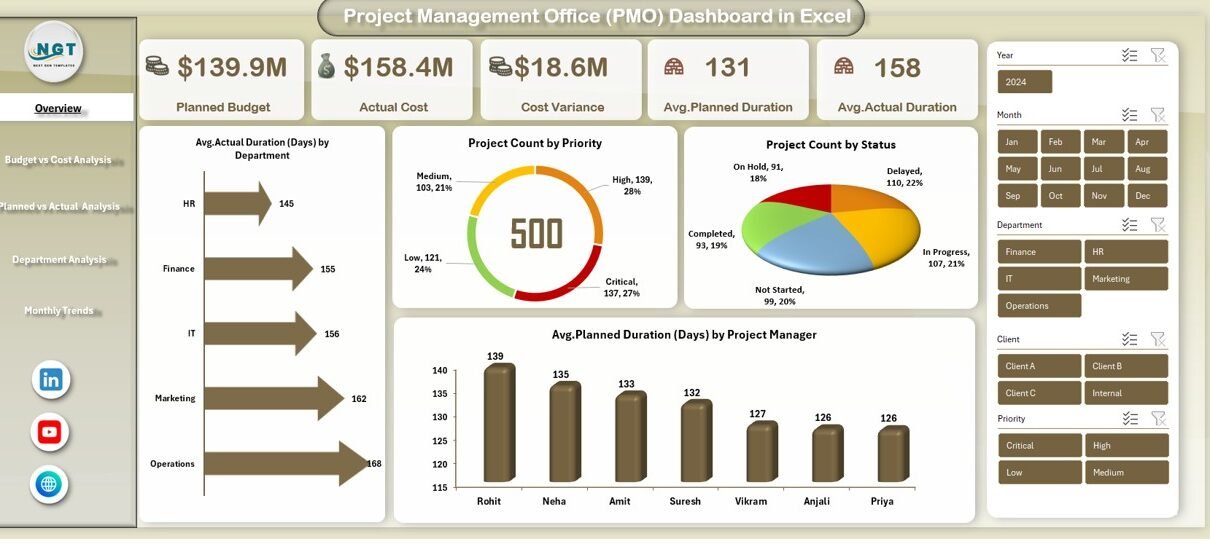
Project Management Office (PMO) Dashboard in Excel

January 13, 2026January 13, 2026 PKComments Off on Project Management Office (PMO) Dashboard in Excel
Managing multiple projects without clear visibility always creates confusion, delays, and cost overruns. Moreover, project managers, PMO heads, and leadership teams constantly struggle to track budgets, timelines, priorities, and performance
Read More
Dashboard Power BI

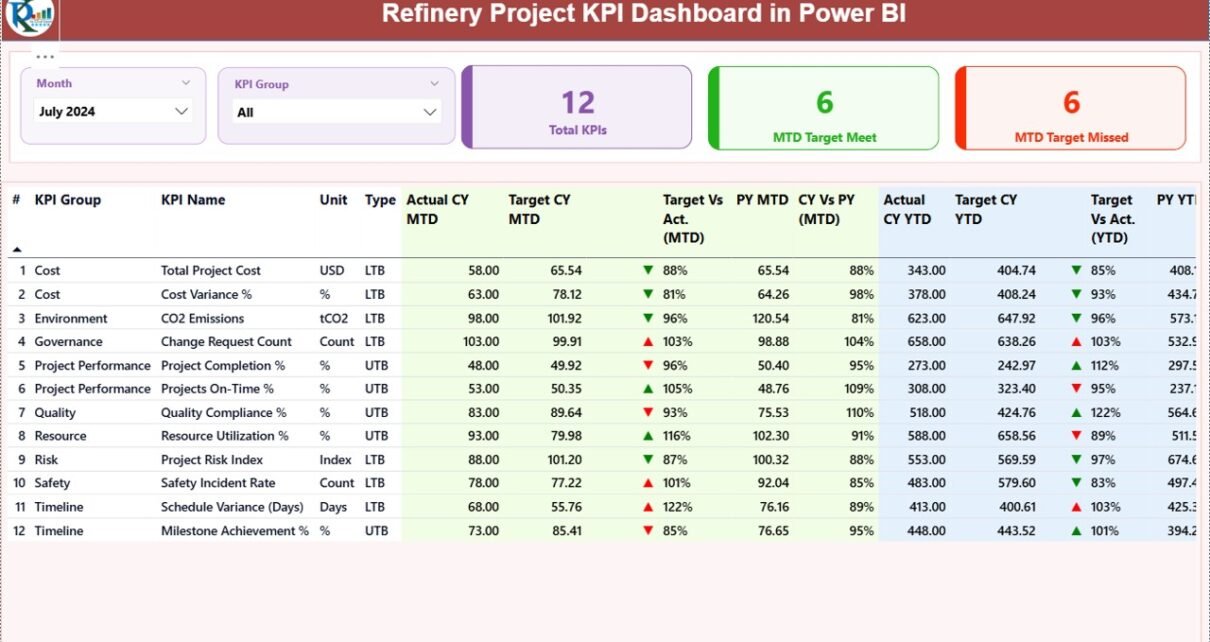
Refinery Project KPI Dashboard in Power BI

December 28, 2025October 10, 2026 PKComments Off on Refinery Project KPI Dashboard in Power BI
Modern refinery projects are complex, capital-intensive, and time-sensitive. Therefore, project managers, engineering teams, and leadership groups must track performance accurately at every stage. However, when teams rely on scattered Excel
Read More
Dashboard Power BI

Smart Cities Project KPI Dashboard in Power BI

December 28, 2025December 28, 2025 PKComments Off on Smart Cities Project KPI Dashboard in Power BI
Managing smart city projects without a structured performance monitoring system often creates delays, cost overruns, and weak accountability. However, modern smart city initiatives involve complex infrastructure projects, multiple stakeholders, public
Read More
Dashboard Power BI

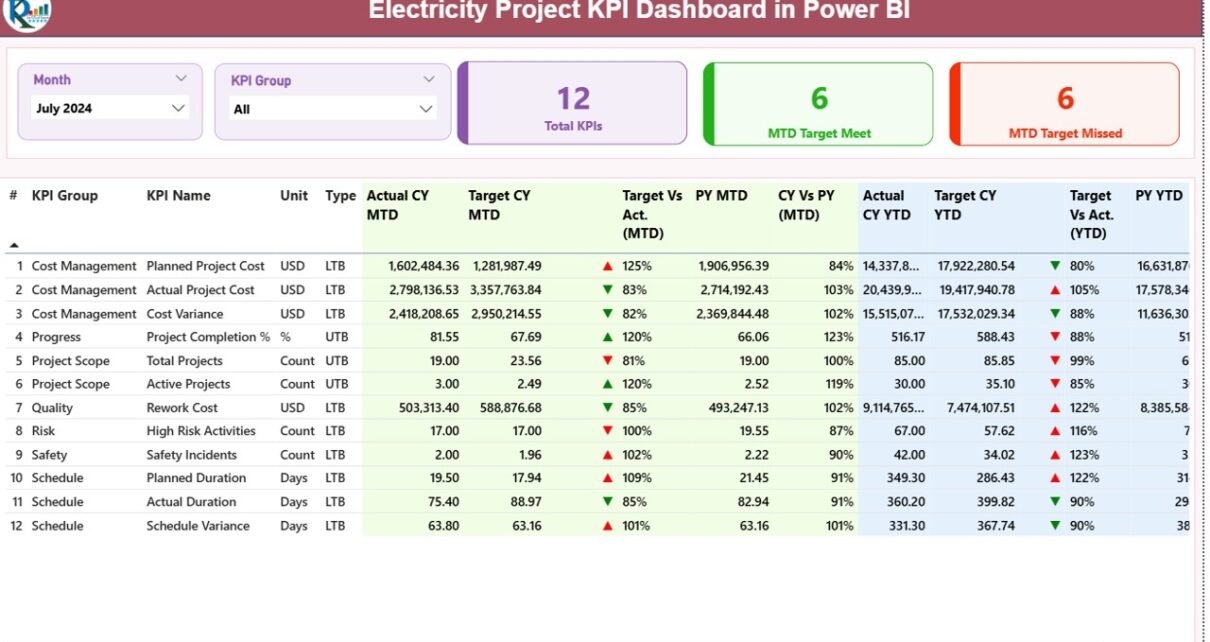
Electricity Project KPI Dashboard in Power BI

December 27, 2025December 27, 2025 PKComments Off on Electricity Project KPI Dashboard in Power BI
Managing electricity projects without clear performance visibility creates serious risks. Electricity projects involve high capital investment, strict timelines, regulatory compliance, and multiple stakeholders. Therefore, even a small deviation in performance
Read More
Dashboard

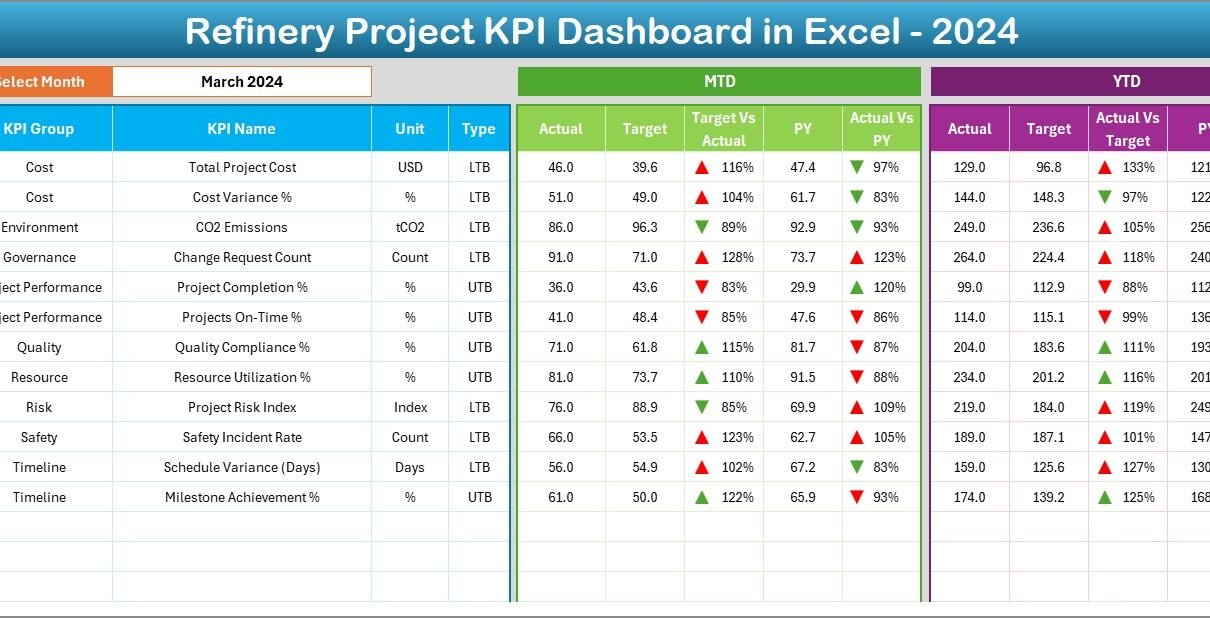
Refinery Project KPI Dashboard in Excel

December 27, 2025December 27, 2025 PKComments Off on Refinery Project KPI Dashboard in Excel
Managing refinery projects always demands precision, visibility, and timely decision-making. Because refinery projects involve large budgets, strict timelines, safety standards, and multiple stakeholders, even a small deviation can lead to
Read More

Posts pagination

1 2 Next
  • Learn Excel (Free Course)
    • 1. Shortcut Keys
    • 2. Fill & Flash Fill
    • 3. Find & Replace
    • 4. Sort & Filter
    • 5. Formulas & Functions
    • 6. Data Validation
    • 7. Conditional Formatting
    • 8. Basic Charts
    • 9. Advanced Charts
    • 10. Pivot Tables
    • 11. Excel Dashboards
    • 12. VBA Course
    • 13. Excel Formulas with AI
  • Templates
  • Tutorials
    • Charts and Visualization
    • VBA
    • Excel Tips and Tricks
    • Excel Dashboards
    • Power Pivot & DAX
  • Power BI
  • Template Store
    • Ready to Use Templates
  • Courses
  • Academy
    • Excel + AI Mastery: 100 Formulas
    • Excel Pivot Tables & Dashboards
  • About Us
  • Contact Us
Copyright © 2023 PK-AnExcelExpert.com - Privacy Policy