New: NextGenTemplates Academy - video courses on Excel formulas with AI and Pivot Tables & dashboards. Early-bird: 20% off with code EARLYBIRD20 - first 20 orders only. See the courses →
  • Learn Excel (Free Course)
    • 1. Shortcut Keys
    • 2. Fill & Flash Fill
    • 3. Find & Replace
    • 4. Sort & Filter
    • 5. Formulas & Functions
    • 6. Data Validation
    • 7. Conditional Formatting
    • 8. Basic Charts
    • 9. Advanced Charts
    • 10. Pivot Tables
    • 11. Excel Dashboards
    • 12. VBA Course
    • 13. Excel Formulas with AI
  • Templates
  • Tutorials
    • Charts and Visualization
    • VBA
    • Excel Tips and Tricks
    • Excel Dashboards
    • Power Pivot & DAX
  • Power BI
  • Template Store
    • Ready to Use Templates
  • Courses
  • Academy
    • Excel + AI Mastery: 100 Formulas
    • Excel Pivot Tables & Dashboards
  • About Us
  • Contact Us

PK: An Excel Expert

Transforming Data into Decisions

Tag: Project Performance Dashboard

Dashboard

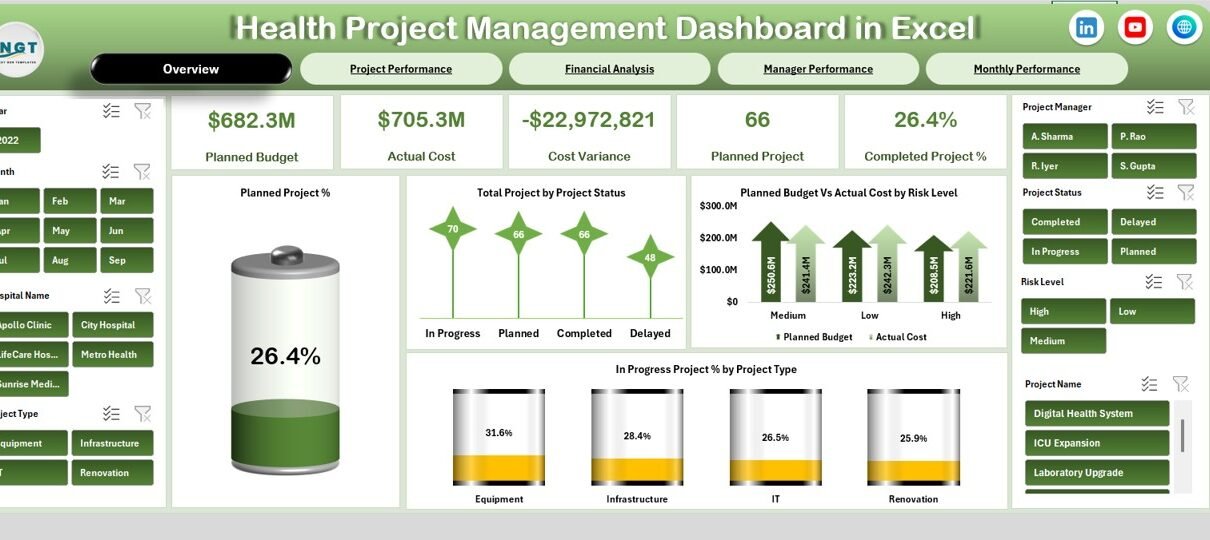
Health Project Management Dashboard in Excel

December 27, 2025December 27, 2025 PKComments Off on Health Project Management Dashboard in Excel
Healthcare organizations manage complex projects every day. These projects include hospital expansions, equipment installations, IT system upgrades, compliance initiatives, and patient service improvements. Because budgets stay tight and timelines remain
Read More
Dashboard Power BI

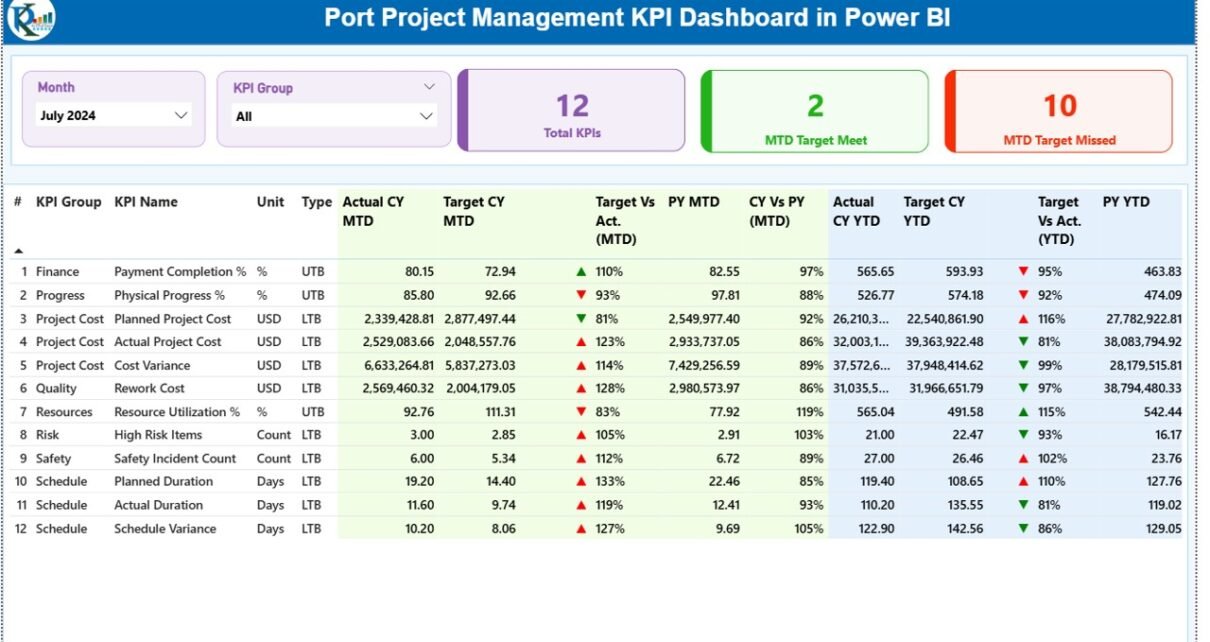
Port Project Management KPI Dashboard in Power BI

December 25, 2025December 25, 2025 PKComments Off on Port Project Management KPI Dashboard in Power BI
Managing port projects demands precision, speed, and complete visibility. Since ports operate with complex infrastructure, multiple contractors, strict timelines, and high financial stakes, tracking project performance manually often leads to
Read More
Power BI

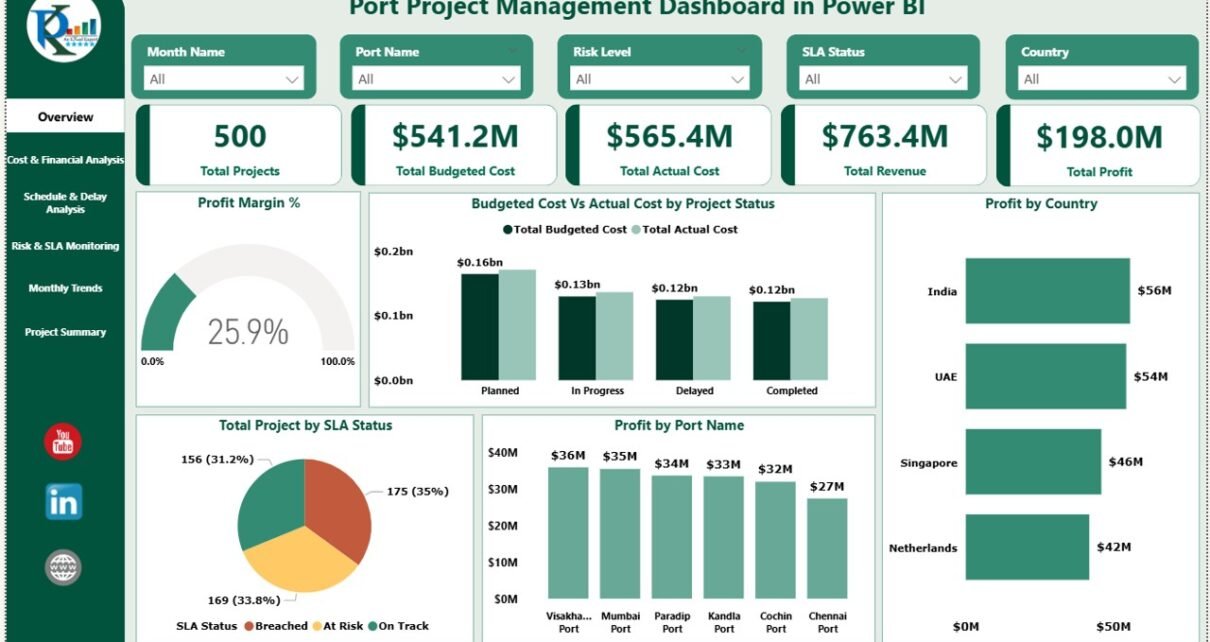
Port Project Management Dashboard in Power BI

December 25, 2025December 25, 2025 PKComments Off on Port Project Management Dashboard in Power BI
Managing port projects involves large budgets, multiple stakeholders, strict timelines, and high operational risks. Without a centralized reporting system, tracking project cost, progress, profit, and delays becomes extremely difficult. That
Read More
Dashboard

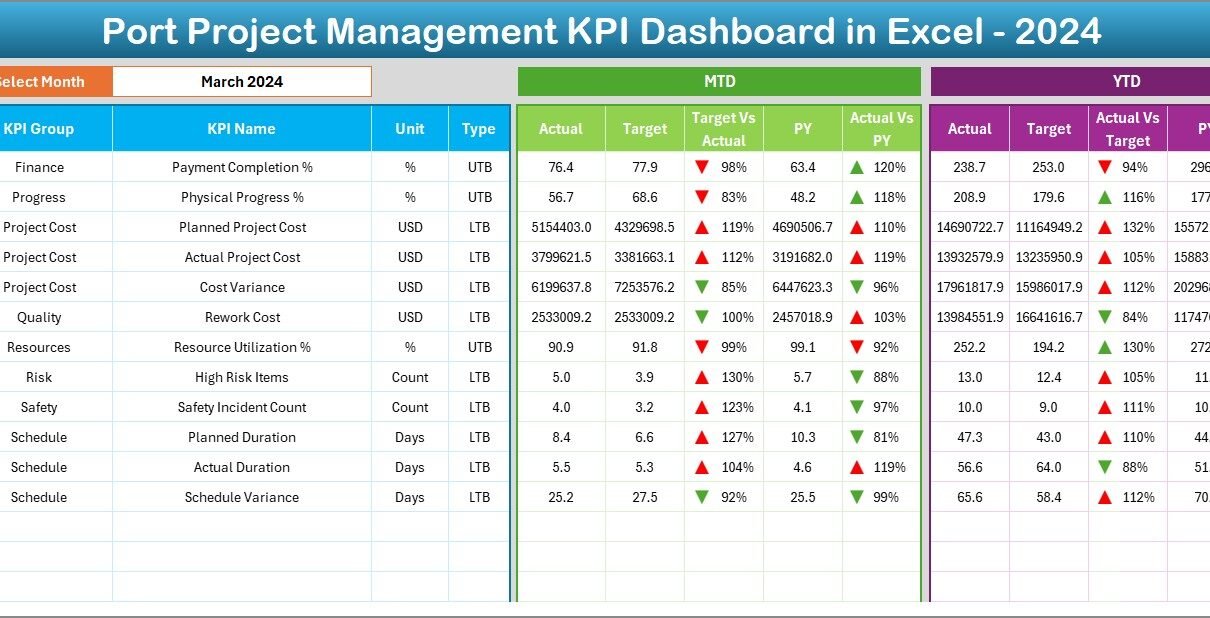
Port Project Management KPI Dashboard in Excel

December 24, 2025December 24, 2025 PKComments Off on Port Project Management KPI Dashboard in Excel
Managing port projects is never simple. Port authorities, terminal operators, EPC contractors, and logistics teams handle massive budgets, tight schedules, multiple vendors, strict compliance rules, and constant operational risks. However,
Read More
Dashboard Power BI

Renewable Infrastructure Projects KPI Dashboard in Power BI

December 5, 2025December 5, 2025 PKComments Off on Renewable Infrastructure Projects KPI Dashboard in Power BI
Renewable infrastructure projects grow fast, and teams need accurate data to stay on track. Solar farms, wind energy parks, hydro projects, and other renewable installations operate with tight budgets, strict
Read More
Templates

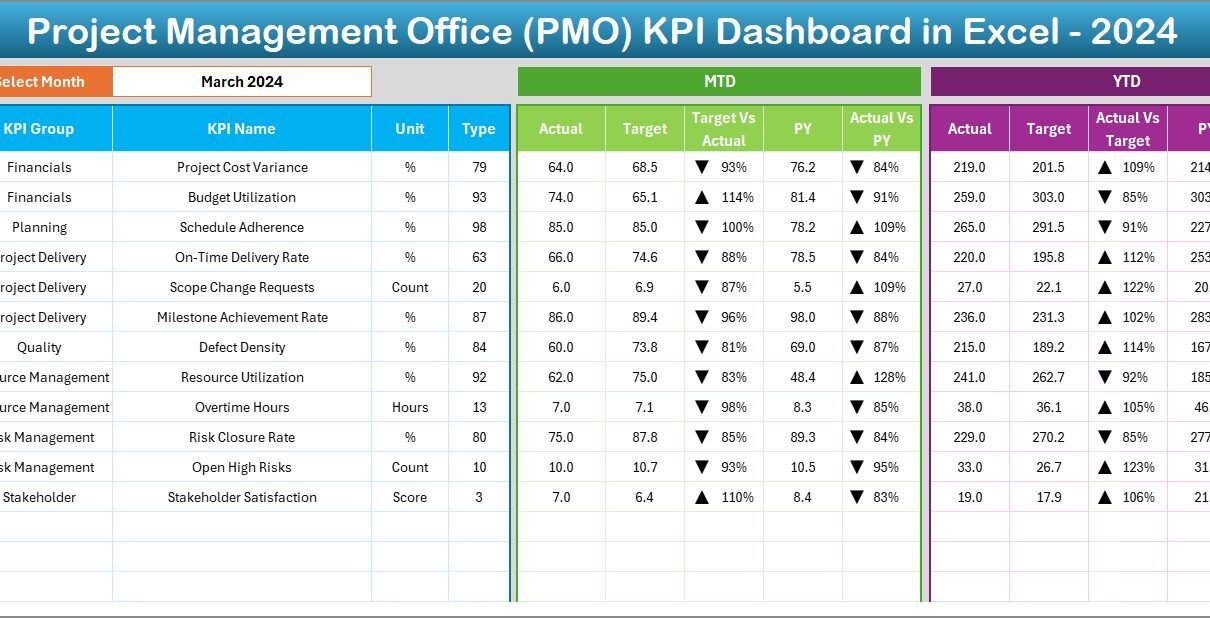
Project Management Office (PMO) KPI Dashboard in Excel

November 16, 2025November 16, 2025 PKComments Off on Project Management Office (PMO) KPI Dashboard in Excel
A Project Management Office (PMO) drives project success, supports the teams, monitors performance, and ensures that every project moves in the right direction. However, many PMO teams still track their
Read More
Dashboard

Road and Highway Construction KPI Dashboard in Excel

November 15, 2025November 15, 2025 PKComments Off on Road and Highway Construction KPI Dashboard in Excel
Road and highway construction projects require continuous monitoring, quick decision-making, and tight control over performance. You manage project timelines, labor hours, material usage, safety performance, machinery efficiency, budget utilization, and
Read More
Dashboard

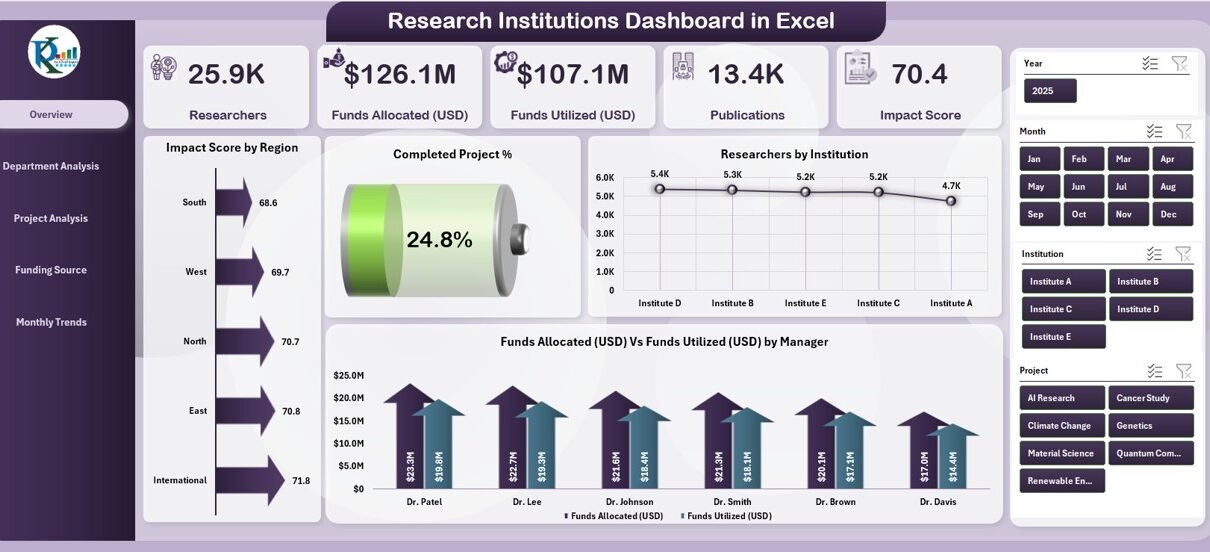
Research Institutions Dashboard in Excel

October 3, 2025October 3, 2025 PKComments Off on Research Institutions Dashboard in Excel
Research institutions play a critical role in driving innovation, solving global challenges, and advancing academic knowledge. However, with multiple projects, departments, and funding sources, managing research data can become overwhelming.
Read More
Dashboard

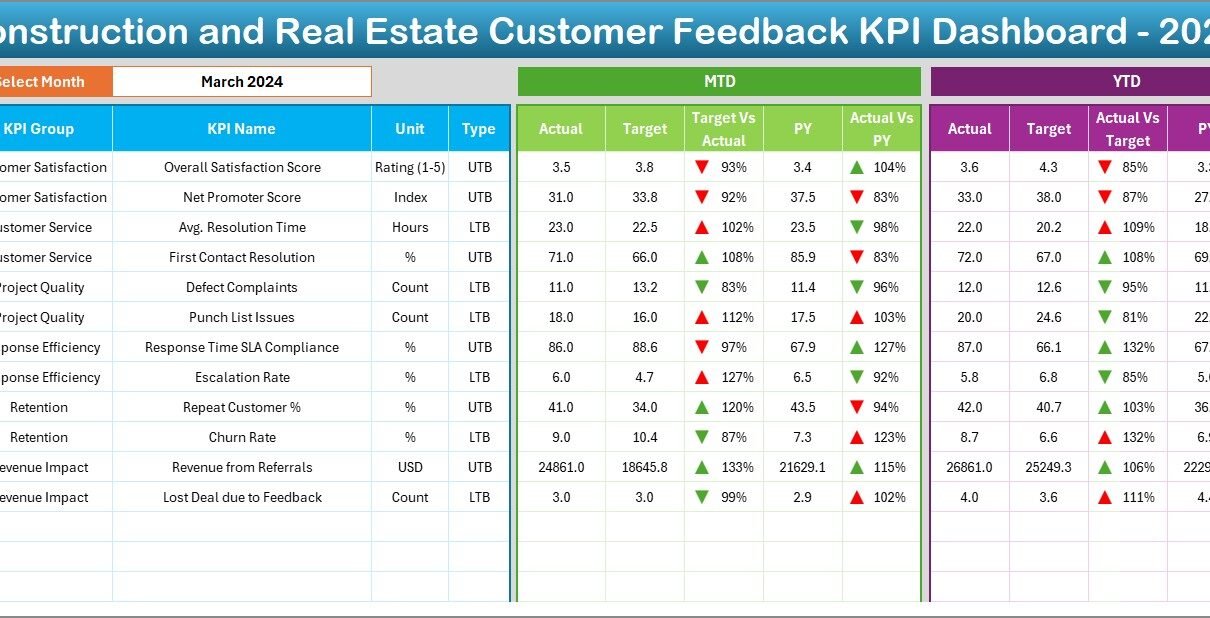
Construction and Real Estate Customer Feedback KPI Dashboard in Excel

August 27, 2025August 27, 2025 PKComments Off on Construction and Real Estate Customer Feedback KPI Dashboard in Excel
In today’s competitive world, customer feedback is the foundation of growth for every industry. For construction and real estate businesses, listening to customers is even more critical. Projects involve huge
Read More

Posts pagination

Previous 1 2
  • Learn Excel (Free Course)
    • 1. Shortcut Keys
    • 2. Fill & Flash Fill
    • 3. Find & Replace
    • 4. Sort & Filter
    • 5. Formulas & Functions
    • 6. Data Validation
    • 7. Conditional Formatting
    • 8. Basic Charts
    • 9. Advanced Charts
    • 10. Pivot Tables
    • 11. Excel Dashboards
    • 12. VBA Course
    • 13. Excel Formulas with AI
  • Templates
  • Tutorials
    • Charts and Visualization
    • VBA
    • Excel Tips and Tricks
    • Excel Dashboards
    • Power Pivot & DAX
  • Power BI
  • Template Store
    • Ready to Use Templates
  • Courses
  • Academy
    • Excel + AI Mastery: 100 Formulas
    • Excel Pivot Tables & Dashboards
  • About Us
  • Contact Us
Copyright © 2023 PK-AnExcelExpert.com - Privacy Policy