New: NextGenTemplates Academy - video courses on Excel formulas with AI and Pivot Tables & dashboards. Early-bird: 20% off with code EARLYBIRD20 - first 20 orders only. See the courses →
  • Learn Excel (Free Course)
    • 1. Shortcut Keys
    • 2. Fill & Flash Fill
    • 3. Find & Replace
    • 4. Sort & Filter
    • 5. Formulas & Functions
    • 6. Data Validation
    • 7. Conditional Formatting
    • 8. Basic Charts
    • 9. Advanced Charts
    • 10. Pivot Tables
    • 11. Excel Dashboards
    • 12. VBA Course
    • 13. Excel Formulas with AI
  • Templates
  • Tutorials
    • Charts and Visualization
    • VBA
    • Excel Tips and Tricks
    • Excel Dashboards
    • Power Pivot & DAX
  • Power BI
  • Template Store
    • Ready to Use Templates
  • Courses
  • Academy
    • Excel + AI Mastery: 100 Formulas
    • Excel Pivot Tables & Dashboards
  • About Us
  • Contact Us

PK: An Excel Expert

Transforming Data into Decisions

Tag: recovery performance dashboard

Power BI Templates

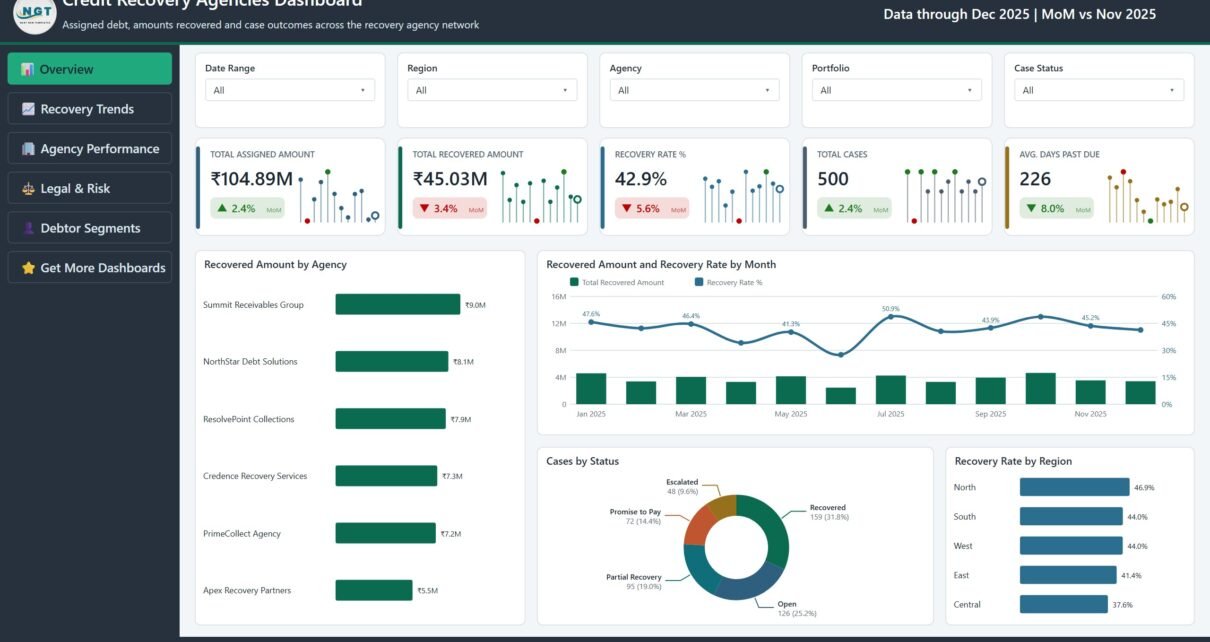
Credit Recovery Agencies Dashboard in Power BI

August 29, 2026August 29, 2026 PKComments Off on Credit Recovery Agencies Dashboard in Power BI
Most collections teams can tell you how much they recovered last month. Very few can tell you, without a week of spreadsheet work, which agency earned it, which risk band
Read More
Dashboard Templates

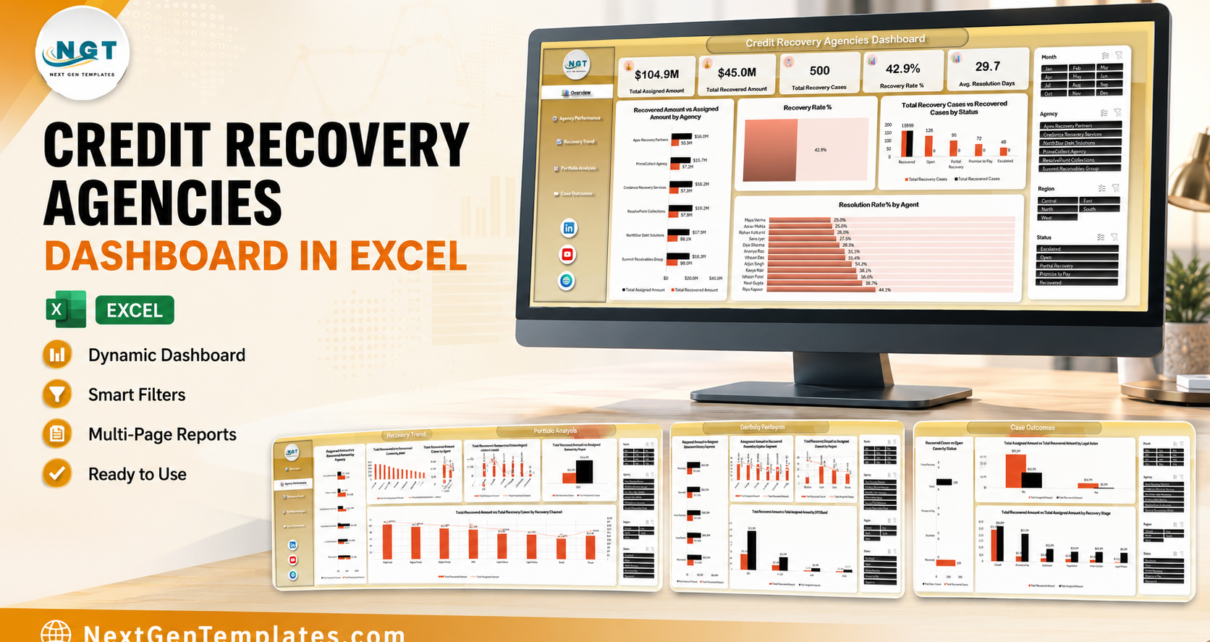
Credit Recovery Agencies Dashboard in Excel

August 26, 2026August 26, 2026 PKComments Off on Credit Recovery Agencies Dashboard in Excel
The Credit Recovery Agencies Dashboard in Excel is a five-page analytical workbook built on 19 charts, 25 pivot tables and 4 linked slicers, running over a 500-record sample book of
Read More
Dashboard Power BI

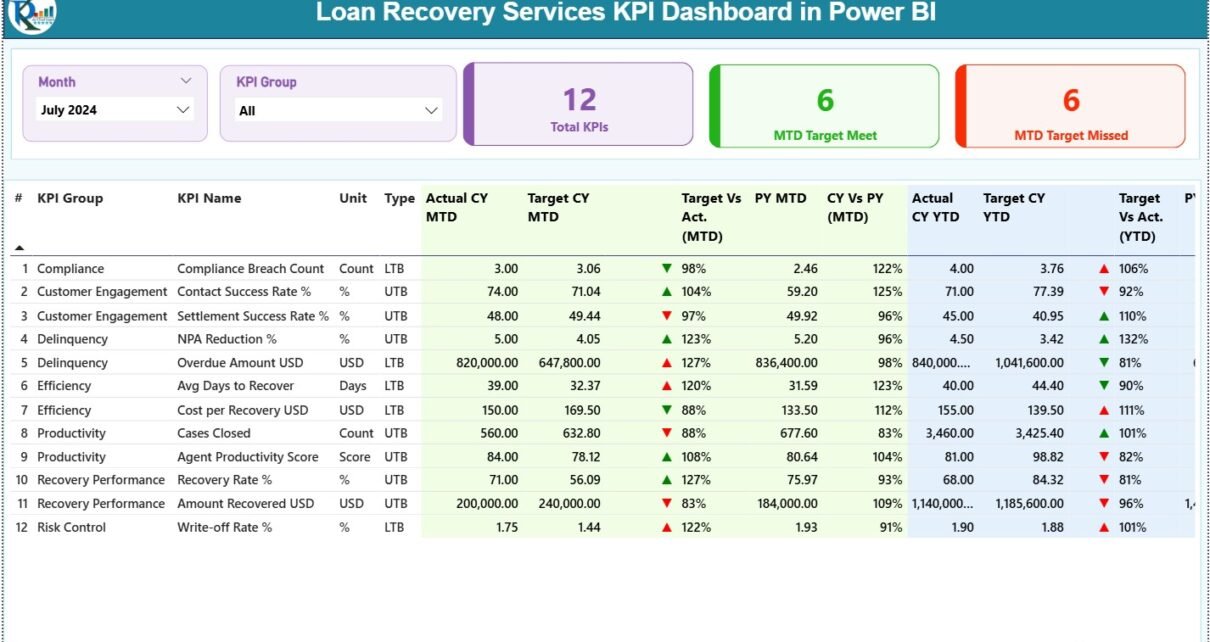
Loan Recovery Services KPI Dashboard in Power BI

December 14, 2025December 14, 2025 PKComments Off on Loan Recovery Services KPI Dashboard in Power BI
Managing loan recovery operations requires precision, transparency, and continuous performance tracking. However, when recovery data remains scattered across spreadsheets and manual reports, teams struggle to identify bottlenecks, measure effectiveness, and
Read More
  • Learn Excel (Free Course)
    • 1. Shortcut Keys
    • 2. Fill & Flash Fill
    • 3. Find & Replace
    • 4. Sort & Filter
    • 5. Formulas & Functions
    • 6. Data Validation
    • 7. Conditional Formatting
    • 8. Basic Charts
    • 9. Advanced Charts
    • 10. Pivot Tables
    • 11. Excel Dashboards
    • 12. VBA Course
    • 13. Excel Formulas with AI
  • Templates
  • Tutorials
    • Charts and Visualization
    • VBA
    • Excel Tips and Tricks
    • Excel Dashboards
    • Power Pivot & DAX
  • Power BI
  • Template Store
    • Ready to Use Templates
  • Courses
  • Academy
    • Excel + AI Mastery: 100 Formulas
    • Excel Pivot Tables & Dashboards
  • About Us
  • Contact Us
Copyright © 2023 PK-AnExcelExpert.com - Privacy Policy