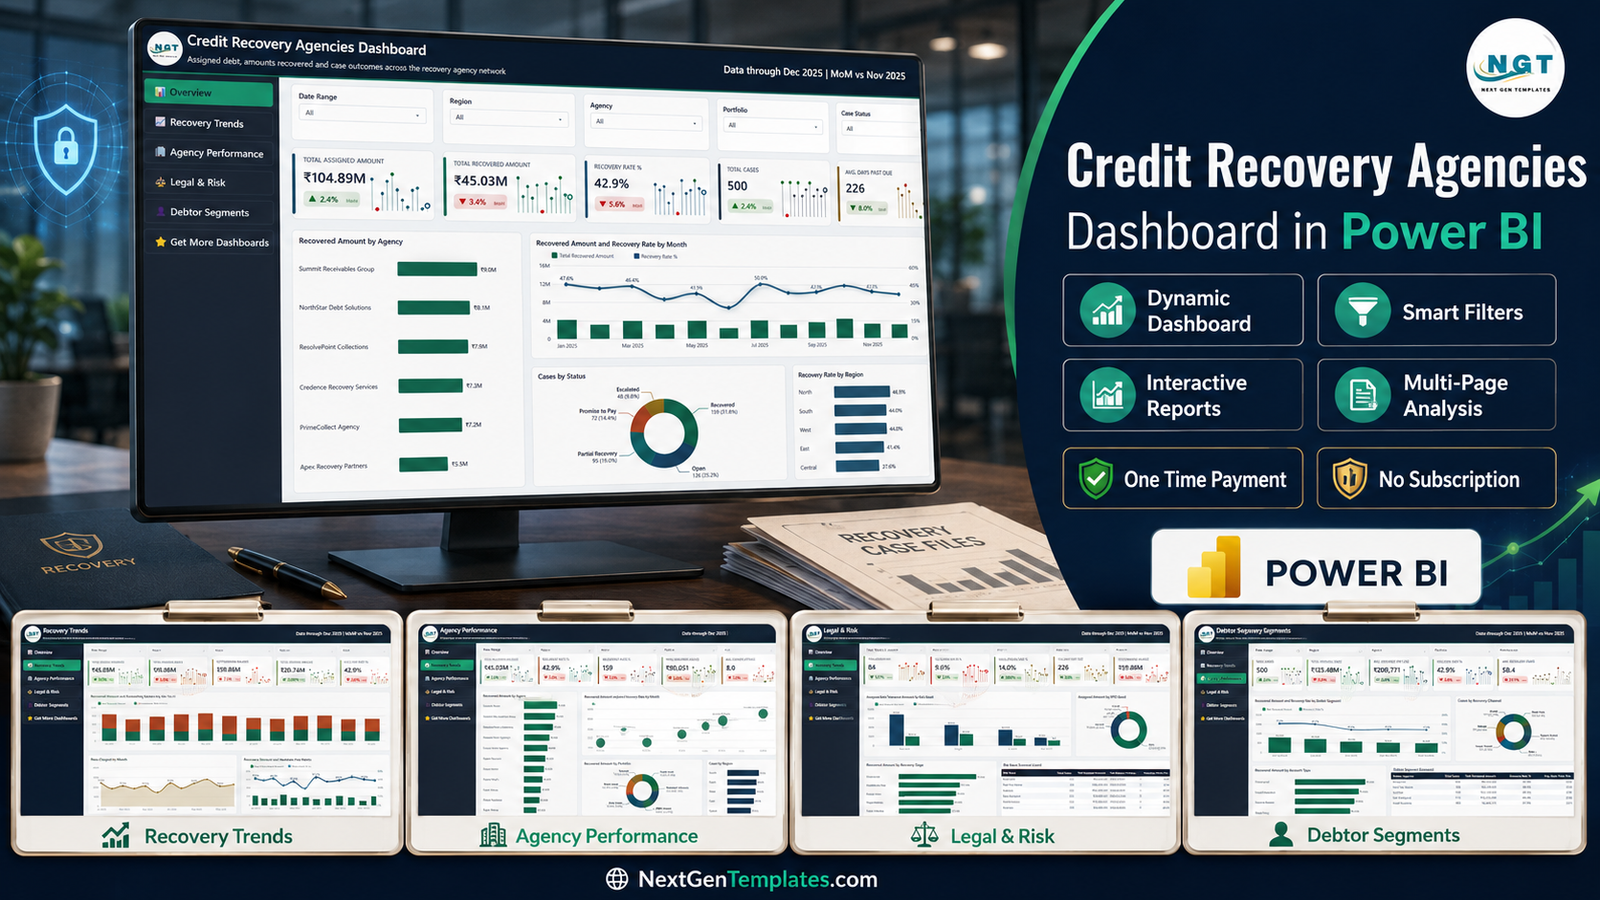
Most collections teams can tell you how much they recovered last month. Very few can tell you, without a week of spreadsheet work, which agency earned it, which risk band it came out of, and whether the recovery rate moved because performance changed or because the book aged. The Credit Recovery Agencies Dashboard in Power BI answers all three on one screen. The sample book it ships with holds 500 cases and ₹104.89M of assigned debt, recovers ₹45.03M at a 42.9% recovery rate, carries ₹59.86M still outstanding and averages 226 days past due — and 67.7% of that assigned value sits in the 180+ DPD bucket, which is exactly the sort of fact a blended recovery-rate number hides. Credit Recovery Agencies Dashboard in Power BI
This post walks through all five pages, what each visual actually shows, where the template fits against Excel and paid collections platforms, and where it does not fit at all. Credit Recovery Agencies Dashboard in Power BI
Key Features of the Credit Recovery Agencies Dashboard in Power BI
- Five report pages plus a navigation rail — Overview, Recovery Trends, Agency Performance, Legal & Risk, Debtor Segments, and a sixth “Get More Dashboards” item.
- 25 KPI cards — five per page, each with a sparkline and a month-on-month delta (Dec 2025 versus Nov 2025 in the sample).
- 19 charts and tables, including two matrix scorecards and a bubble scatter that plots recovered value against recovery rate.
- Five synced slicers on every page — Date Range, Region, Agency and Portfolio throughout, with a page-specific fifth: Case Status, Recovery Channel, Agent, Risk Band or Debtor Segment.
- Six agencies, twelve agents, six portfolios, four risk bands, four DPD buckets and six recovery channels already modelled.
- A flat 22-column data table plus a generated date table, so swapping in your own extract is a source change rather than a rebuild.
- Free to run — Power BI Desktop costs nothing; a Pro licence is only needed to publish and share.
Dashboard Pages Explanation
Page 1 — Overview
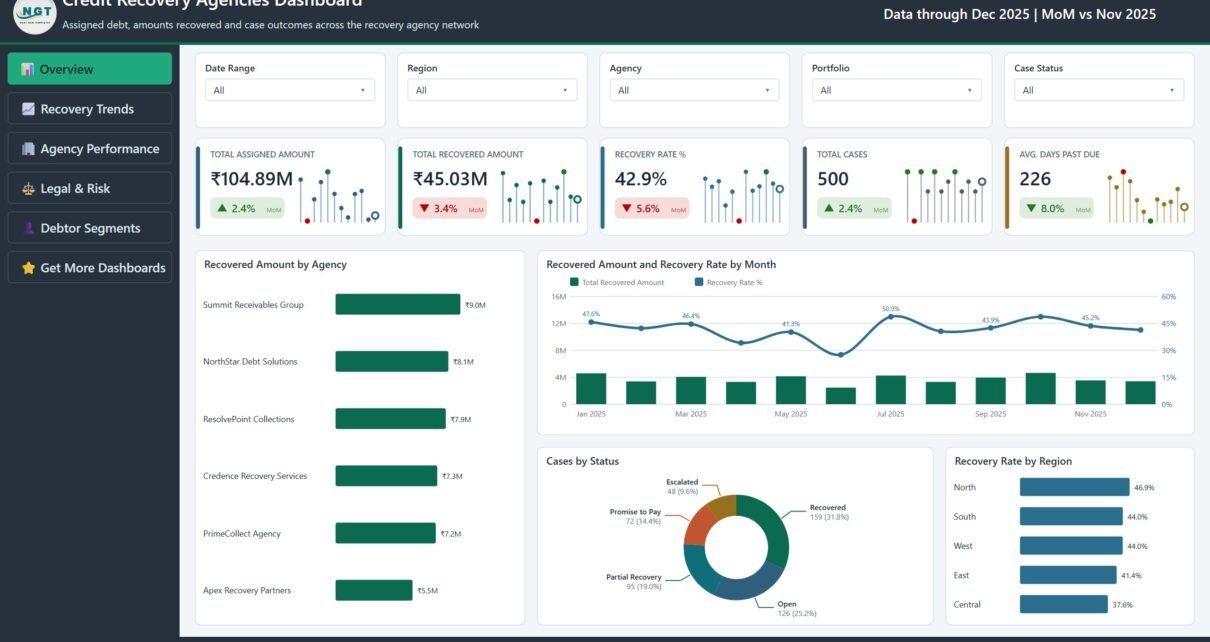
The landing page answers “how is the whole book doing”. Its five cards are Total Assigned Amount ₹104.89M (up 2.4% MoM), Total Recovered Amount ₹45.03M (down 3.4%), Recovery Rate % 42.9% (down 5.6%), Total Cases 500 (up 2.4%) and Avg. Days Past Due 226 (down 8.0%).
Underneath, Recovered Amount by Agency ranks Summit Receivables Group (₹9.0M), NorthStar Debt Solutions (₹8.1M), ResolvePoint Collections (₹7.9M), Credence Recovery Services (₹7.3M), PrimeCollect Agency (₹7.2M) and Apex Recovery Partners (₹5.5M). Recovered Amount and Recovery Rate by Month puts recovered value as columns and recovery rate as a line across all twelve months of 2025, so a month where you collected more but converted less is immediately obvious. Cases by Status splits the 500 cases into Recovered 159 (31.8%), Open 126 (25.2%), Partial Recovery 95 (19.0%), Promise to Pay 72 (14.4%) and Escalated 48 (9.6%). Recovery Rate by Region runs North 46.9%, South 44.0%, West 44.0%, East 41.4%, Central 37.6%. Credit Recovery Agencies Dashboard in Power BI
Page 2 — Recovery Trends
This page is about the money that has not come in yet. Cards: Total Recovered Amount ₹45.03M, Outstanding Balance ₹59.86M (up 7.1%), Total Promise Amount ₹20.74M (up 132.9%), Total Fees Charged ₹2.91M (up 7.0%) and Recovery Rate % 42.9%. Credit Recovery Agencies Dashboard in Power BI
Recovered Amount and Outstanding Balance by Month stacks the two series so the recovered share of each month’s book is visible without arithmetic. Fees Charged by Month tracks commission from ₹282K in January through a ₹273K September peak to ₹241K in November — useful when you are negotiating the next contingency rate. Promise Amount and Recovery Rate by Month is the honest one: a promise-to-pay spike with a flat recovery rate means your agents are collecting commitments, not cash. Credit Recovery Agencies Dashboard in Power BI
Page 3 — Agency Performance
Cards: Total Recovered Amount ₹45.03M, Recovery Rate % 42.9%, Recovered Cases 159, Avg. Recovered per Case ₹90,051 and Avg. Contact Attempts 8.0 (up 11.4%, which is worth watching — more calls for less cash).
Recovered Amount by Agent ranks all twelve agents, from Ananya Rao at ₹5.5M to Maya Verma at ₹2.1M. Recovered Amount against Recovery Rate by Agency is the visual most people screenshot for a vendor review: each agency is a bubble positioned by absolute recovery on the x-axis and conversion rate on the y-axis, so a firm that recovers a lot only because it was given a lot cannot hide. Recovered Amount by Portfolio splits Credit Cards ₹9.6M (21.3%), Consumer Durable ₹8.0M (17.8%), SME Finance ₹7.6M (16.9%), Auto Loans ₹6.8M (15.0%), Retail Loans ₹6.7M (15.0%) and Telecom ₹6.3M (14.0%). Cases by Region shows the caseload split: North 113, East 103, Central 102, South 97, West 85. Credit Recovery Agencies Dashboard in Power BI
Page 4 — Legal & Risk
Cards: Severe Risk Cases 84 (down 16.7%), Escalation Rate % 9.6%, Legal Action Rate % 14.0% (down 39.0%), Avg. Days Past Due 226 and Outstanding Balance ₹59.86M. Credit Recovery Agencies Dashboard in Power BI
Assigned and Recovered Amount by Risk Band pairs the two bars for each band — Moderate ₹35.2M assigned against ₹15.0M recovered, High ₹30.5M against ₹12.8M, Low ₹20.1M against ₹9.7M, Severe ₹19.1M against ₹7.5M. Assigned Amount by DPD Band is the page’s headline: ₹71.0M, or 67.7% of the assigned book, is 180+ days past due, with ₹25.9M in 91–180, ₹4.4M in 61–90 and ₹3.7M in 31–60. Recovered Amount by Recovery Stage ranks Closed ₹31.5M, Promise to Pay ₹4.7M, Settlement ₹3.2M, Negotiation ₹2.9M, Initial Contact ₹2.4M and Legal Review ₹0.4M. Finally the Risk Band Scorecard matrix lays out cases, assigned value, recovered value and recovery rate together: Low 96 cases / ₹20,098,943 / ₹9,749,711 / 48.5%; Moderate 178 / ₹35,223,251 / ₹14,974,313 / 42.5%; High 142 / ₹30,494,165 / ₹12,818,112 / 42.0%; Severe 84 / ₹19,069,051 / ₹7,483,350 / 39.2%. Credit Recovery Agencies Dashboard in Power BI
Page 5 — Debtor Segments
Cards: Total Cases 500, Total Original Debt ₹123.48M, Avg. Assigned per Case ₹209,771, Recovery Rate % 42.9% and Avg. Resolution Days 58.4 (up 27.7%).
Recovered Amount and Recovery Rate by Debtor Segment pairs value with conversion: Self-Employed ₹12.3M at 49.4%, Salaried ₹11.2M at 48.1%, Enterprise ₹8.5M at 37.6%, High Net Worth ₹6.6M at 38.5%, Small Business ₹6.4M at 37.9%. Cases by Recovery Channel splits Field Visit 93 (18.6%), Digital Portal 90 (18.0%), SMS 85 (17.0%), Legal Notice 84 (16.8%), Phone 77 (15.4%) and Email 71 (14.2%). Recovered Amount by Account Type ranks Unsecured ₹13.0M, Installment ₹11.6M, Secured ₹10.6M and Revolving ₹9.8M. The Debtor Segment Scorecard adds average days past due per segment, which ranges from 211 (High Net Worth) to 236 (Self-Employed). Credit Recovery Agencies Dashboard in Power BI
Credit Recovery Agencies Dashboard in Power BI vs. Excel vs. Paid Collections SaaS — Feature Comparison
| This Power BI Dashboard | Excel Dashboard | Paid Collections SaaS | |
|---|---|---|---|
| Cost | $17.99 one time | $17.99 one time | $300–$1,500 per month |
| Platform | Power BI Desktop (free), Windows | Excel 2016+, Microsoft 365, Mac | Vendor cloud |
| Setup time | 10–20 minutes | About 10 minutes | 4–12 weeks |
| Real-time team collaboration | Yes, via a Power BI workspace | OneDrive / SharePoint co-authoring | Yes |
| Mobile access | Power BI mobile app | Excel mobile, limited | Native apps |
| Customisable fields | Full model, measure and visual editing | Full sheet and pivot editing | Vendor configuration only |
| Share with link | Yes, through Power BI Service | File share only | Yes |
| Year-1 cost at 5 users | $17.99 (plus Pro seats only if you publish) | $17.99 | $18,000–$90,000 |
| Row capacity | Millions | Comfortable to a few hundred thousand | Unlimited |
| Dialler and payment integration | No | No | Yes |
Who Should Use This Template
Collections managers running a panel of external agencies get the most from it, because the agency and agent comparisons are the point. In-house recovery teams at NBFCs, banks, telcos and consumer-durable lenders use it to prepare a credit committee pack. ARC and debt-purchase analysts use the DPD and risk-band pages to sanity-check a portfolio’s collectability before pricing it. And Power BI consultants use it as a starting model for a client engagement rather than building a collections schema from scratch. Credit Recovery Agencies Dashboard in Power BI
It suits anyone who already exports a case-level extract from a collections system and currently pivots it by hand every month. If your data lives only inside a vendor portal and you cannot export it, this is not the tool — and neither is Excel. Credit Recovery Agencies Dashboard in Power BI
Real-World Use Cases
Quarterly agency review. Open Agency Performance, leave every slicer on All, and read the bubble chart. In the sample, Apex Recovery Partners sits lowest on both axes while Summit Receivables Group leads on both — a clear renewal conversation. Then filter by Portfolio to check whether the laggard was simply given the harder book.
Explaining a fall in recovery rate. Recovery rate is down 5.6% month on month on the Overview page. Legal & Risk explains it: the 180+ bucket holds 67.7% of assigned value, and Severe-band cases convert at 39.2% against 48.5% for Low. Mix, not effort.
Choosing where to spend contact effort. Debtor Segments shows Self-Employed and Salaried repaying at 49.4% and 48.1% while Enterprise sits at 37.6% despite a larger average balance. Cross-read with Cases by Recovery Channel to see whether the weak segments are being worked through the cheapest channels.
Advantages of the Credit Recovery Agencies Dashboard in Power BI
- Every number is a measure, not a typed value. Swap the source and all 25 cards and 19 visuals recalculate.
- Cross-filtering comes free. Click a bar in Recovered Amount by Agency and every other visual on the page filters to that agency — no extra build.
- It scales past Excel’s comfort zone. A case-level extract of several hundred thousand rows is unremarkable for the Power BI engine.
- MoM deltas are built in. Each card shows direction as well as level, so you can hand a screenshot to someone who was not in the meeting.
- You own the file. No seats, no renewal, no data leaving your machine unless you choose to publish it. Credit Recovery Agencies Dashboard in Power BI
Opportunities for Improvement
Being straight about the limits: there is no write-back, so you cannot log a call or record a payment from the dashboard — it reads your data, it does not manage cases. There is no dialler, payment-link or letter-generation integration. The sample is formatted in ₹, so reporting in another currency means changing the format string on each measure (a two-minute job, but a job). Power BI Desktop is Windows-only, which rules out Mac users without a VM. And nothing here evidences regulatory call conduct under FDCPA, RBI or equivalent rules — keep your compliance archive where it is.
Best Practices
- Keep the column headers exactly as shipped. Renaming a column breaks the measures that reference it; add new columns instead.
- Load activity-level rows, not monthly summaries. The date table and every MoM delta depend on a real Activity Date per case.
- Read recovery rate alongside DPD band, always. A blended rate across a book that is two-thirds 180+ is not comparable to one across a fresh book.
- Set a refresh schedule if you publish. A workspace-hosted report with a stale dataset is worse than a file on a laptop — see Microsoft’s guide to data refresh in Power BI.
- Snapshot the Agency Performance page monthly. Vendor conversations go better with a trend of screenshots than with one live filter session.
Explore Relevant Templates
- Credit Recovery Agencies Dashboard in Power BI — the template described in this post.
- Credit Recovery Agencies Dashboard in Excel — the Excel build of the same subject, for Mac users and Excel-only teams.
- Credit Recovery Agencies KPI Dashboard in Excel — a month-picker scorecard with traffic lights, for the monthly pack.
- Loan Recovery Services KPI Dashboard in Excel — recovery KPIs for an in-house book.
- Loan Portfolio KPI Dashboard in Power BI — the origination side of the same lifecycle.
- Browse all Power BI Dashboard templates.
Frequently Asked Questions
Do I need a paid Power BI licence?
No. Power BI Desktop is free and opens, edits and refreshes the file completely. Power BI Pro is only required if you want to publish the report to a workspace and share it with colleagues. Credit Recovery Agencies Dashboard in Power BI
Will it run on a Mac?
Power BI Desktop is Windows-only. On macOS you would need a virtual machine or a cloud Windows desktop — or the Excel version of the same dashboard, which runs natively.
How do I change the currency?
Select a measure in the Data pane, open Measure tools and edit the format string. The sample ships in ₹ because it was generated from an Indian recovery book; no formula changes are needed to switch.
What columns does my data need?
Twenty-two: Case ID, Activity Date, Agency, Region, Portfolio, Recovery Channel, Account Type, Debtor Segment, Agent, Original Debt, Assigned Amount, Recovered Amount, Fees Charged, Days Past Due, Contact Attempts, Promise Amount, Resolution Days, Recovery Stage, Status, Risk Band, Legal Action and DPD Band. If some are missing, add them empty and hide the visuals that use them.
Is this the same as the KPI dashboard version?
No. The KPI dashboard is a month-picker scorecard with targets and traffic lights. This is an analytical dashboard: five pages of slicer-driven charts over case-level data. They are complementary, not duplicates.Credit Recovery Agencies Dashboard in Power BI
How many rows will it handle?
The sample has 500 cases; the import model happily takes hundreds of thousands. Refresh time depends on your source, not on the report. Credit Recovery Agencies Dashboard in Power BI
About the Author
Built by PK – Microsoft Certified Professional with 15+ years of Excel, Google Sheets, and Power BI experience. Founder of NextGenTemplates, reaching 300K+ subscribers across YouTube channels. Every template is hand-built and tested before release. Credit Recovery Agencies Dashboard in Power BI
Conclusion
A recovery book is easy to describe badly. One blended rate, one total, one agency name in a subject line. The Credit Recovery Agencies Dashboard in Power BI replaces that with five pages that separate volume from conversion, effort from outcome and mix from performance — six agencies and twelve agents ranked, four risk bands scored, and a DPD split that tells you 67.7% of the book is 180+ before anyone sets next quarter’s target. It costs $17.99 once, runs on the free Power BI Desktop, and takes about fifteen minutes to point at your own extract.Credit Recovery Agencies Dashboard in Power BI
Get the Credit Recovery Agencies Dashboard in Power BI and, for step-by-step Power BI and Excel walkthroughs, subscribe on youtube.com/@PKAnExcelExpert.