New: NextGenTemplates Academy - video courses on Excel formulas with AI and Pivot Tables & dashboards. Early-bird: 20% off with code EARLYBIRD20 - first 20 orders only. See the courses →
  • Learn Excel (Free Course)
    • 1. Shortcut Keys
    • 2. Fill & Flash Fill
    • 3. Find & Replace
    • 4. Sort & Filter
    • 5. Formulas & Functions
    • 6. Data Validation
    • 7. Conditional Formatting
    • 8. Basic Charts
    • 9. Advanced Charts
    • 10. Pivot Tables
    • 11. Excel Dashboards
    • 12. VBA Course
    • 13. Excel Formulas with AI
  • Templates
  • Tutorials
    • Charts and Visualization
    • VBA
    • Excel Tips and Tricks
    • Excel Dashboards
    • Power Pivot & DAX
  • Power BI
  • Template Store
    • Ready to Use Templates
  • Courses
  • Academy
    • Excel + AI Mastery: 100 Formulas
    • Excel Pivot Tables & Dashboards
  • About Us
  • Contact Us

PK: An Excel Expert

Transforming Data into Decisions

Tag: Renewable Energy Dashboard

Dashboard

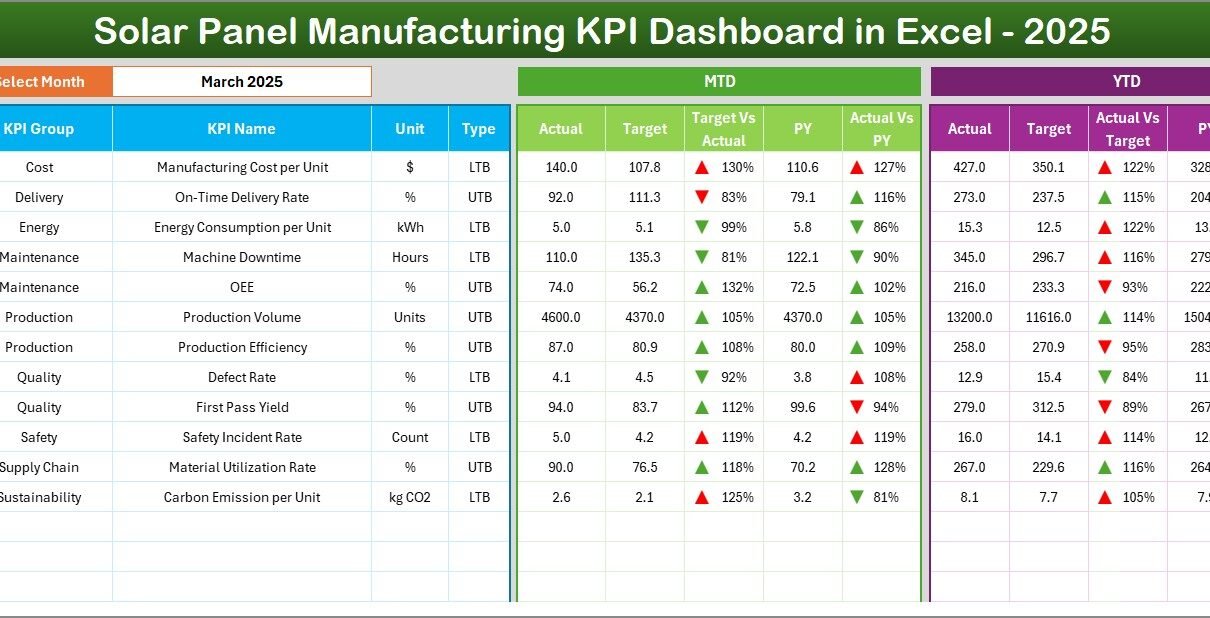
Solar Panel Manufacturing KPI Dashboard in Excel

February 23, 2026February 23, 2026 PKComments Off on Solar Panel Manufacturing KPI Dashboard in Excel
The solar energy industry continues to grow rapidly across the world. Governments promote renewable energy, businesses invest in sustainable production, and consumers increasingly adopt clean power solutions. Because of this
Read More
Dashboard

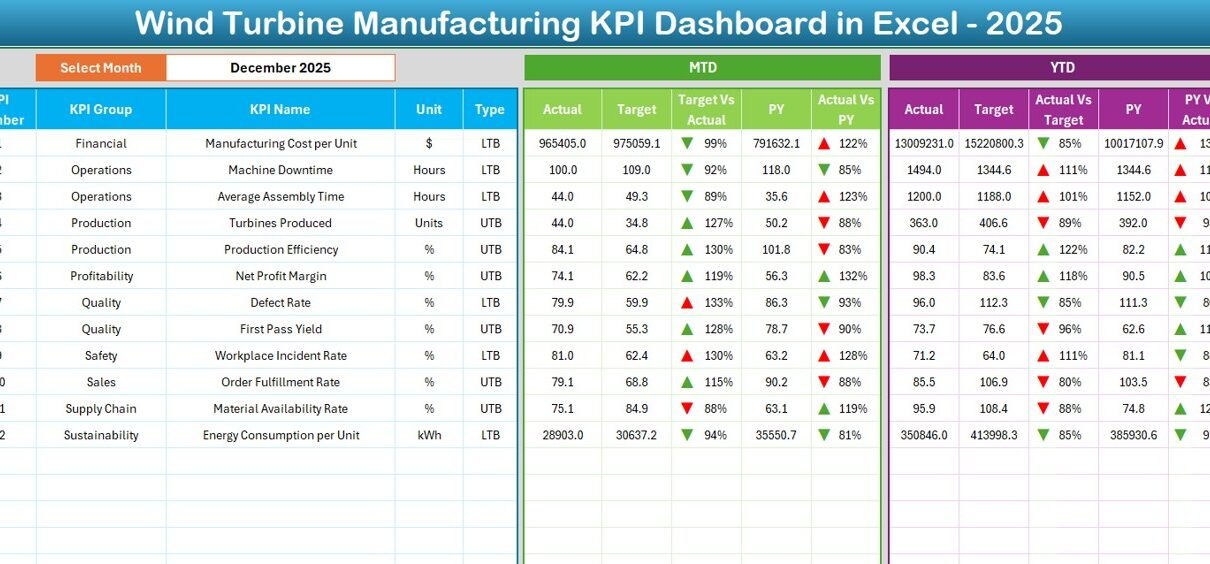
Wind Turbine Manufacturing KPI Dashboard in Excel

February 23, 2026February 23, 2026 PKComments Off on Wind Turbine Manufacturing KPI Dashboard in Excel
The renewable energy industry continues to grow rapidly. As countries invest heavily in clean energy solutions, wind turbine manufacturing companies must improve efficiency, maintain quality, and control production costs. However,
Read More
Dashboard Power BI

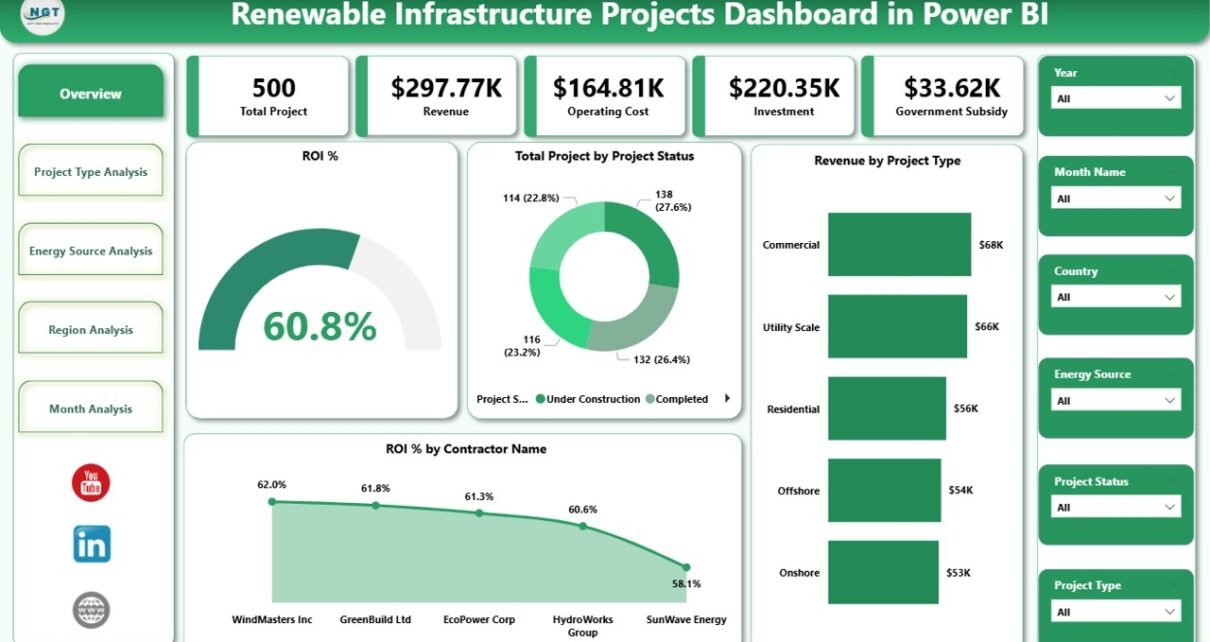
Renewable Infrastructure Projects Dashboard in Power BI

February 17, 2026February 17, 2026 PKComments Off on Renewable Infrastructure Projects Dashboard in Power BI
In today’s fast-changing energy world, renewable infrastructure projects continue to grow rapidly. Governments invest heavily. Private investors fund large solar and wind farms. Meanwhile, project managers handle multiple contracts, regions,
Read More
Dashboard

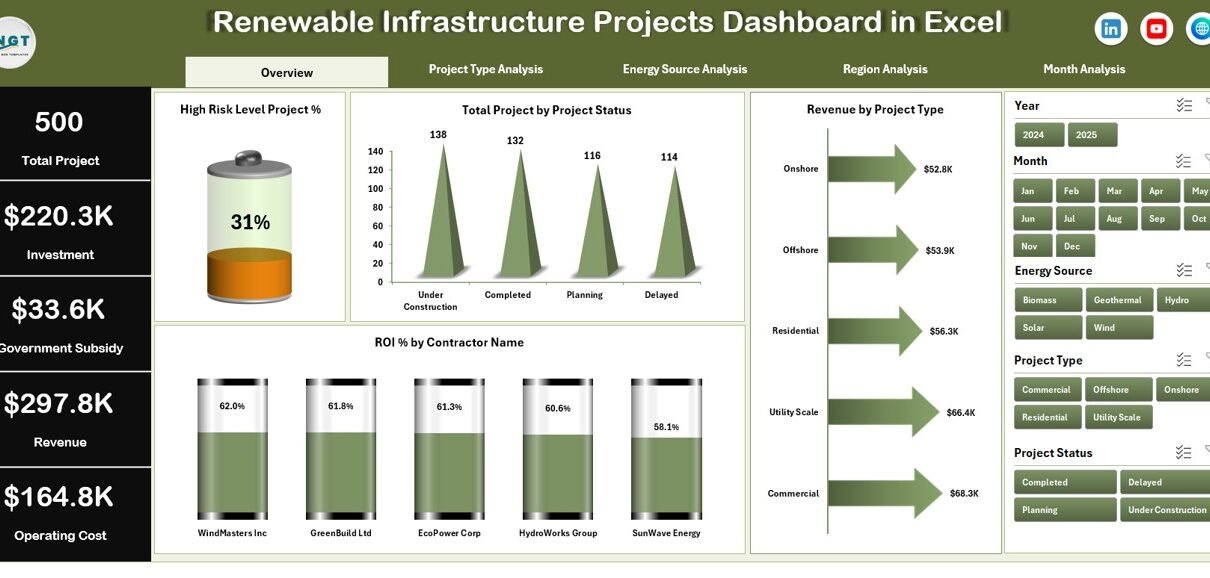
Renewable Infrastructure Projects Dashboard in Excel

February 17, 2026February 17, 2026 PKComments Off on Renewable Infrastructure Projects Dashboard in Excel
Renewable energy projects demand precision, capital control, and strong performance monitoring. However, many organizations still manage solar, wind, hydro, and biomass projects using scattered Excel sheets and manual reports. As
Read More
Dashboard Power BI

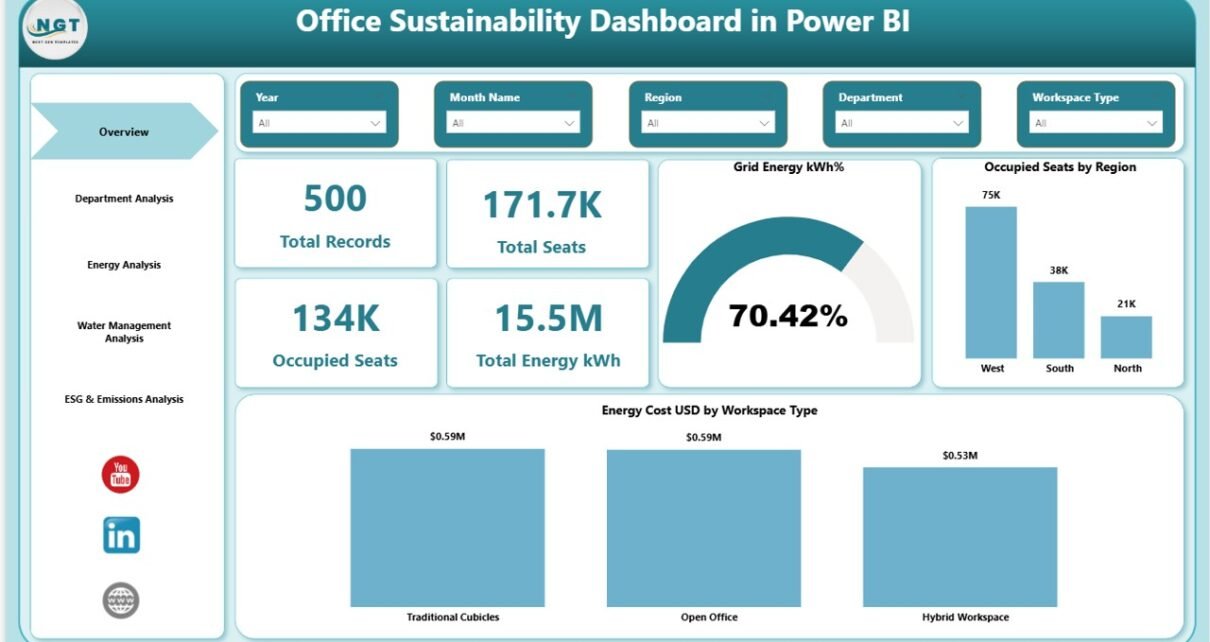
Office Sustainability Dashboard in Power BI

February 9, 2026February 9, 2026 PKComments Off on Office Sustainability Dashboard in Power BI
Sustainability no longer sits on the side of business strategy. Instead, it drives brand value, investor trust, and operational efficiency. Today, companies must track energy use, water consumption, emissions, and
Read More
Dashboard

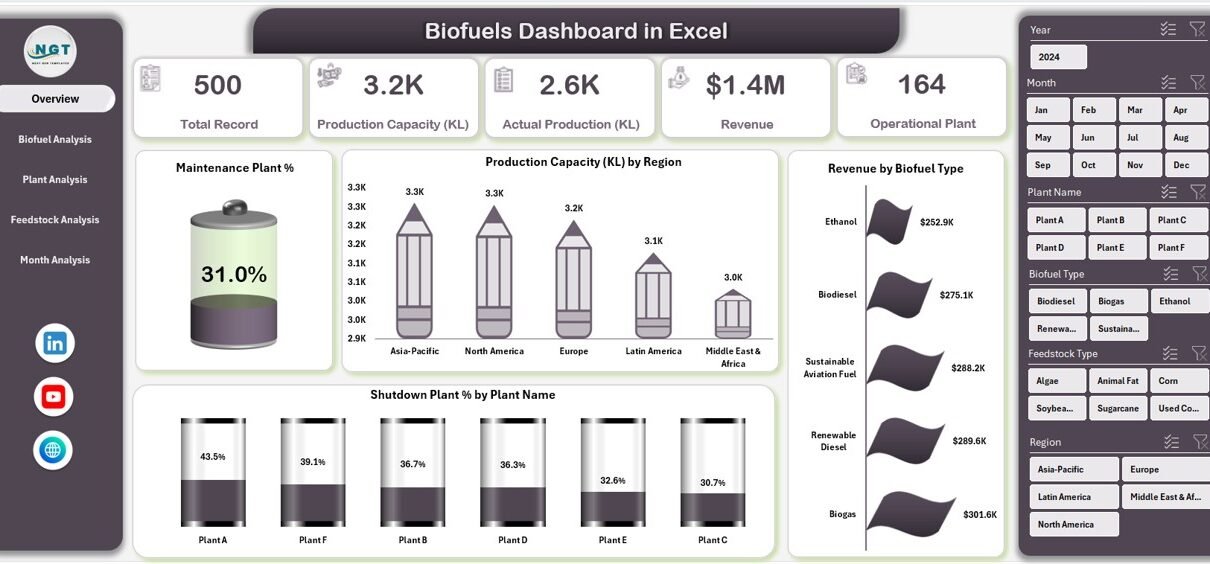
Biofuels Dashboard in Excel

January 10, 2026January 10, 2026 PKComments Off on Biofuels Dashboard in Excel
The global shift toward renewable energy continues to accelerate. As a result, biofuels have become a critical component of sustainable energy strategies across industries. However, managing biofuel production, plant efficiency,
Read More
Dashboard

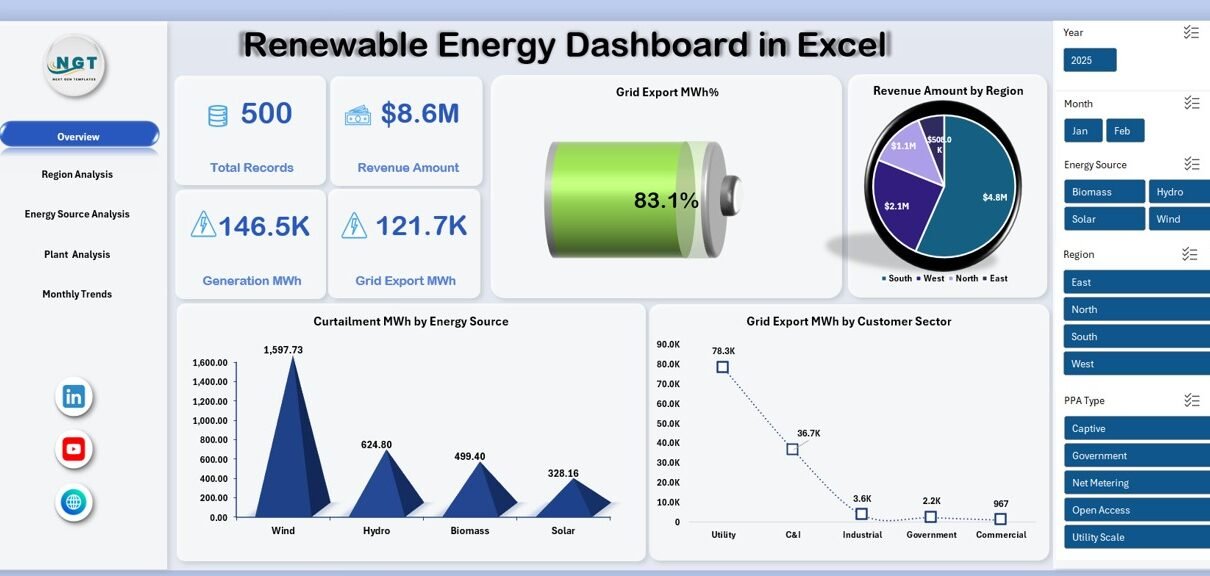
Renewable Energy Dashboard in Excel

December 12, 2025December 12, 2025 PKComments Off on Renewable Energy Dashboard in Excel
Renewable energy projects grow rapidly across the world. However, managing data from solar, wind, hydro, and other renewable sources often becomes complex. Multiple plants, regions, customer sectors, and PPA types
Read More
Dashboard

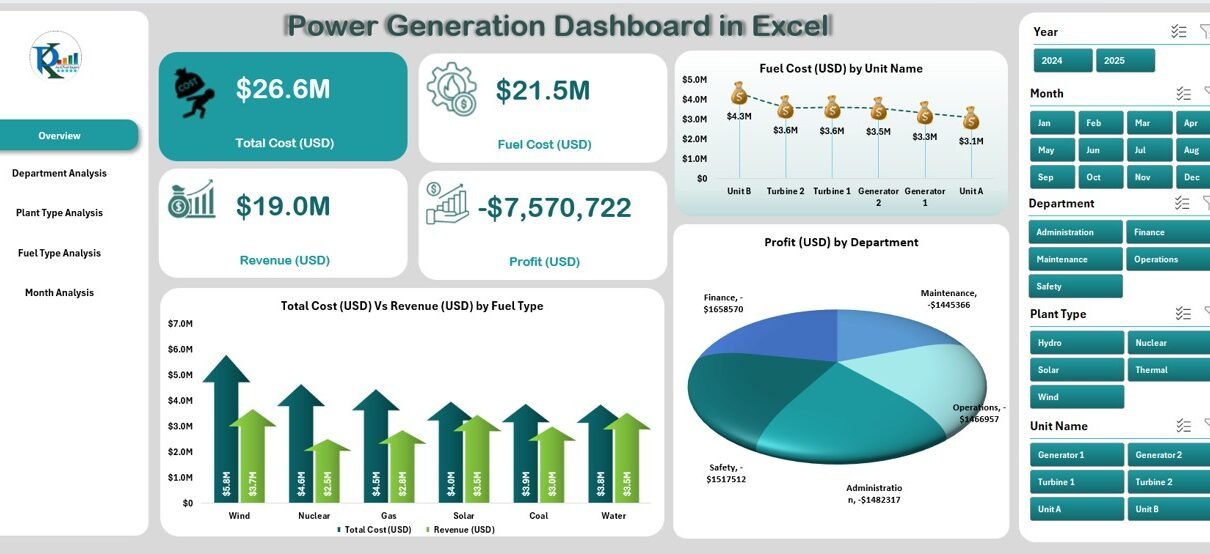
Power Generation Dashboard in Excel

October 30, 2025October 30, 2025 PKComments Off on Power Generation Dashboard in Excel
In today’s energy-driven economy, power generation companies handle complex data daily. From fuel costs and plant types to energy output and profitability, every metric plays a role in operational efficiency
Read More
Templates

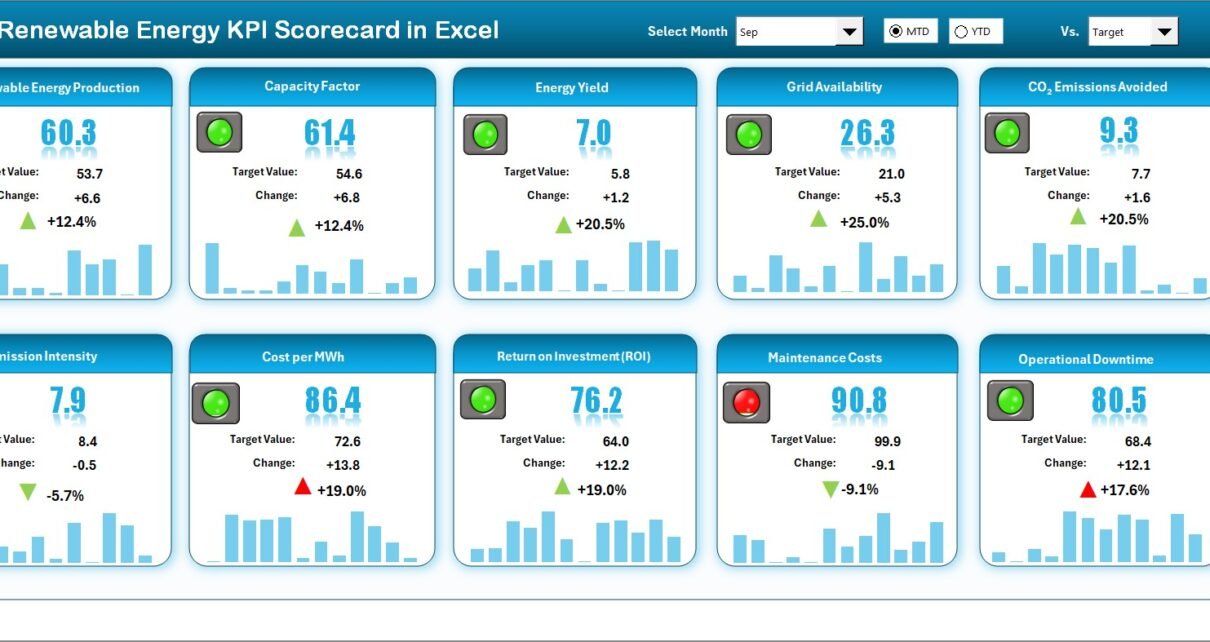
Renewable Energy KPI Scorecard in Excel

October 29, 2025October 29, 2025 PKComments Off on Renewable Energy KPI Scorecard in Excel
The renewable energy industry is growing rapidly, driven by the global need to reduce carbon emissions and transition toward sustainable power sources. However, success in this fast-changing sector depends on
Read More
Dashboard

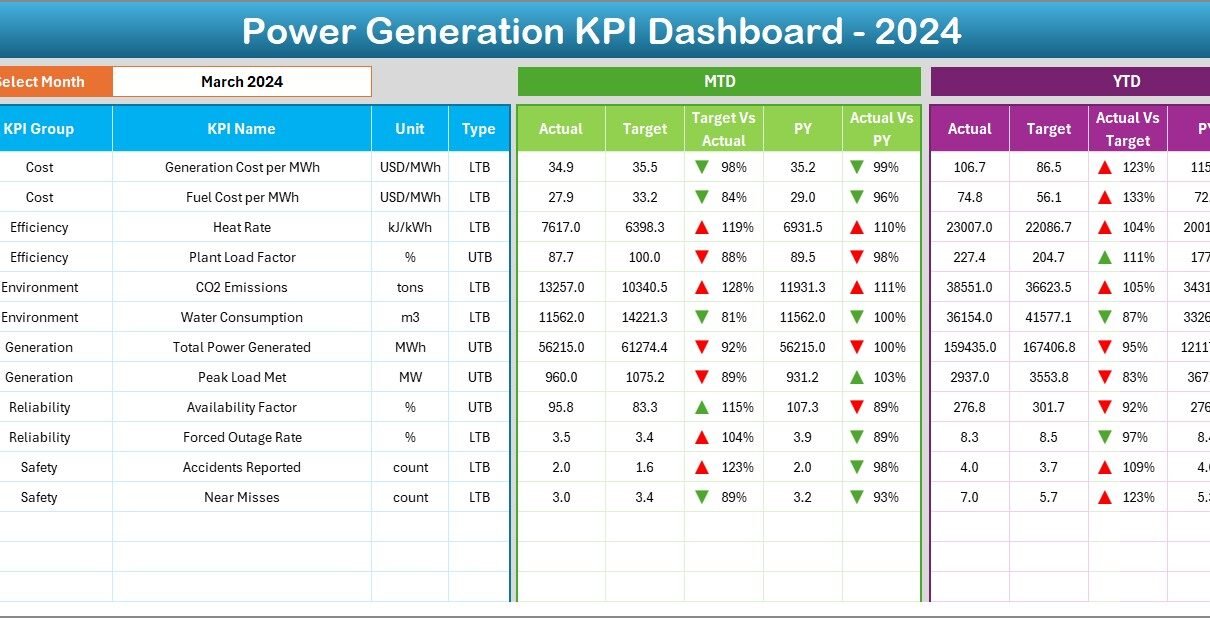
Power Generation KPI Dashboard in Excel

October 1, 2025October 1, 2025 PKComments Off on Power Generation KPI Dashboard in Excel
The power generation industry is one of the most critical sectors in the global economy. From ensuring reliable electricity supply to optimizing plant operations, companies in this sector must consistently
Read More

Posts pagination

Previous 1 2
  • Learn Excel (Free Course)
    • 1. Shortcut Keys
    • 2. Fill & Flash Fill
    • 3. Find & Replace
    • 4. Sort & Filter
    • 5. Formulas & Functions
    • 6. Data Validation
    • 7. Conditional Formatting
    • 8. Basic Charts
    • 9. Advanced Charts
    • 10. Pivot Tables
    • 11. Excel Dashboards
    • 12. VBA Course
    • 13. Excel Formulas with AI
  • Templates
  • Tutorials
    • Charts and Visualization
    • VBA
    • Excel Tips and Tricks
    • Excel Dashboards
    • Power Pivot & DAX
  • Power BI
  • Template Store
    • Ready to Use Templates
  • Courses
  • Academy
    • Excel + AI Mastery: 100 Formulas
    • Excel Pivot Tables & Dashboards
  • About Us
  • Contact Us
Copyright © 2023 PK-AnExcelExpert.com - Privacy Policy