New: NextGenTemplates Academy - video courses on Excel formulas with AI and Pivot Tables & dashboards. Early-bird: 20% off with code EARLYBIRD20 - first 20 orders only. See the courses →
  • Learn Excel (Free Course)
    • 1. Shortcut Keys
    • 2. Fill & Flash Fill
    • 3. Find & Replace
    • 4. Sort & Filter
    • 5. Formulas & Functions
    • 6. Data Validation
    • 7. Conditional Formatting
    • 8. Basic Charts
    • 9. Advanced Charts
    • 10. Pivot Tables
    • 11. Excel Dashboards
    • 12. VBA Course
    • 13. Excel Formulas with AI
  • Templates
  • Tutorials
    • Charts and Visualization
    • VBA
    • Excel Tips and Tricks
    • Excel Dashboards
    • Power Pivot & DAX
  • Power BI
  • Template Store
    • Ready to Use Templates
  • Courses
  • Academy
    • Excel + AI Mastery: 100 Formulas
    • Excel Pivot Tables & Dashboards
  • About Us
  • Contact Us

PK: An Excel Expert

Transforming Data into Decisions

Tag: Renewable Energy Dashboard

Power BI Templates

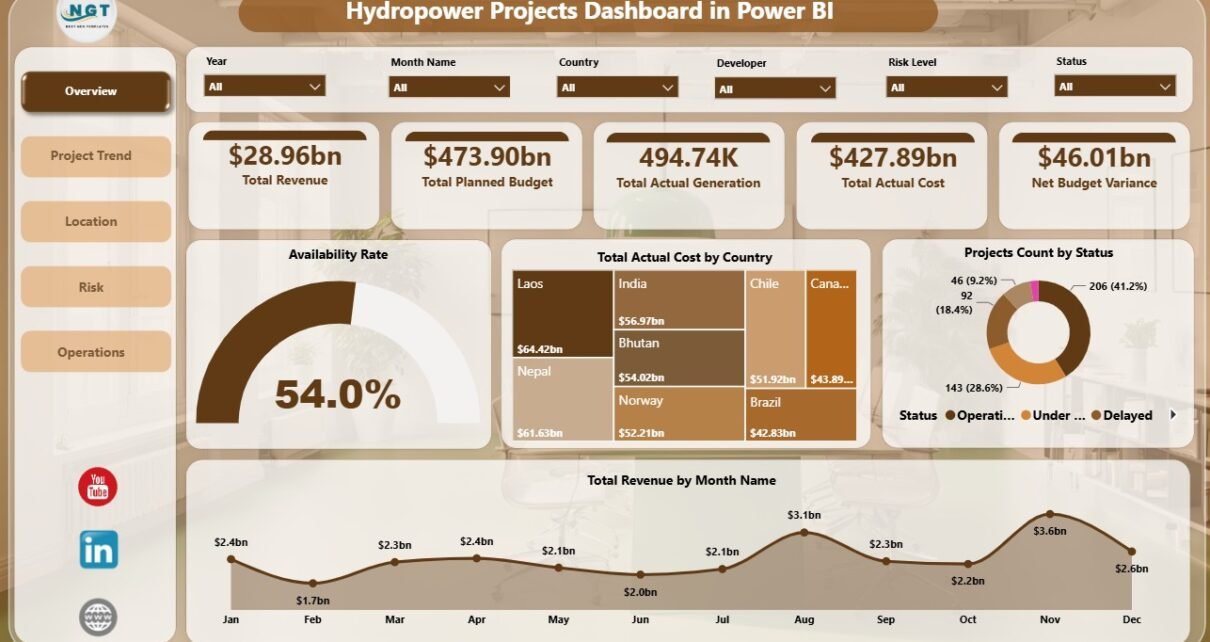
Hydropower Projects Dashboard in Power BI

June 20, 2026June 20, 2026 PKComments Off on Hydropower Projects Dashboard in Power BI
Hydropower projects bring together civil engineering, plant operations, finance, construction monitoring, developers, river basin planning, and renewable energy reporting. A single portfolio can include many countries, plant types, turbine types,
Read More
Clean Tech Dashboard in Power BI - Renewable Energy Portfolio Dashboard
Dashboard Power BI

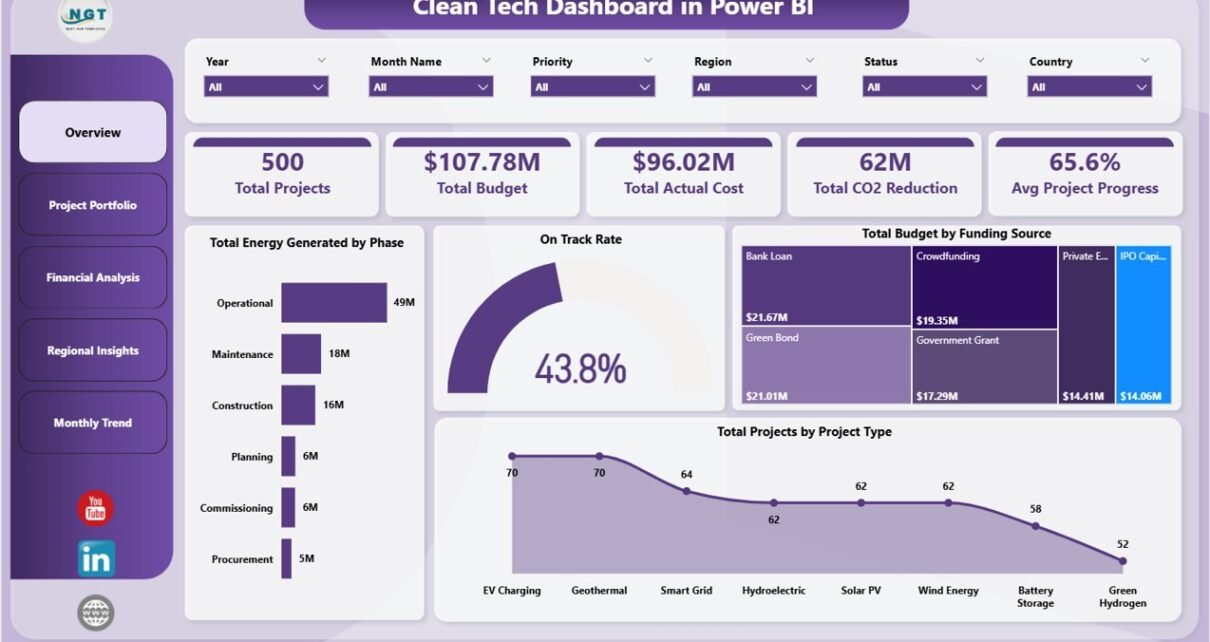
Clean Tech Dashboard in Power BI

May 27, 2026May 27, 2026 PKComments Off on Clean Tech Dashboard in Power BI
The Clean Tech Dashboard in Power BI tracks 5 portfolio-level KPIs across 5 interactive pages, with 13 pre-built charts covering project portfolio, financial performance, regional impact, and monthly trends. Setup
Read More
Dashboard

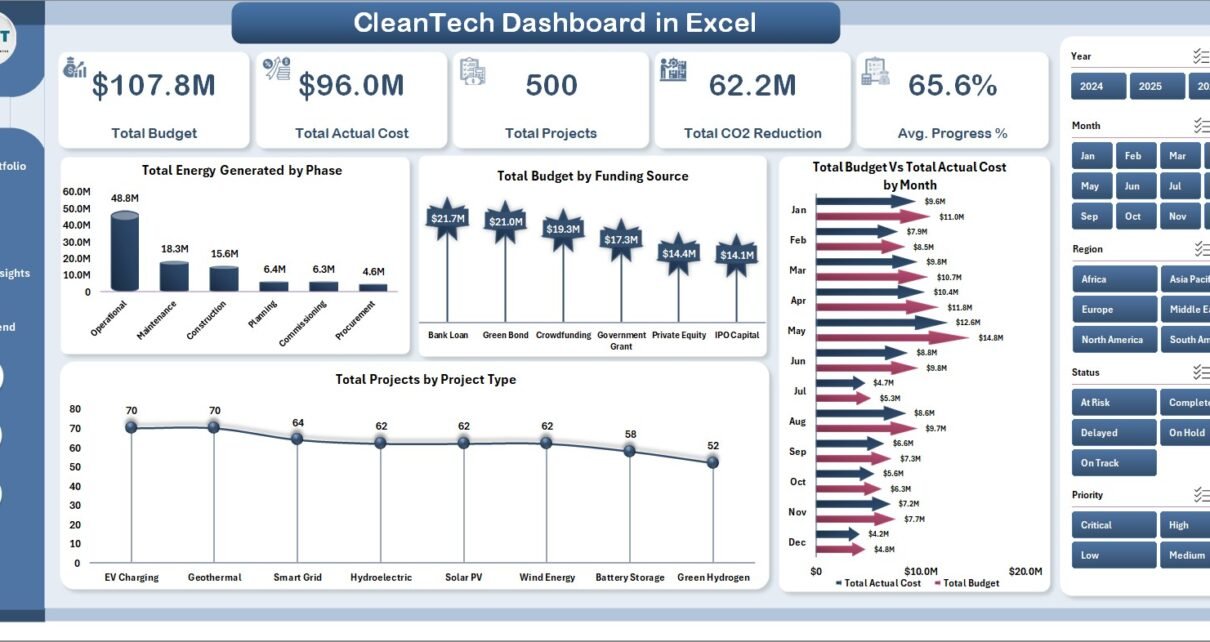
Clean Tech Dashboard in Excel

May 24, 2026May 24, 2026 PKComments Off on Clean Tech Dashboard in Excel
The global clean tech market crossed $1.7 trillion in annual investment in 2024, with renewable energy projects alone accounting for over 540 GW of new capacity additions. Yet most project
Read More
Dashboard Power BI

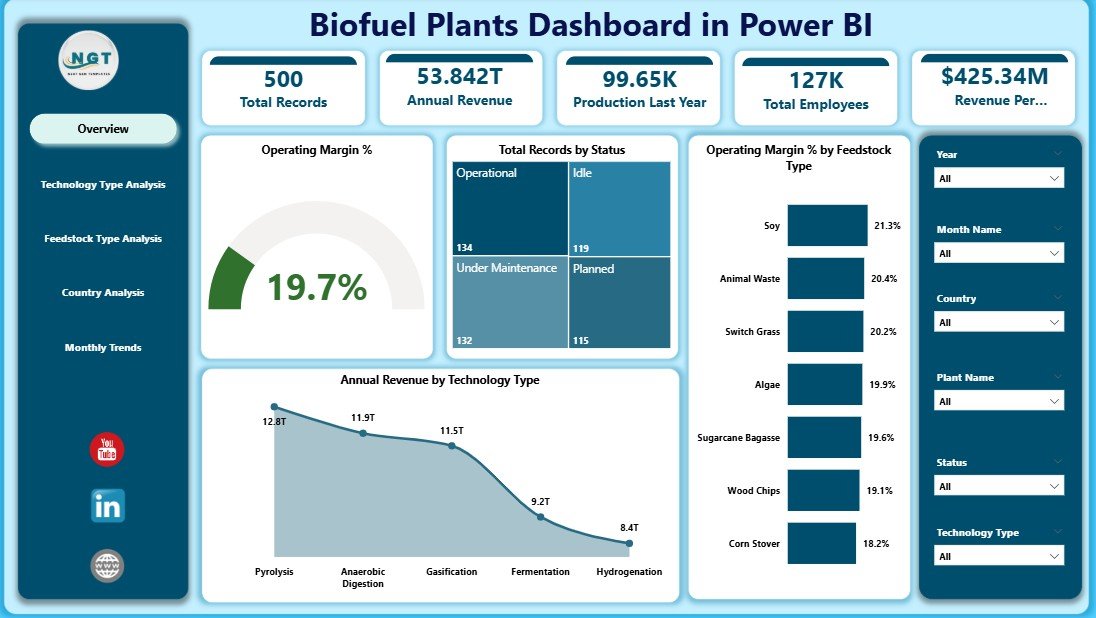
Biofuel Plants Dashboard in Power BI

March 18, 2026March 18, 2026 PKComments Off on Biofuel Plants Dashboard in Power BI
In today’s rapidly evolving renewable energy industry, biofuel plants generate massive amounts of operational and financial data. However, many organizations still struggle to manage this data effectively. As a result,
Read More
Dashboard Power BI

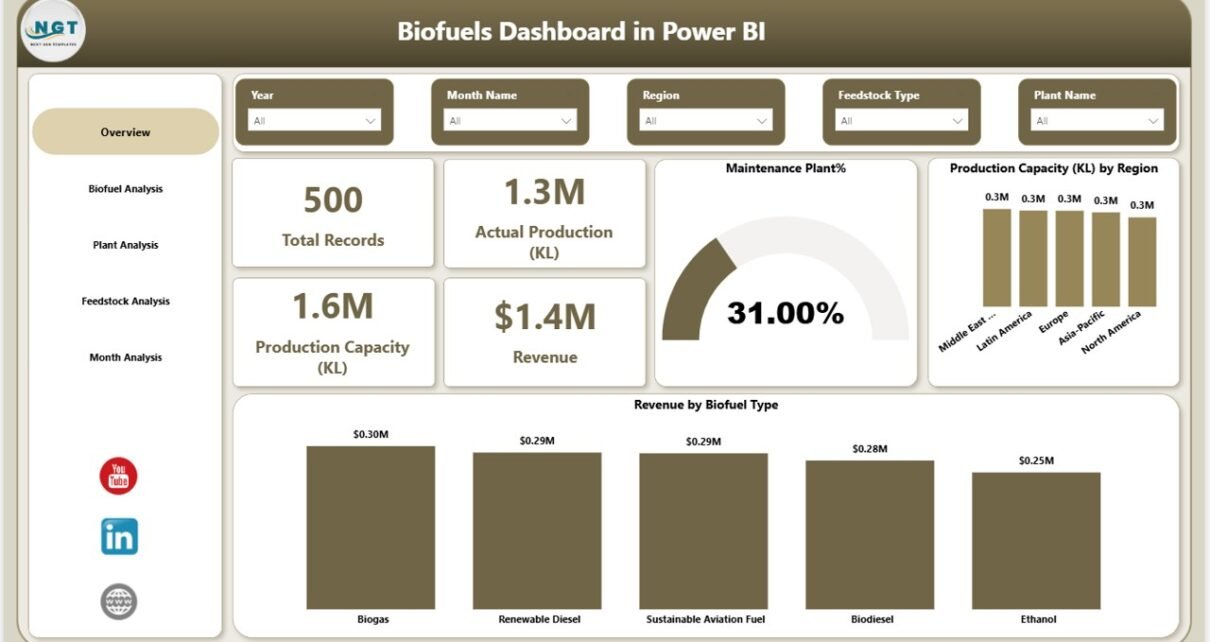
Biofuels Dashboard in Power BI

March 9, 2026March 9, 2026 PKComments Off on Biofuels Dashboard in Power BI
The global energy industry is rapidly shifting toward renewable and sustainable energy sources. Among these alternatives, biofuels play a critical role in reducing carbon emissions and supporting energy security. Governments,
Read More
Dashboard Power BI

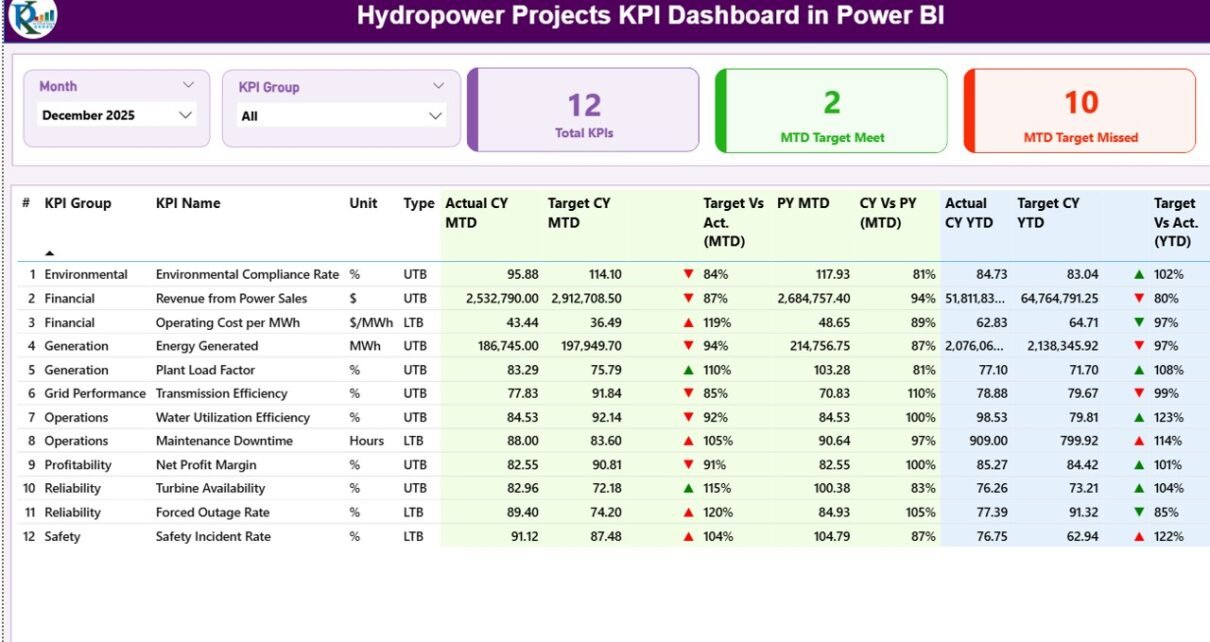
Hydropower Projects KPI Dashboard in Power BI

March 2, 2026March 2, 2026 PKComments Off on Hydropower Projects KPI Dashboard in Power BI
Hydropower projects play a vital role in renewable energy generation across the world. However, managing hydropower operations requires continuous monitoring of performance, efficiency, targets, and operational outcomes. Without structured reporting,
Read More
Dashboard

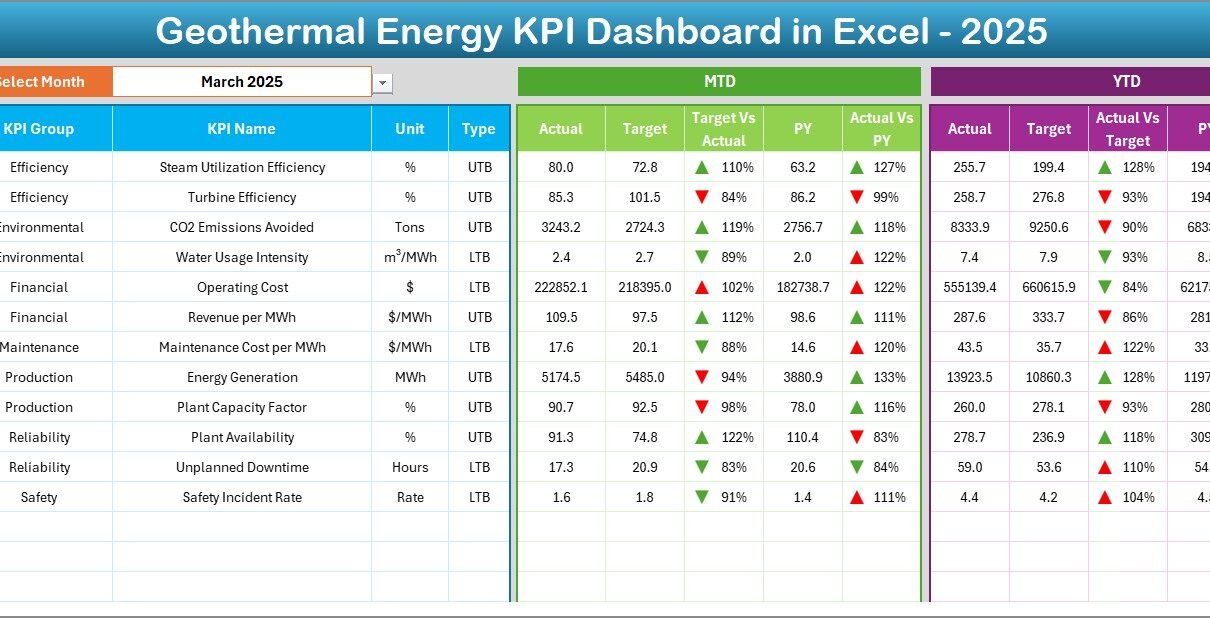
Geothermal Energy KPI Dashboard in Excel

March 2, 2026March 2, 2026 PKComments Off on Geothermal Energy KPI Dashboard in Excel
The renewable energy industry continues to expand rapidly. Among all clean energy sources, geothermal energy stands out because it provides stable, continuous, and environmentally friendly power generation. However, managing geothermal
Read More
Dashboard Power BI

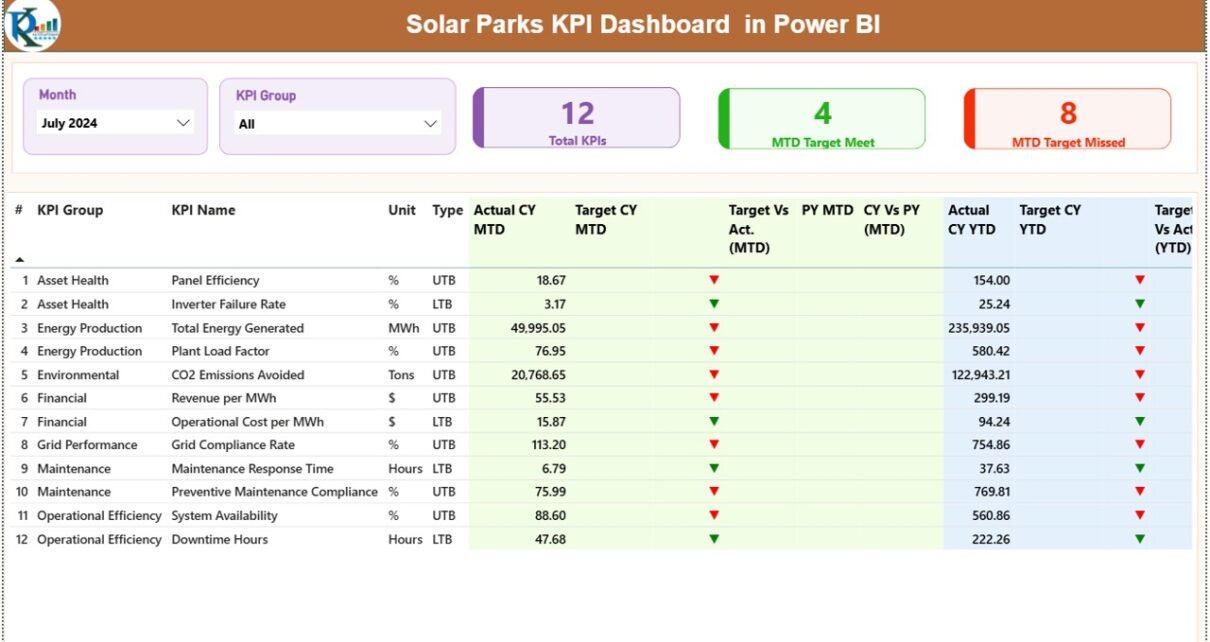
Solar Parks KPI Dashboard in Power BI

March 2, 2026March 2, 2026 PKComments Off on Solar Parks KPI Dashboard in Power BI
Solar energy continues to grow rapidly across the world. Governments, private investors, and renewable energy companies invest heavily in solar parks because they want clean, scalable, and cost-effective electricity generation.
Read More
Dashboard

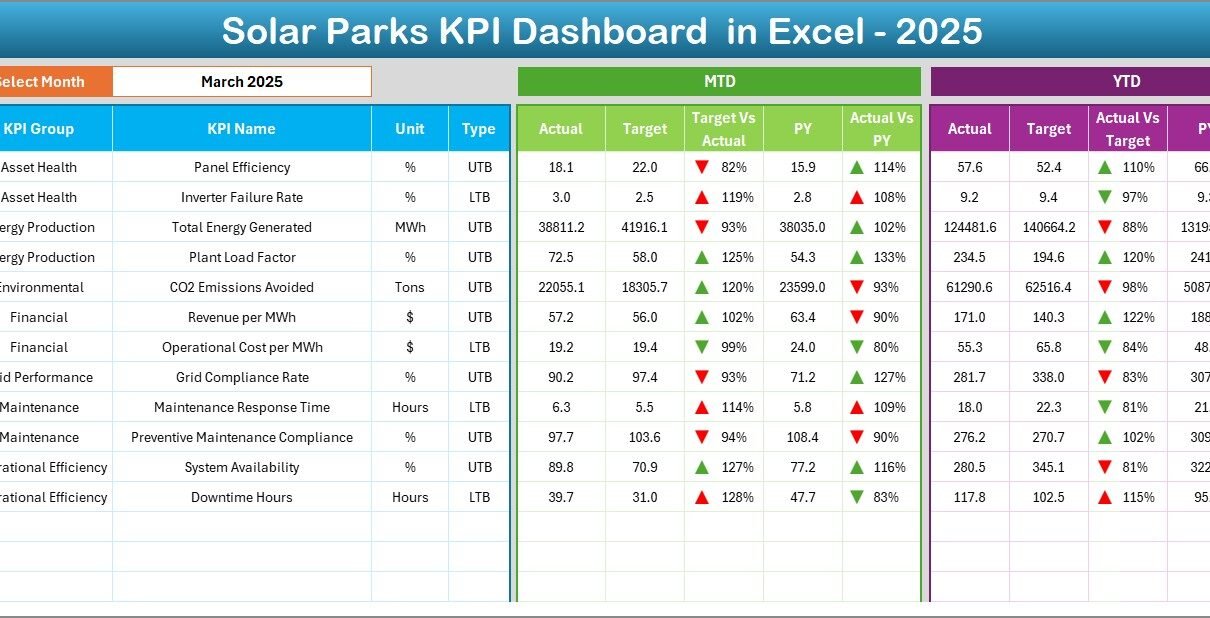
Solar Parks KPI Dashboard in Excel

March 2, 2026March 2, 2026 PKComments Off on Solar Parks KPI Dashboard in Excel
The renewable energy industry continues to grow rapidly, and solar parks now play a major role in global electricity production. However, managing solar park operations requires continuous monitoring, accurate reporting,
Read More
Dashboard Power BI

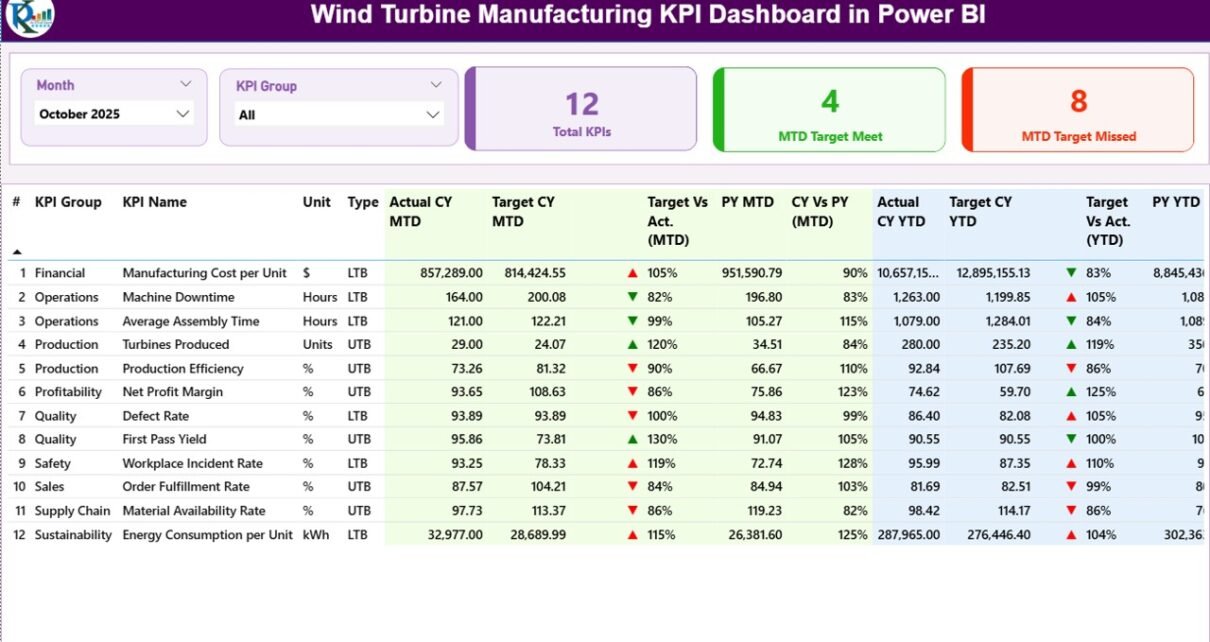
Wind Turbine Manufacturing KPI Dashboard in Power BI

February 23, 2026February 23, 2026 PKComments Off on Wind Turbine Manufacturing KPI Dashboard in Power BI
The renewable energy industry continues to grow rapidly across the world. As countries invest heavily in clean energy, wind turbine manufacturers face increasing pressure to improve productivity, reduce costs, and
Read More

Posts pagination

1 2 Next
  • Learn Excel (Free Course)
    • 1. Shortcut Keys
    • 2. Fill & Flash Fill
    • 3. Find & Replace
    • 4. Sort & Filter
    • 5. Formulas & Functions
    • 6. Data Validation
    • 7. Conditional Formatting
    • 8. Basic Charts
    • 9. Advanced Charts
    • 10. Pivot Tables
    • 11. Excel Dashboards
    • 12. VBA Course
    • 13. Excel Formulas with AI
  • Templates
  • Tutorials
    • Charts and Visualization
    • VBA
    • Excel Tips and Tricks
    • Excel Dashboards
    • Power Pivot & DAX
  • Power BI
  • Template Store
    • Ready to Use Templates
  • Courses
  • Academy
    • Excel + AI Mastery: 100 Formulas
    • Excel Pivot Tables & Dashboards
  • About Us
  • Contact Us
Copyright © 2023 PK-AnExcelExpert.com - Privacy Policy