Infographics with Line Chart in Excel: Use Icons as Markers
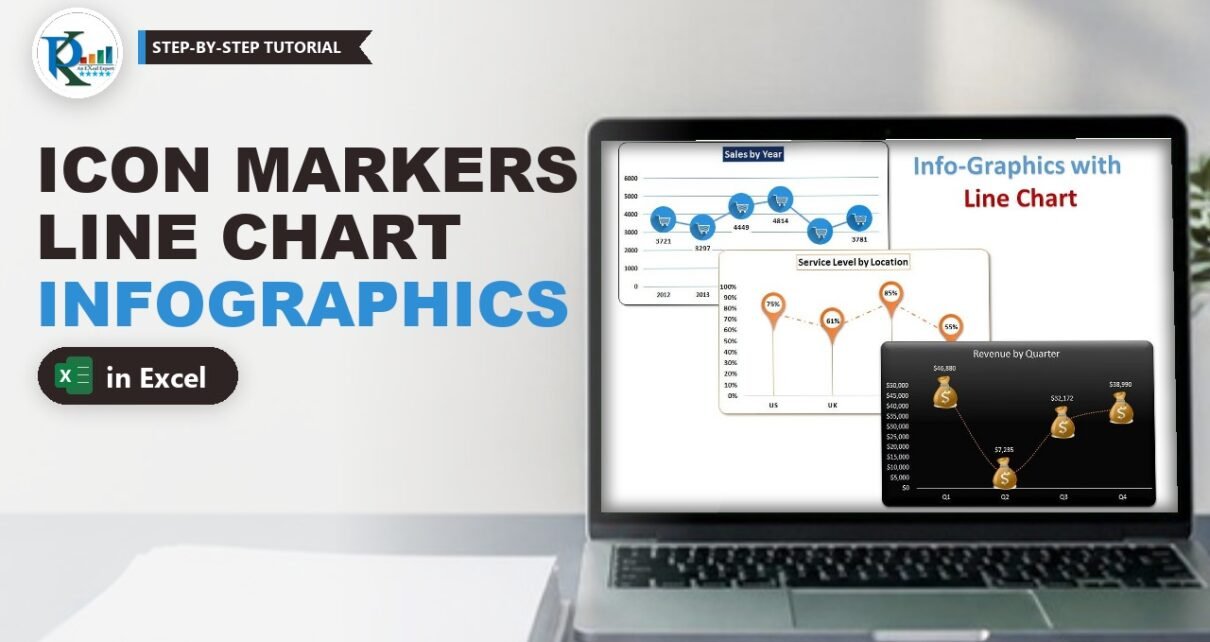
Infographics with a line chart in Excel means swapping the plain round markers for meaningful icons: a shopping cart for sales, a money bag for revenue and a location pin
Transforming Data into Decisions